
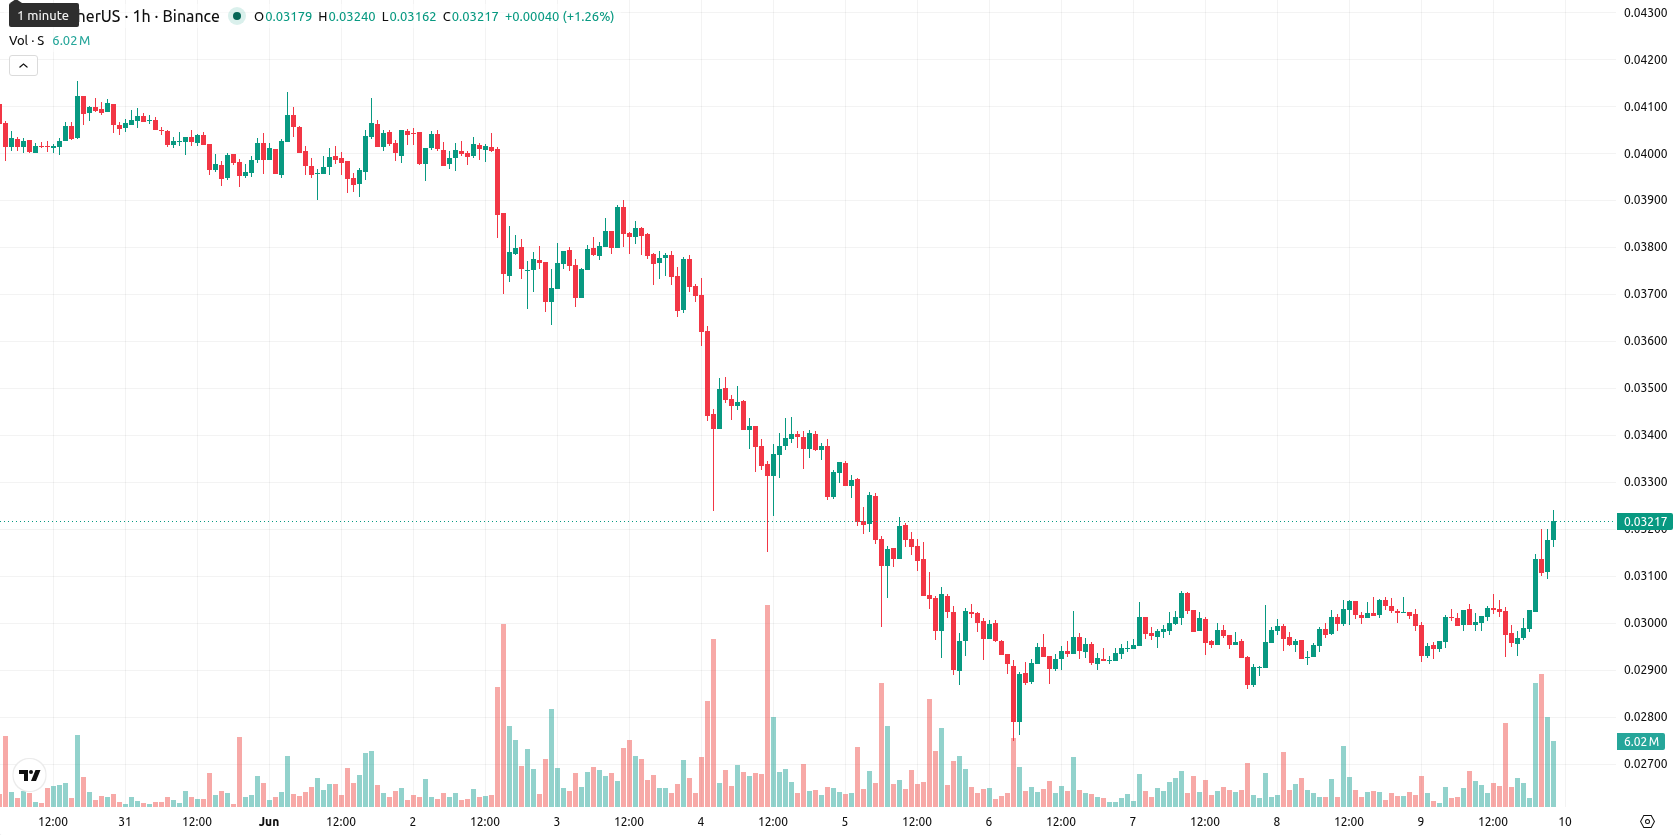
Sonic climbs as price lifts off recent lows well below long-term average

Sonic (S) is trading at $0.0323, up 7.17% on the day. The asset stands above its key moving averages, reflecting short- and medium-term momentum.
Highlights
- Sonic (S/USD) shows short-term bullish momentum as price trades above key short and medium moving averages.
- Momentum indicators suggest rising prices but flash overbought signals, with the overall trend lacking strong confirmation.
- S/USD is forecast to remain within a $0.0297–$0.0349 range over 2–3 days, with a 71% upside probability.
Overbought signals emerge as buyers sustain short-term control
On the H1 chart, S trades above the MA-20 at $0.0302 and MA-50 at $0.0300, while remaining below the longer-term MA-200 at $0.0586. The Ichimoku Kijun provides immediate support at $0.0306. RSI is at 63.46, reflecting buying pressure; MACD delivers a buy signal, and ADX is neutral. Both Stoch RSI and CCI are in overbought territory, hinting at possible short-term exhaustion. Bull/Bear Power (BBP) suggests buyers dominate intraday, though the Awesome Oscillator remains neutral.
Sideways trade seen as breakout hinges on resistance test
Over the coming 2-3 trading days, S is likely to move within the $0.0297 to $0.0349 range, a volatility band relative to current levels. The probability of an upward move stands at 71%, while downside risk is 29%. The base scenario is for sideways action within this corridor, with a bullish breakout targeting the upper band if resistance is breached, and a bearish pattern emerging only if immediate support fails.
Earlier, analysts noted that Sonic was experiencing prevailing bearish momentum alongside heightened downside risks. The current technical landscape suggests this sentiment is shifting, with sustained buying pressure now positioning Sonic for a potential bullish breakout should the asset hold above immediate support.


Latest Sonic News


-
 Afghanistan
-
 Albania
-
 Algeria
-
 Angola
-
 Argentina
-
 Armenia
-
 Australia
-
 Austria
-
 Azerbaijan
-
 Bahamas
-
 Bahrain
-
 Bangladesh
-
 Belarus
-
 Belgium
-
 Bolivia
-
 Botswana
-
 Brazil
-
 Brunei
-
 Bulgaria
-
 Cambodia
-
 Cameroon
-
 Canada
-
 Chile
Chile
-
 China
China
-
 Colombia
-
 Congo
Congo
-
 Costa Rica
-
 Cote d'Ivoire
-
 Croatia
-
 Cuba
Cuba
-
 Cyprus
-
 Czechia
-
 DR Congo
-
 Denmark
-
 Dominican Republic
-
 Ecuador
-
 Egypt
Egypt
-
 El Salvador
-
 Estonia
-
 Eswatini
-
 Ethiopia
-
 Finland
-
 France
-
 Georgia
-
 Germany
-
 Ghana
Ghana
-
 Greece
-
 Haiti
Haiti
-
 Hong Kong
-
 Hungary
-
 India
India
-
 Indonesia
-
 Iran, Islamic republic
-
 Iraq
Iraq
-
 Ireland
-
 Israel
-
 Italy
Italy
-
 Jamaica
-
 Japan
Japan
-
 Jordan
-
 Kazakhstan
-
 Kenya
Kenya
-
 Korea
Korea
-
 Kuwait
-
 Kyrgyzstan
-
 Laos
Laos
-
 Latvia
-
 Lebanon
-
 Lesotho
-
 Libya
Libya
-
 Lithuania
-
 Luxembourg
-
 Madagascar
-
 Malaysia
-
 Malta
Malta
-
 Mauritius
-
 Mexico
-
 Moldova
-
 Mongolia
-
 Montenegro
-
 Morocco
-
 Mozambique
-
 Myanmar
-
 Namibia
-
 Nepal
Nepal
-
 Netherlands
-
 New Zealand
-
 Nigeria
-
 North Macedonia
-
 Norway
-
 Oman
Oman
-
 Pakistan
-
 Palestine
-
 Panama
-
 Papua New Guinea
-
 Paraguay
-
 Peru
Peru
-
 Philippines
-
 Poland
-
 Portugal
-
 Puerto Rico
-
 Qatar
Qatar
-
 Reunion
-
 Romania
-
 Rwanda
-
 Saudi Arabia
-
 Serbia
-
 Singapore
-
 Slovakia
-
 Slovenia
-
 Somalia
-
 South Africa
-
 Spain
Spain
-
 Sri Lanka
-
 Sweden
-
 Switzerland
-
 Syria
Syria
-
 Taiwan
-
 Tajikistan
-
 Tanzania
-
 Thailand
-
 Trinidad and Tobago
-
 Tunisia
-
 Turkey
-
 UAE
UAE
-
 Uganda
-
 Ukraine
-
 United Kingdom
-
United States
-
 Uruguay
-
 Uzbekistan
-
 Venezuela
-
 Vietnam
-
 Yemen
Yemen
-
 Zambia
-
 Zimbabwe
- Forex
- Crypto
