
AST SpaceMobile stock slides slightly as price stays under key moving averages

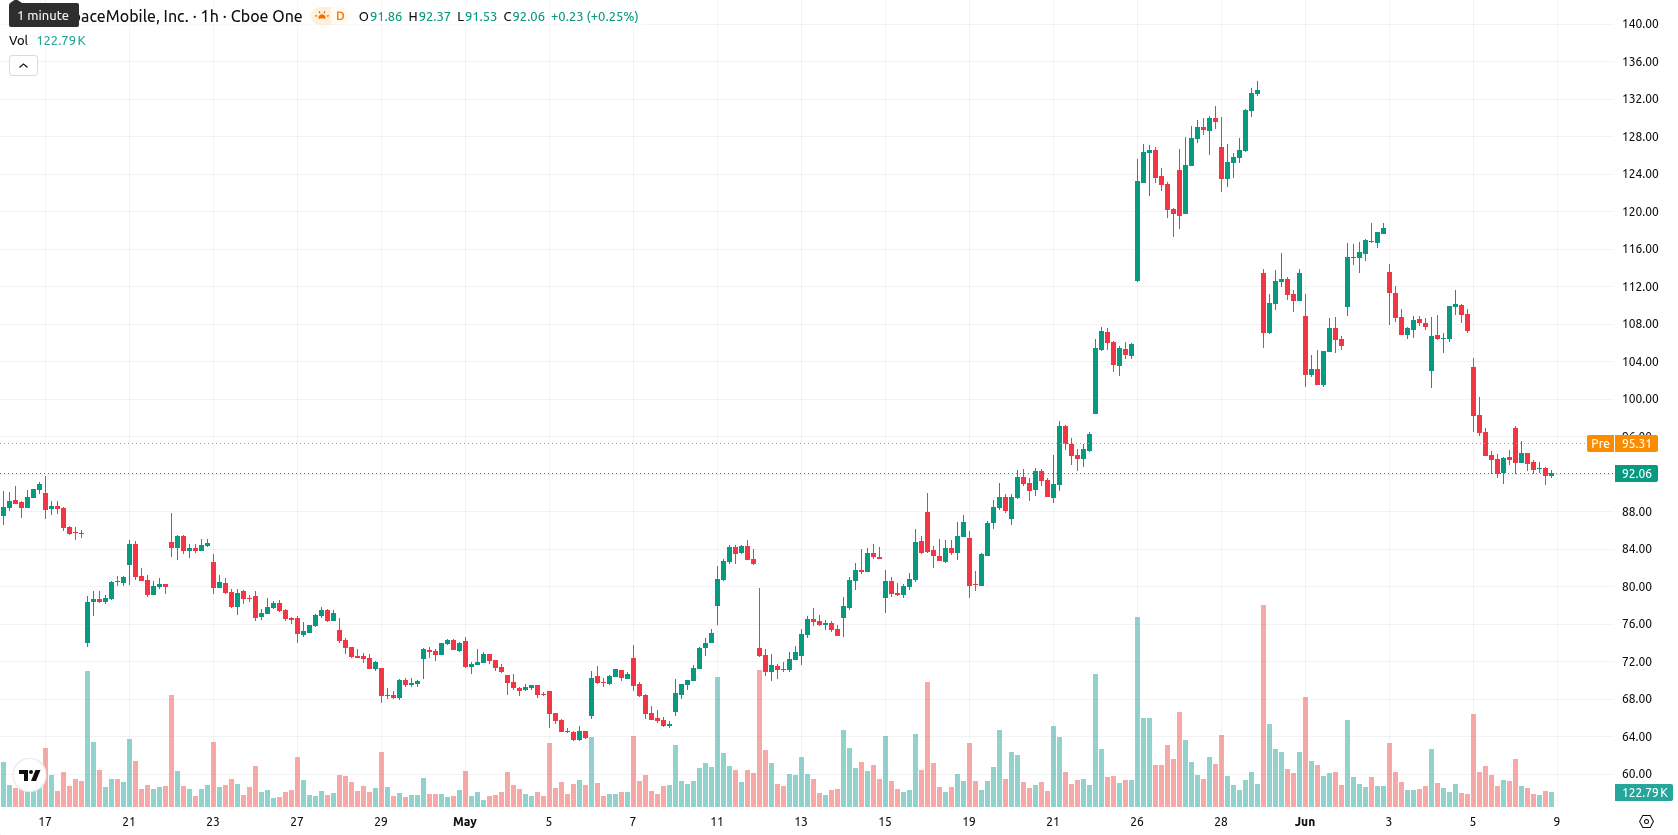
AST SpaceMobile (ASTS) stock is trading at $92.06 after slipping 1.65% today. The price is below its key short- and medium-term moving averages but remains supported by its longer-term average.
Highlights
- AST SpaceMobile completed a commercial satellite launch in late 2024, expanding its operational capacity for direct-to-smartphone services.
- The company's ongoing development of direct-to-smartphone satellite networks enhances its competitive positioning in the satellite internet market.
- Technicals remain bearish as price trades below key averages with negative momentum, projecting a 74% probability of decline between $79.59 and $104.53.
Operational expansion boosts positioning as downward price trend persists
AST SpaceMobile completed the launch of commercial satellites in late 2024, marking an expansion in its operational capacity and strengthening its technical foundation for direct-to-smartphone satellite services. This advancement may lead to broader service capabilities, positioning the company more competitively within the satellite internet market. Continued efforts to develop a direct-to-smartphone network distinguish AST SpaceMobile's approach, though price action has remained under broader selling pressure.
Oversold signals and selling dominance as technical supports hold
On the hourly chart, price remains below the MA-20 at $98.05 and MA-50 at $105.69, indicating persistent selling control over short- and medium-term timeframes. The daily MA-200 at $78.93 continues to serve as a key support base, while the Ichimoku Kijun line at $101.20 now constitutes immediate resistance. Oscillator signals are predominantly negative, with MACD and ADX both aligning on the sell side, RSI at 30.48 signaling an oversold state, and both CCI and BBP confirming sustained selling demand. Divergence appears as Stoch RSI gives a buy signal and the Awesome Oscillator remains neutral, reflecting potential for near-term volatility or a relief bounce.
Sideways bias expected amid heightened downside risk
In the short term, price is expected to fluctuate within a broad range of $79.59 to $104.53, capturing the typical volatility for ASTS. Scenario probabilities point to a 74% likelihood of continued downside, while the chance for a sustained upward move at this stage is only 26%. The base expectation is for sideways movement inside this corridor; a move above $101.20 would be required to signal renewed upward momentum, whereas a decisive break below $79.59 could create further pressure toward the long-term MA-200 support.
Earlier, analysts noted that AST SpaceMobile was under notable short-term selling pressure, despite institutional interest and the potential for an upside shift if positive momentum emerged. The latest technical and operational developments further reinforce a cautious stance, with traders closely monitoring for either a sustained breakdown below long-term support or a decisive move above resistance to signal the next directional bias.


Latest AST SpaceMobile News


-
 Afghanistan
-
 Albania
-
 Algeria
-
 Angola
-
 Argentina
-
 Armenia
-
 Australia
-
 Austria
-
 Azerbaijan
-
 Bahamas
-
 Bahrain
-
 Bangladesh
-
 Belarus
-
 Belgium
-
 Bolivia
-
 Botswana
-
 Brazil
-
 Brunei
-
 Bulgaria
-
 Cambodia
-
 Cameroon
-
 Canada
-
 Chile
Chile
-
 China
China
-
 Colombia
-
 Congo
Congo
-
 Costa Rica
-
 Cote d'Ivoire
-
 Croatia
-
 Cuba
Cuba
-
 Cyprus
-
 Czechia
-
 DR Congo
-
 Denmark
-
 Dominican Republic
-
 Ecuador
-
 Egypt
Egypt
-
 El Salvador
-
 Estonia
-
 Eswatini
-
 Ethiopia
-
 Finland
-
 France
-
 Georgia
-
 Germany
-
 Ghana
Ghana
-
 Greece
-
 Haiti
Haiti
-
 Hong Kong
-
 Hungary
-
 India
India
-
 Indonesia
-
 Iran, Islamic republic
-
 Iraq
Iraq
-
 Ireland
-
 Israel
-
 Italy
Italy
-
 Jamaica
-
 Japan
Japan
-
 Jordan
-
 Kazakhstan
-
 Kenya
Kenya
-
 Korea
Korea
-
 Kuwait
-
 Kyrgyzstan
-
 Laos
Laos
-
 Latvia
-
 Lebanon
-
 Lesotho
-
 Libya
Libya
-
 Lithuania
-
 Luxembourg
-
 Madagascar
-
 Malaysia
-
 Malta
Malta
-
 Mauritius
-
 Mexico
-
 Moldova
-
 Mongolia
-
 Montenegro
-
 Morocco
-
 Mozambique
-
 Myanmar
-
 Namibia
-
 Nepal
Nepal
-
 Netherlands
-
 New Zealand
-
 Nigeria
-
 North Macedonia
-
 Norway
-
 Oman
Oman
-
 Pakistan
-
 Palestine
-
 Panama
-
 Papua New Guinea
-
 Paraguay
-
 Peru
Peru
-
 Philippines
-
 Poland
-
 Portugal
-
 Puerto Rico
-
 Qatar
Qatar
-
 Reunion
-
 Romania
-
 Rwanda
-
 Saudi Arabia
-
 Serbia
-
 Singapore
-
 Slovakia
-
 Slovenia
-
 Somalia
-
 South Africa
-
 Spain
Spain
-
 Sri Lanka
-
 Sweden
-
 Switzerland
-
 Syria
Syria
-
 Taiwan
-
 Tajikistan
-
 Tanzania
-
 Thailand
-
 Trinidad and Tobago
-
 Tunisia
-
 Turkey
-
 UAE
UAE
-
 Uganda
-
 Ukraine
-
 United Kingdom
-
United States
-
 Uruguay
-
 Uzbekistan
-
 Venezuela
-
 Vietnam
-
 Yemen
Yemen
-
 Zambia
-
 Zimbabwe
- Forex
- Crypto
