
Microsoft stock faces bearish momentum with RSI in sell territory: weekly analysis

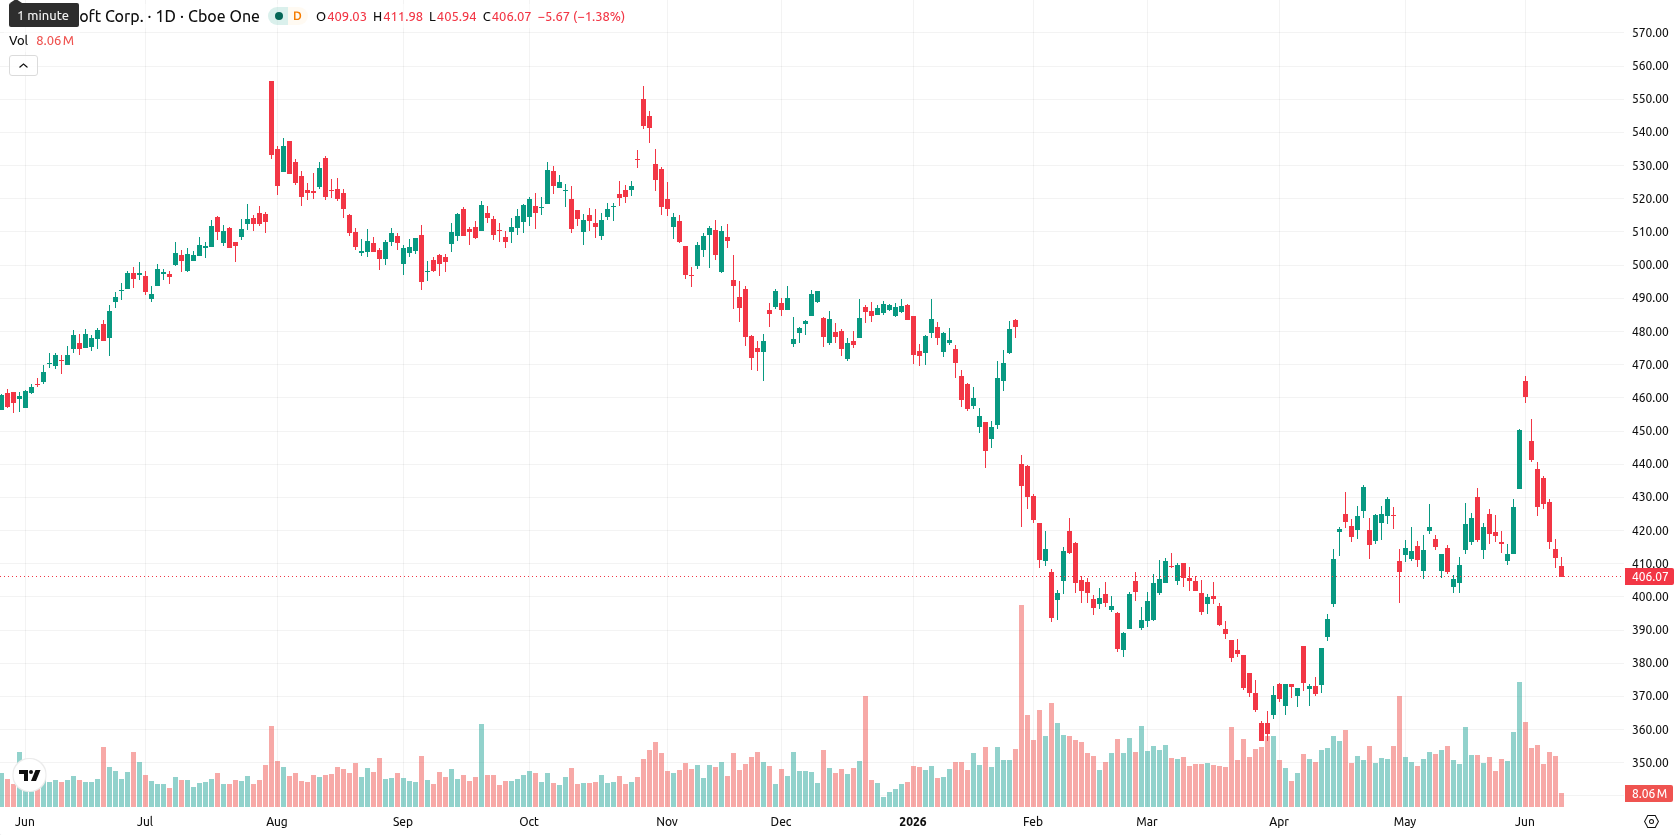
Microsoft Corporation (MSFT) closed the week at $409.25, recording a decline of $5.81 or 2.14% from the previous week. The share price remains just above the 20-week moving average ($404.93) but continues to trade below the 50-week moving average ($462.10) and comfortably above the 200-week moving average ($386.20), reflecting sustained long-term bullish structure despite medium-term downside pressure.
Highlights
- Microsoft shares closed at $409.25, under persistent downside pressure after falling 2.14% last week and finishing at the bottom of their weekly range.
- Momentum indicators across timeframes remain broadly bearish, showing negative MACD, weakening trend strength, and dominance by sellers.
- Price action is expected to be range-bound between $406.50 and $413.50, with a breakout below $406.50 likely triggering further declines toward longer-term support.
AI revenue strength and product launches boost sentiment during the week
Microsoft advanced its in-house artificial intelligence portfolio by launching seven new proprietary models, including the MAI-Thinking-1 reasoning model, at the Build 2026 conference. The company also introduced new Cobalt 200 silicon and the Majorana 2 quantum chip, while Microsoft 365 Copilot is being rolled out across NHS England to over 500,000 staff. Annualized AI business revenue has reached $37 billion, and Azure cloud revenue has topped $75 billion, underlining strong momentum in these segments. In late April, Microsoft finalized a restructured agreement with OpenAI and confirmed a $250 million settlement related to Activision Blizzard merger litigation.
Bearish weekly momentum as technical signals favor sellers
On the weekly chart, MSFT remains above the long-term MA-200 at $386.20 but is under the MA-50 at $462.10, emphasizing ongoing medium-term weakness. Technical momentum is bearish, as the MACD delivers a strong sell signal and the ADX reading at 22.03 points to a weak trend. The weekly RSI remains in sell territory, the Stochastic RSI is neutral but drifting toward oversold levels across shorter timeframes, while the CCI is neutral. Bull/Bear Power shows seller dominance with Microsoft closing at the lower end of the weekly range, and volatility for the week reached 7.78%. Immediate support sits near $407, with weekly resistance approaching $413.
Sideways trading expected next week amid weak bullish signals
Based on the weekly technical configuration, Microsoft is expected to trade sideways in the coming five trading days, likely fluctuating within the $406.50 to $413.50 range. There is a low probability, less than 20%, of a sustained upside move as none of the primary weeklies point to a bullish reversal. A close above $413.50 would be needed to trigger renewed short-term buying, whereas a decisive break below $406.50 would confirm continued bearishness, potentially opening the way to test longer-term supports. The baseline scenario remains limited-range movement between the outlined support and resistance levels.
Earlier, analysts noted that despite Microsoft's ongoing business strength and AI expansion the stock remained technically constrained and biased toward sideways or downside movement. With the latest technical readings indicating persistent bearish momentum and volatility near support, traders should closely monitor the $406.50 level as a potential trigger for broader downside if breached in the coming week.


Latest Microsoft News


-
 Afghanistan
-
 Albania
-
 Algeria
-
 Angola
-
 Argentina
-
 Armenia
-
 Australia
-
 Austria
-
 Azerbaijan
-
 Bahamas
-
 Bahrain
-
 Bangladesh
-
 Belarus
-
 Belgium
-
 Bolivia
-
 Botswana
-
 Brazil
-
 Brunei
-
 Bulgaria
-
 Cambodia
-
 Cameroon
-
 Canada
-
 Chile
Chile
-
 China
China
-
 Colombia
-
 Congo
Congo
-
 Costa Rica
-
 Cote d'Ivoire
-
 Croatia
-
 Cuba
Cuba
-
 Cyprus
-
 Czechia
-
 DR Congo
-
 Denmark
-
 Dominican Republic
-
 Ecuador
-
 Egypt
Egypt
-
 El Salvador
-
 Estonia
-
 Eswatini
-
 Ethiopia
-
 Finland
-
 France
-
 Georgia
-
 Germany
-
 Ghana
Ghana
-
 Greece
-
 Haiti
Haiti
-
 Hong Kong
-
 Hungary
-
 India
India
-
 Indonesia
-
 Iran, Islamic republic
-
 Iraq
Iraq
-
 Ireland
-
 Israel
-
 Italy
Italy
-
 Jamaica
-
 Japan
Japan
-
 Jordan
-
 Kazakhstan
-
 Kenya
Kenya
-
 Korea
Korea
-
 Kuwait
-
 Kyrgyzstan
-
 Laos
Laos
-
 Latvia
-
 Lebanon
-
 Lesotho
-
 Libya
Libya
-
 Lithuania
-
 Luxembourg
-
 Madagascar
-
 Malaysia
-
 Malta
Malta
-
 Mauritius
-
 Mexico
-
 Moldova
-
 Mongolia
-
 Montenegro
-
 Morocco
-
 Mozambique
-
 Myanmar
-
 Namibia
-
 Nepal
Nepal
-
 Netherlands
-
 New Zealand
-
 Nigeria
-
 North Macedonia
-
 Norway
-
 Oman
Oman
-
 Pakistan
-
 Palestine
-
 Panama
-
 Papua New Guinea
-
 Paraguay
-
 Peru
Peru
-
 Philippines
-
 Poland
-
 Portugal
-
 Puerto Rico
-
 Qatar
Qatar
-
 Reunion
-
 Romania
-
 Rwanda
-
 Saudi Arabia
-
 Serbia
-
 Singapore
-
 Slovakia
-
 Slovenia
-
 Somalia
-
 South Africa
-
 Spain
Spain
-
 Sri Lanka
-
 Sweden
-
 Switzerland
-
 Syria
Syria
-
 Taiwan
-
 Tajikistan
-
 Tanzania
-
 Thailand
-
 Trinidad and Tobago
-
 Tunisia
-
 Turkey
-
 UAE
UAE
-
 Uganda
-
 Ukraine
-
 United Kingdom
-
United States
-
 Uruguay
-
 Uzbekistan
-
 Venezuela
-
 Vietnam
-
 Yemen
Yemen
-
 Zambia
-
 Zimbabwe
- Forex
- Crypto
