
MSTR stock price forecast: Watching $111.38–$132.56 range as MSTR trades lower

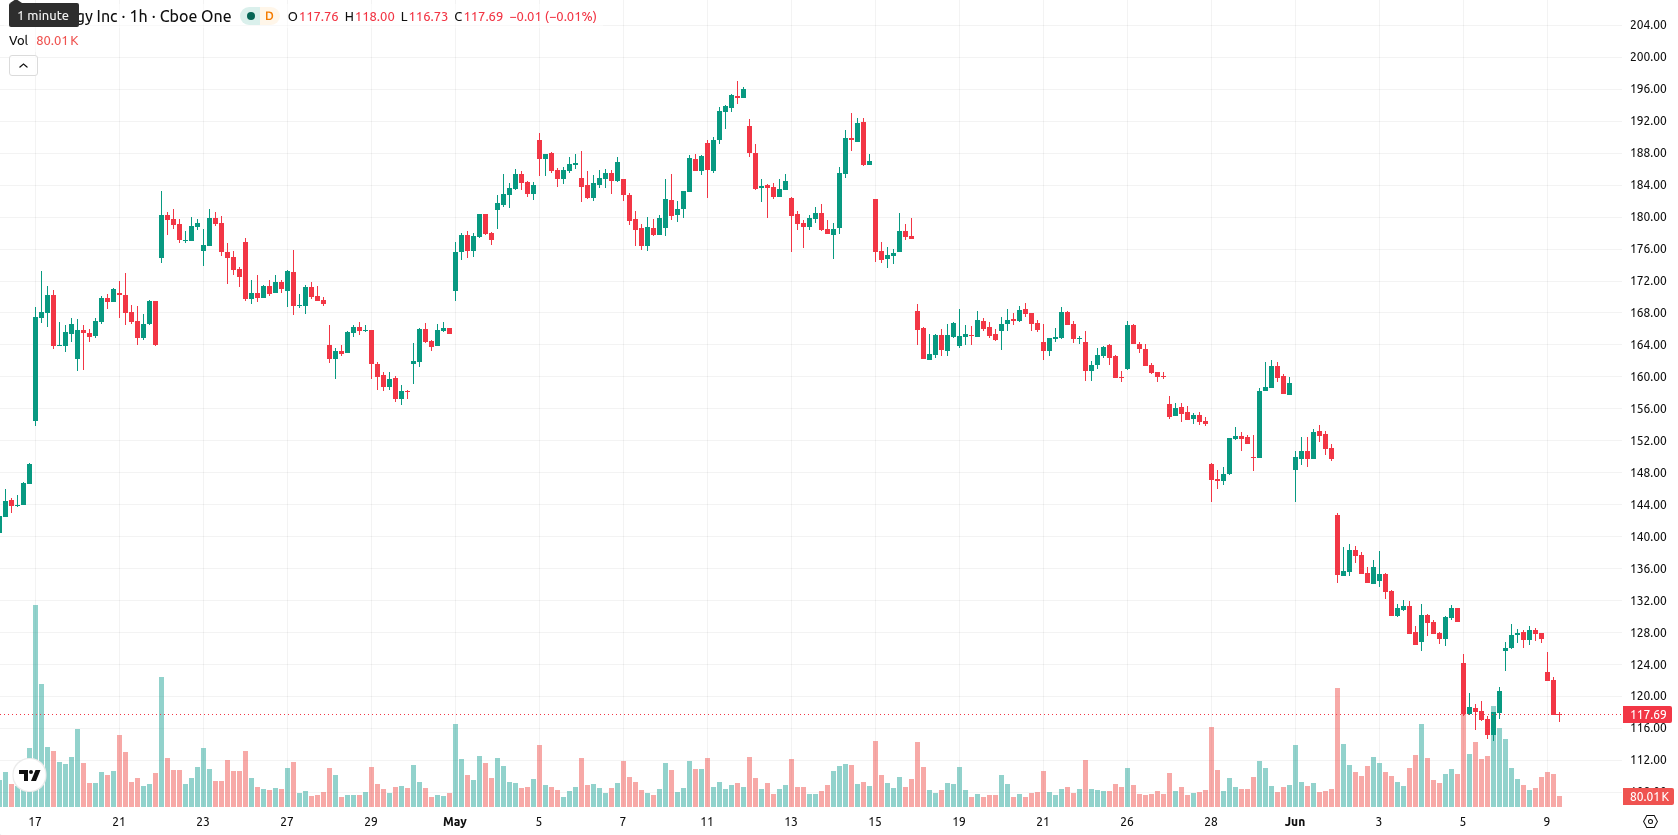
Strategy Incorporated (MSTR, formerly MicroStrategy) stock is trading at $121.97, reflecting a daily decline of 4.11%. The price sits below its key moving averages, indicating broad technical pressure across multiple timeframes.
Highlights
- Strategy Inc. acquired 1,550 Bitcoin for $101.3 million, lowering its average cost basis and boosting digital asset exposure.
- The company funded purchases via $181 million in at-the-market stock sales, increasing liquidity and expanding its float while shifting dividend payments to a semi-monthly schedule.
- Technicals indicate persistent selling pressure, with price forecasted to consolidate between $111.38 and $132.56 and a bearish bias prevailing short-term.
Share float expansion and Bitcoin acquisition as active balance shift
Strategy Inc. recently acquired 1,550 Bitcoin for approximately $101.3 million, reducing its average cost basis on holdings and modestly increasing its net exposure to digital assets. The purchase was funded through $181 million in proceeds from at-the-market sales of common stock, a move that raises liquidity while expanding share float. In addition, the company sold a small portion of its Bitcoin, totaling 32 BTC, to cover dividend obligations on STRC perpetual preferred stock, while shareholders separately approved a move to semi-monthly dividend payments, altering cash flow timing. These developments reflect active balance sheet management and capital raising, though price action has remained under broader selling pressure.
Bearish momentum intensifies as price tests key technical supports
On the technical front, MSTR closed below the SMA-20 and SMA-50 on the hourly chart and is well under the long-term SMA-200. The Ichimoku Kijun level at $123.19 marks immediate resistance, while today’s close came in at $121.97, with a gap down of $3.97 from the previous session and price action gravitating near the daily low. Momentum indicators are decisively negative: MACD points to a strong sell signal, ADX confirms the presence of an ongoing downtrend, and RSI is at 43.81, reinforcing a bearish outlook. However, Stoch RSI and CCI remain neutral, suggesting oscillator-based uncertainty, and BBP signals an oversold condition, indicating dominant seller pressure on an intraday basis.
Limited rebound odds as downside persists within volatility range
For the next 2–3 trading days, price is expected to consolidate within the $111.38 to $132.56 volatility band relative to current levels. The outlook suggests a very low probability of a sustained upward move, with heightened likelihood of further downside action unless there is a break above immediate resistance at $123.19. Should price breach the lower boundary near $111.38, a deeper retracement could develop, while any reversal would first require confirmation above the Kijun level.
Previously it was reported that Strategy shares faced prevailing bearish technical pressures, with limited prospects for immediate upside. In light of recent equity-funded Bitcoin acquisitions and ongoing negative momentum, traders should closely monitor the $123.19 Kijun resistance for signs of any potential trend reversal in the coming sessions.


-
 Afghanistan
-
 Albania
-
 Algeria
-
 Angola
-
 Argentina
-
 Armenia
-
 Australia
-
 Austria
-
 Azerbaijan
-
 Bahamas
-
 Bahrain
-
 Bangladesh
-
 Belarus
-
 Belgium
-
 Bolivia
-
 Botswana
-
 Brazil
-
 Brunei
-
 Bulgaria
-
 Cambodia
-
 Cameroon
-
 Canada
-
 Chile
Chile
-
 China
China
-
 Colombia
-
 Congo
Congo
-
 Costa Rica
-
 Cote d'Ivoire
-
 Croatia
-
 Cuba
Cuba
-
 Cyprus
-
 Czechia
-
 DR Congo
-
 Denmark
-
 Dominican Republic
-
 Ecuador
-
 Egypt
Egypt
-
 El Salvador
-
 Estonia
-
 Eswatini
-
 Ethiopia
-
 Finland
-
 France
-
 Georgia
-
 Germany
-
 Ghana
Ghana
-
 Greece
-
 Haiti
Haiti
-
 Hong Kong
-
 Hungary
-
 India
India
-
 Indonesia
-
 Iran, Islamic republic
-
 Iraq
Iraq
-
 Ireland
-
 Israel
-
 Italy
Italy
-
 Jamaica
-
 Japan
Japan
-
 Jordan
-
 Kazakhstan
-
 Kenya
Kenya
-
 Korea
Korea
-
 Kuwait
-
 Kyrgyzstan
-
 Laos
Laos
-
 Latvia
-
 Lebanon
-
 Lesotho
-
 Libya
Libya
-
 Lithuania
-
 Luxembourg
-
 Madagascar
-
 Malaysia
-
 Malta
Malta
-
 Mauritius
-
 Mexico
-
 Moldova
-
 Mongolia
-
 Montenegro
-
 Morocco
-
 Mozambique
-
 Myanmar
-
 Namibia
-
 Nepal
Nepal
-
 Netherlands
-
 New Zealand
-
 Nigeria
-
 North Macedonia
-
 Norway
-
 Oman
Oman
-
 Pakistan
-
 Palestine
-
 Panama
-
 Papua New Guinea
-
 Paraguay
-
 Peru
Peru
-
 Philippines
-
 Poland
-
 Portugal
-
 Puerto Rico
-
 Qatar
Qatar
-
 Reunion
-
 Romania
-
 Rwanda
-
 Saudi Arabia
-
 Serbia
-
 Singapore
-
 Slovakia
-
 Slovenia
-
 Somalia
-
 South Africa
-
 Spain
Spain
-
 Sri Lanka
-
 Sweden
-
 Switzerland
-
 Syria
Syria
-
 Taiwan
-
 Tajikistan
-
 Tanzania
-
 Thailand
-
 Trinidad and Tobago
-
 Tunisia
-
 Turkey
-
 UAE
UAE
-
 Uganda
-
 Ukraine
-
 United Kingdom
-
United States
-
 Uruguay
-
 Uzbekistan
-
 Venezuela
-
 Vietnam
-
 Yemen
Yemen
-
 Zambia
-
 Zimbabwe
- Forex
- Crypto
