
Texas Instruments stock falls with price staying below short-term averages

Texas Instruments Incorporated (TXN) stock is trading at $276.73 after a decline of 4.84% today, with the price positioned below its key moving averages on shorter timeframes and remaining above its long-term trend line.
Highlights
- TXN/USD faces pronounced short- and medium-term bearish momentum, trading below key moving averages with sellers in control.
- Momentum and oscillator signals confirm oversold conditions and reinforce continued bearish sentiment, with little evidence of immediate reversal.
- Price is forecast to consolidate between $264.27 and $290.00 over the next 2–3 trading days, with downside scenarios favored.
Negative momentum intensifies as sellers test oversold territory
On the technical side, TXN/USD is trading below the MA-20 ($292.10) and MA-50 ($298.81) on the working timeframe, while staying above the MA-200 ($206.39) on the daily chart. The Ichimoku Kijun level of $296.50 stands out as immediate resistance. Momentum indicators on the hourly chart are negative: MACD and ADX show a sell signal, RSI is at 33 indicating a selling stance, while CCI and BBP are in oversold territory. Stoch RSI is neutral, with oversold conditions lacking a reversal spark. BBP and AO both indicate sellers dominate intraday direction.
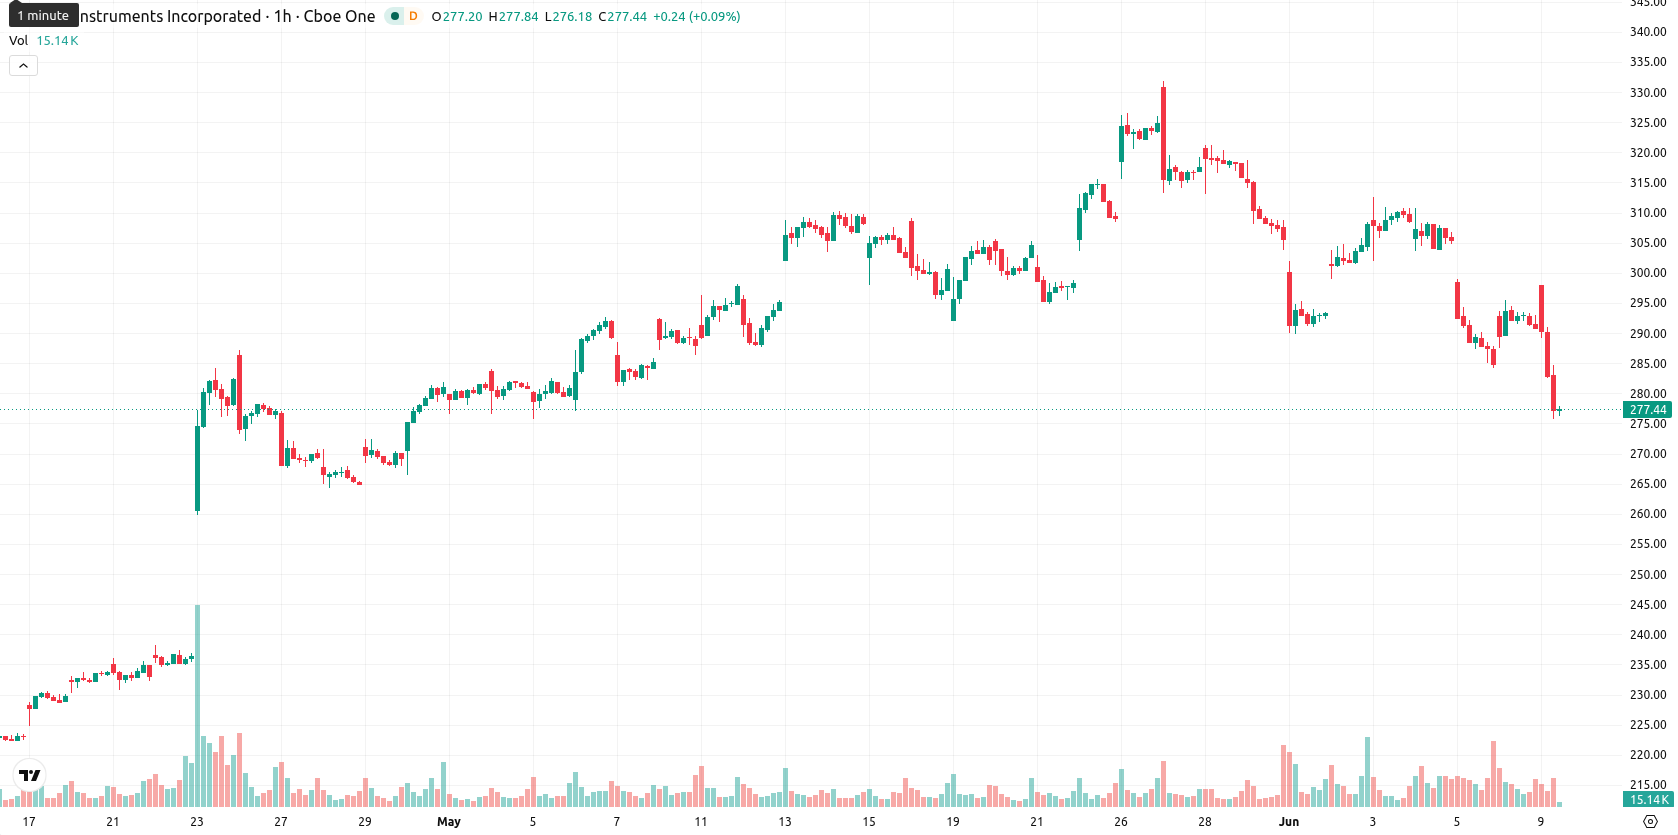
Downside consolidation likely as retracement risk remains low
Over the next two to three trading days, TXN is expected to fluctuate within a band of $264.27 to $290.00, based on typical volatility. There is a 22% probability of an upward retracement, making a further downside move more likely. The base scenario calls for consolidation in the $264–$290 corridor; a break above $296.50 would open the door for a bullish scenario, while a decisive move below $264.27 would suggest further declines.
Earlier, analysts noted that Texas Instruments was displaying persistent bearish momentum and downside risk amid diverging technical signals. The current setup reinforces this defensive outlook, with strengthened selling pressure suggesting that traders should closely monitor for a potential breakdown below $264.27 as the next critical risk event.


Latest Texas Instruments News


-
 Afghanistan
-
 Albania
-
 Algeria
-
 Angola
-
 Argentina
-
 Armenia
-
 Australia
-
 Austria
-
 Azerbaijan
-
 Bahamas
-
 Bahrain
-
 Bangladesh
-
 Belarus
-
 Belgium
-
 Bolivia
-
 Botswana
-
 Brazil
-
 Brunei
-
 Bulgaria
-
 Cambodia
-
 Cameroon
-
 Canada
-
 Chile
Chile
-
 China
China
-
 Colombia
-
 Congo
Congo
-
 Costa Rica
-
 Cote d'Ivoire
-
 Croatia
-
 Cuba
Cuba
-
 Cyprus
-
 Czechia
-
 DR Congo
-
 Denmark
-
 Dominican Republic
-
 Ecuador
-
 Egypt
Egypt
-
 El Salvador
-
 Estonia
-
 Eswatini
-
 Ethiopia
-
 Finland
-
 France
-
 Georgia
-
 Germany
-
 Ghana
Ghana
-
 Greece
-
 Haiti
Haiti
-
 Hong Kong
-
 Hungary
-
 India
India
-
 Indonesia
-
 Iran, Islamic republic
-
 Iraq
Iraq
-
 Ireland
-
 Israel
-
 Italy
Italy
-
 Jamaica
-
 Japan
Japan
-
 Jordan
-
 Kazakhstan
-
 Kenya
Kenya
-
 Korea
Korea
-
 Kuwait
-
 Kyrgyzstan
-
 Laos
Laos
-
 Latvia
-
 Lebanon
-
 Lesotho
-
 Libya
Libya
-
 Lithuania
-
 Luxembourg
-
 Madagascar
-
 Malaysia
-
 Malta
Malta
-
 Mauritius
-
 Mexico
-
 Moldova
-
 Mongolia
-
 Montenegro
-
 Morocco
-
 Mozambique
-
 Myanmar
-
 Namibia
-
 Nepal
Nepal
-
 Netherlands
-
 New Zealand
-
 Nigeria
-
 North Macedonia
-
 Norway
-
 Oman
Oman
-
 Pakistan
-
 Palestine
-
 Panama
-
 Papua New Guinea
-
 Paraguay
-
 Peru
Peru
-
 Philippines
-
 Poland
-
 Portugal
-
 Puerto Rico
-
 Qatar
Qatar
-
 Reunion
-
 Romania
-
 Rwanda
-
 Saudi Arabia
-
 Serbia
-
 Singapore
-
 Slovakia
-
 Slovenia
-
 Somalia
-
 South Africa
-
 Spain
Spain
-
 Sri Lanka
-
 Sweden
-
 Switzerland
-
 Syria
Syria
-
 Taiwan
-
 Tajikistan
-
 Tanzania
-
 Thailand
-
 Trinidad and Tobago
-
 Tunisia
-
 Turkey
-
 UAE
UAE
-
 Uganda
-
 Ukraine
-
 United Kingdom
-
United States
-
 Uruguay
-
 Uzbekistan
-
 Venezuela
-
 Vietnam
-
 Yemen
Yemen
-
 Zambia
-
 Zimbabwe
- Forex
- Crypto
