Best Moving Average Strategies: Tips For Effective Use


Editorial Note: While we adhere to strict Editorial Integrity, this post may contain references to products from our partners. Here's an explanation for How We Make Money. None of the data and information on this webpage constitutes investment advice according to our Disclaimer.
The best moving average crossover strategies are:
Moving averages are used to analyze prices and find market trends. This tool helps to identify key movements, eliminating the influence of random fluctuations. In this article, we have analyzed recommendations for using moving averages to build effective trading strategies. The material will be useful for traders of any level who want to improve the accuracy of their decisions and increase the effectiveness of transactions.
Best strategies of using moving averages
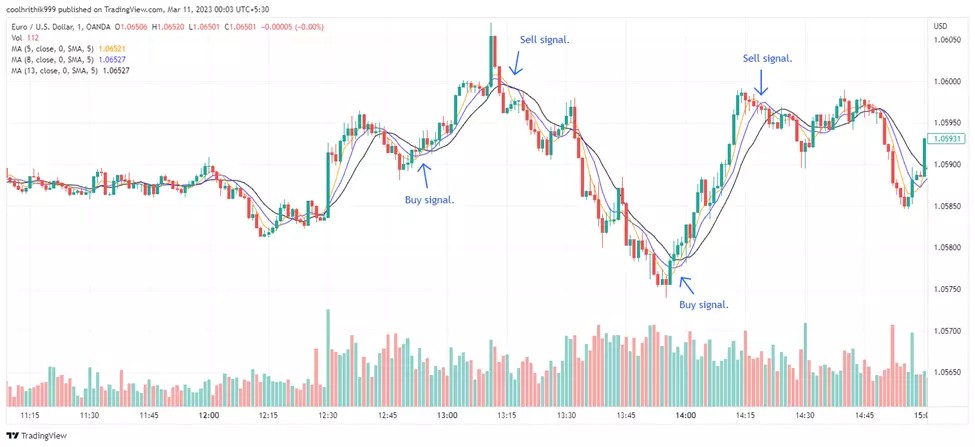
Moving average tape entry strategy
Uses a combination of 5-, 8-, and 13-day simple moving averages (SMA) on two-minute charts. Buying or selling is done in the direction of the trend when the tapes line up, indicating a steady move up or down. In a flat market, when the price crosses the tapes, it is recommended to wait for the lines to level out with an increase in the distance between them, which signals the formation of a trend.
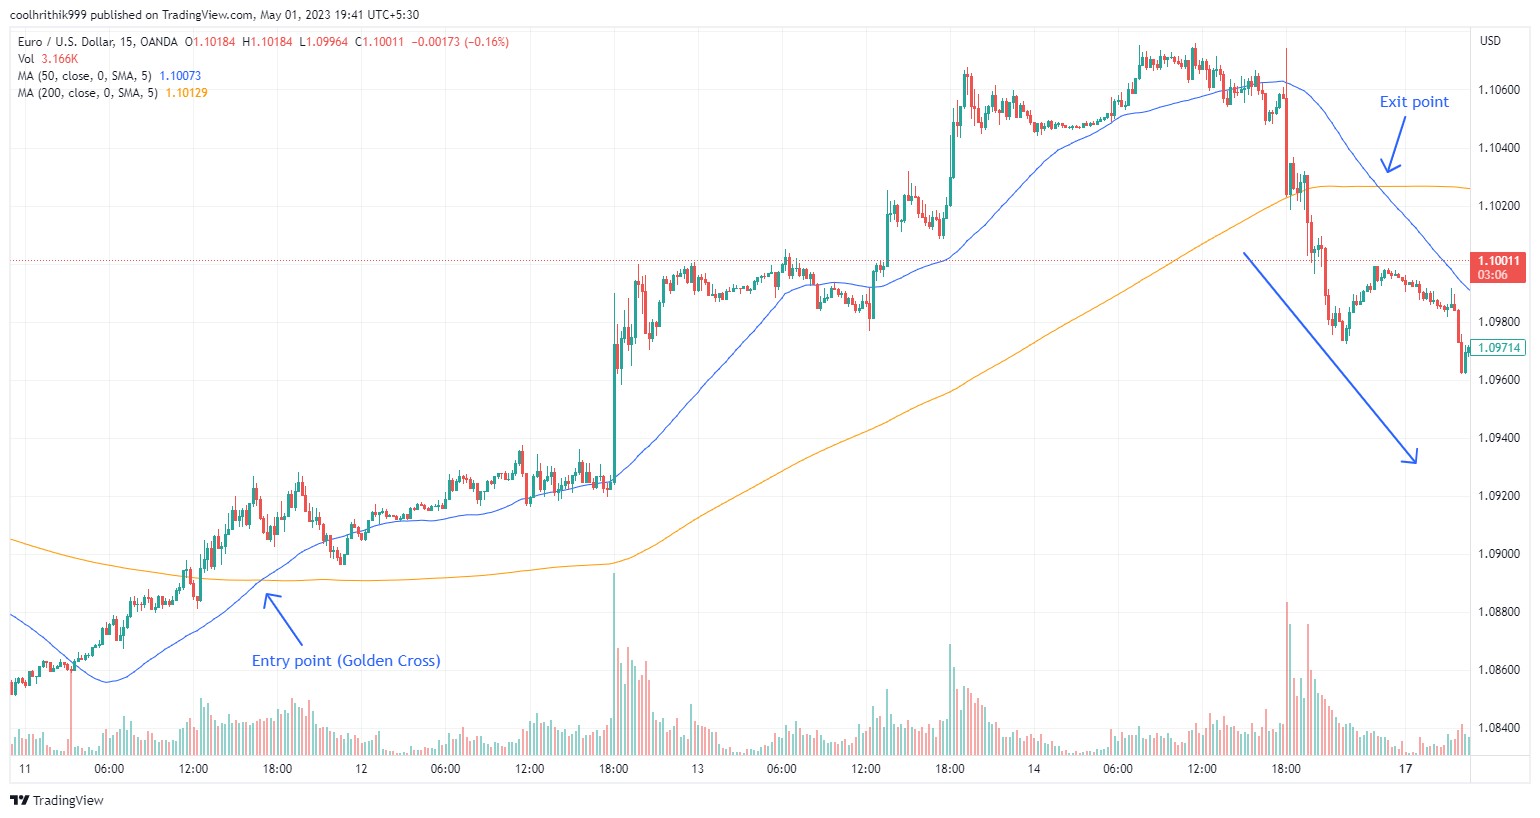
Golden cross strategy
The Golden Cross strategy is a popular technical analysis tool signaling a potential shift to a bullish market trend. It involves the 50-day simple moving average (SMA) crossing above the 200-day SMA, suggesting that recent price momentum is gaining strength. Traders usually open long positions when this crossover occurs and holds as long as the 50-day SMA stays above the 200-day SMA. The strategy aims to capitalize on extended uptrends and confirms reliability when the crossover is sustained through the day’s close. Positions are exited when the 50-day SMA falls below the 200-day SMA, signaling the potential onset of a bearish trend.
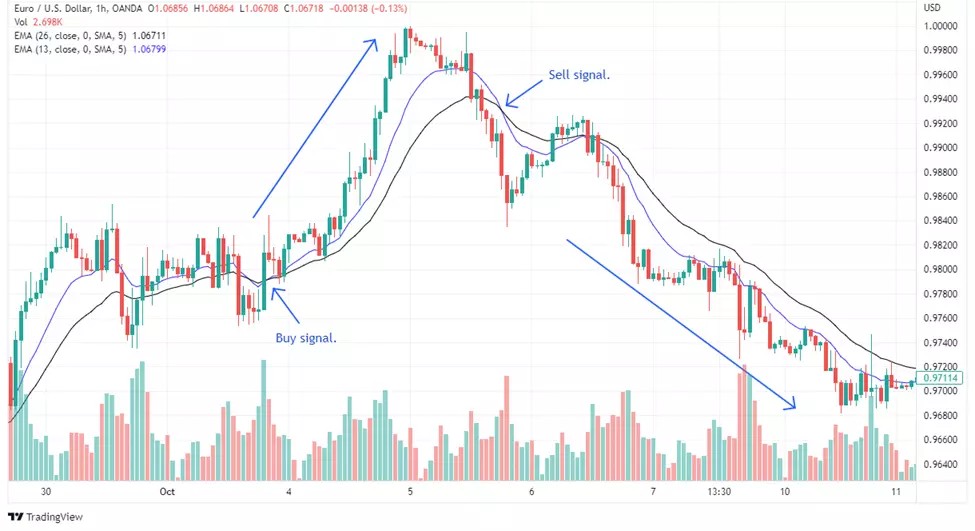
13-EMA and 26-EMA Strategy
The 13-EMA and 26-EMAstrategy is a commonly used method for identifying trend reversals and potential entry or exit points in trading. In this strategy, traders watch for when the 13-period exponential moving average (EMA) crosses the 26-period EMA. A bullish signal is generated when the 13-EMA crosses above the 26-EMA, suggesting an upward momentum and prompting traders to consider entering long positions. Conversely, when the 13-EMA crosses below the 26-EMA, it indicates a bearish trend, signaling traders to exit long positions or consider short opportunities. This crossover strategy helps traders capture medium-term trends and adjust positions accordingly to maximize potential gains or minimize risks.
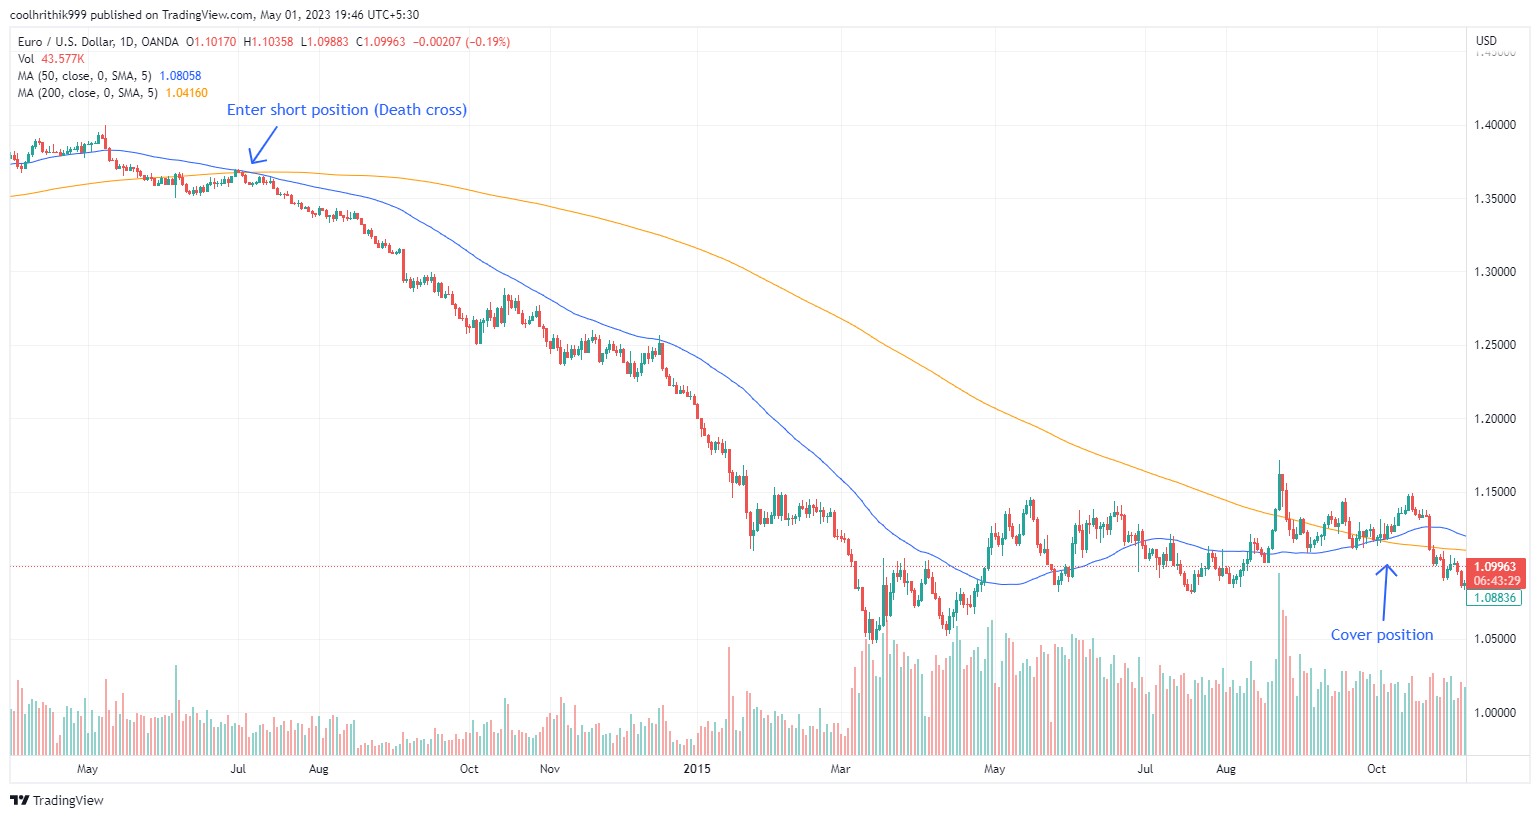
Death cross strategy
The death cross strategy is a bearish indicator used by traders to signal a potential market downturn. This strategy occurs when the 50-day simple moving average (SMA) crosses below the 200-day SMA on a price chart, indicating that short-term momentum has weakened relative to long-term trends. The death cross is often interpreted as a signal to sell or short assets, as it suggests an ongoing or upcoming bearish phase. While it has historically predicted some significant market declines, it can also produce false signals during volatile or sideways market conditions. Traders often use it in conjunction with other technical indicators to confirm trends and enhance decision-making.
What is a moving average?
A moving average is a technical analysis tool used to identify trends and determine entry and exit points in the markets. It is calculated as the average value of a data set over a certain period, which shifts as new values are added. The first value is determined by averaging the initial subset of data.
Moving averages are built on data for different time periods - from minutes to hours, depending on the preferences of the trader. However, they are lagging indicators, since they are based on historical data.
Fast moving averages, calculated on short intervals, react more quickly to changes in market conditions than slow averages with long periods. At the same time, fast averages are less susceptible to short-term price fluctuations, which makes them suitable for short-term trading strategies.
Moving averages are used to analyze prices, profitability, trading volume and other financial indicators. Their use allows traders to better assess market trends, find points for opening and closing positions and improve trading results.
Types of moving averages
Moving averages are calculated using different methods, each of which is suitable for certain trading strategies. Below are the main types:
Simple Moving Average (SMA). This is calculated by averaging the data over a specific period. It is used for straightforward analysis and is effective for identifying basic trends.
Weighted Moving Average (WMA). This type assigns greater weight to more recent data points, making it more responsive to current price movements. It is useful when recent data needs to be emphasized for more accurate short-term analysis.
Exponential Moving Average (EMA). This moving average increases the significance of the most recent data, allowing it to react faster to price changes compared to the SMA or WMA. It is well-suited for dynamic and fast-moving market conditions.
Smoothed Moving Average (SMMA). This type incorporates both the previous moving average and the current value, leading to a smoother curve that reduces volatility. It is commonly applied in long-term trend analysis to filter out market noise.
Adaptive Moving Average (AMA). This moving average adjusts its sensitivity according to the asset’s volatility. It is versatile, enabling effective analysis in both highly volatile and stable market conditions.
Which brokers are good for working with indicators
The best brokers are those integrated with the TradingView platform, which offers a wide range of built-in and custom indicators. When choosing a broker, you should also consider whether it is regulated and has low commissions to ensure reliability and minimize costs.
| TradingView | Demo | ECN Spread EUR/USD | ECN Spread GBP/USD | Max. Regulation Level | Open an account | |
|---|---|---|---|---|---|---|
| Yes | Yes | No | No | Tier-1 | Open an account Your capital is at risk. |
|
| Yes | Yes | 0,1 | 0,15 | Tier-1 | Open an account Your capital is at risk.
|
|
| Yes | Yes | 0,15 | 0,2 | Tier-1 | Open an account Your capital is at risk. |
|
| Yes | Yes | 0,2 | 0,4 | Tier-1 | Study review | |
| Yes | Yes | 0,2 | 0,3 | Tier-1 | Open an account Your capital is at risk. |
How to use moving averages
Moving averages help analyze trends and find entry and exit points. These approaches allow you to more accurately assess market dynamics and adjust your actions:
Choosing a moving average type. Determine which type (SMA, EMA, WMA, SMMA, AMA) suits your strategy.
Setting the calculation period. For long-term trends, use longer periods, for short-term ones - short ones.
Combination of several averages. Use averages with different periods to analyze short-term and long-term movements.
Combination with other indicators. Moving averages are effective with tools such as Bollinger Bands or RSI.
Support and resistance levels. Averages help find areas of support or resistance.
Adaptation to changes. Regularly review the settings depending on market conditions.
Effectiveness of moving averages
The effectiveness of moving averages depends on their type and duration. Recent studies have shown the following results:
EMAs outperform SMAs. Exponential moving averages (EMAs) are more responsive to changes because they pay more attention to recent prices. This makes them a preferred choice for traders.
EMA crossovers are the most profitable. An analysis of 300 years of data on 16 global indices showed that crossovers of 13-day and 48.5-day EMAs yield the highest profits.
Traditional SMAs are less effective. Although 50-day and 200-day SMAs are widely used, short-term EMAs often prove more profitable for trading.
Pros and cons of using moving average
- Pros
- Cons
Trend detection. Helps to assess the direction of the market based on the position of the price relative to the average.
Entry and exit points. Serve as an indicator for opening and closing positions.
Support and resistance levels. Serve as benchmarks for analysis.
Data smoothing. Removes noise, making market trends more visible.
False signals. In volatile and sideways markets, moving averages often lead to erroneous trades.
Limited applicability. Works better in trending markets and requires confirmation by other indicators.
Not universal. Does not suit all trading styles and requires adjustment to specific strategies.
Tailoring the choice of moving averages can be a game-changer

For beginners looking to utilize moving average crossover strategies, it’s important to understand that not all crossovers are created equal. Tailoring the choice of moving averages to suit different market environments can be a game-changer. For fast-moving, volatile markets, using shorter periods like the 5-EMA and 20-EMA can offer quicker indications of potential trends, allowing traders to react to sudden market movements more efficiently.
This setup can help capture short-term gains but requires careful monitoring to avoid false signals. For markets with more stable or predictable trends, a crossover between the 13-EMA and 50-SMA can strike a good balance, offering reliable signals while reducing the noise that shorter EMAs might present.
Beyond just choosing the right moving averages, integrating volume analysis is crucial to enhance the reliability of crossover signals. A crossover that aligns with a spike in trading volume is a stronger indicator of trend momentum. For example, if a bullish crossover is paired with noticeable volume growth, it indicates that traders are actively participating and supporting the move, making it more trustworthy.
On the contrary, if the crossover happens with low volume, it could mean a weak trend that may not hold. To add another layer of security, using trailing stop-loss orders when entering positions based on these strategies can help secure profits and manage risks, particularly in choppy market conditions.
Conclusion
Moving averages remain a versatile tool that helps traders analyze trends, find entry and exit points, and make informed decisions. However, their effectiveness directly depends on the correct setting of periods and the selection of the appropriate type of moving average for a particular strategy.
Using several averages and combining them with other indicators allows you to minimize errors and increase the accuracy of signals. For successful use, it is important for a trader to regularly review the parameters depending on market conditions. Moving averages are not a universal answer to all market questions, but their proper use significantly improves trading results.
FAQs
How to choose the optimal moving average period?
The optimal period depends on the trading style. For short-term strategies, periods of 5-20 are often used, for medium-term ones - 20-50, and for long-term ones - 100-200. To test the appropriate period, use historical data on the selected charts.
Can moving averages be used in volatile markets?
Yes, but it is worth using exponential moving averages (EMA), as they react faster to sharp price changes. Additionally, it is recommended to combine them with other indicators to filter out false signals.
How to identify a false signal when using moving averages?
A false signal often occurs during periods of a sideways trend. To check, it is worth analyzing the coincidence of moving average signals with support and resistance levels or using oscillators such as RSI.
Is the moving average strategy suitable for beginner traders?
Yes, moving averages are easy to use. For beginners, it is recommended to start with a simple moving average (SMA) and test it on long-period charts to understand the dynamics of trends.
Related Articles
Team that worked on the article
Maxim Nechiporenko has been a contributor to Traders Union since 2023. He started his professional career in the media in 2006. He has expertise in finance and investment, and his field of interest covers all aspects of geoeconomics. Maxim provides up-to-date information on trading, cryptocurrencies and other financial instruments. He regularly updates his knowledge to keep abreast of the latest innovations and trends in the market.
Chinmay Soni is a financial analyst with more than 5 years of experience in working with stocks, Forex, derivatives, and other assets. As a founder of a boutique research firm and an active researcher, he covers various industries and fields, providing insights backed by statistical data. He is also an educator in the field of finance and technology.
As an author for Traders Union, he contributes his deep analytical insights on various topics, taking into account various aspects.
Mirjan Hipolito is a journalist and news editor at Traders Union. She is an expert crypto writer with five years of experience in the financial markets. Her specialties are daily market news, price predictions, and Initial Coin Offerings (ICO).
Day trading involves buying and selling financial assets within the same trading day, with the goal of profiting from short-term price fluctuations, and positions are typically not held overnight.
Yield refers to the earnings or income derived from an investment. It mirrors the returns generated by owning assets such as stocks, bonds, or other financial instruments.
Forex indicators are tools used by traders to analyze market data, often based on technical and/or fundamental factors, to make informed trading decisions.
Cryptocurrency is a type of digital or virtual currency that relies on cryptography for security. Unlike traditional currencies issued by governments (fiat currencies), cryptocurrencies operate on decentralized networks, typically based on blockchain technology.
An ECN, or Electronic Communication Network, is a technology that connects traders directly to market participants, facilitating transparent and direct access to financial markets.

-
 Afghanistan
-
 Albania
-
 Algeria
-
 Argentina
-
 Armenia
-
 Australia
-
 Austria
-
 Azerbaijan
-
 Bahamas
-
 Bahrain
-
 Bangladesh
-
 Belgium
-
 Botswana
-
 Brazil
-
 Brunei
-
 Bulgaria
-
 Burma
Burma
-
 Cambodia
-
 Cameroon
-
 Canada
-
 Chile
Chile
-
 China
China
-
 Colombia
-
 Costa Rica
-
 Cote d'Ivoire
-
 Croatia
-
 Cyprus
-
 Czech Republic
-
 Denmark
-
 Dominican Republic
-
 Ecuador
-
 Egypt
Egypt
-
 Estonia
-
 Eswatini
-
 Ethiopia
-
 Finland
-
 France
-
 Georgia
-
 Germany
-
 Ghana
Ghana
-
 Greece
-
 Haiti
Haiti
-
 Hong Kong
-
 Hungary
-
 India
India
-
 Indonesia
-
 Iran, Islamic republic
-
 Iraq
Iraq
-
 Ireland
-
 Israel
-
 Italy
Italy
-
 Jamaica
-
 Japan
Japan
-
 Jordan
-
 Kazakhstan
-
 Kenya
Kenya
-
 Korea
Korea
-
 Kuwait
-
 Kyrgyzstan
-
 Laos
Laos
-
 Latvia
-
 Lebanon
-
 Libyan Arab Jamahiriya
-
 Lithuania
-
 Luxembourg
-
 Macedonia
-
 Madagascar
-
 Malaysia
-
 Malta
Malta
-
 Mauritius
-
 Mexico
-
 Moldova
-
 Mongolia
-
 Montenegro
-
 Morocco
-
 Mozambique
-
 Namibia
-
 Nepal
Nepal
-
 Netherlands
-
 Nigeria
-
 Norway
-
 Oman
Oman
-
 Pakistan
-
 Palestine
-
 Papua New Guinea
-
 Peru
Peru
-
 Philippines
-
 Poland
-
 Portugal
-
 Puerto Rico
-
 Qatar
Qatar
-
 Romania
-
 Rwanda
-
 Saudi Arabia
-
 Serbia
-
 Singapore
-
 Slovakia
-
 Slovenia
-
 Somalia
-
 South Africa
-
 Spain
Spain
-
 Sri Lanka
-
 Sweden
-
 Switzerland
-
 Syrian Arab Republic
-
 Taiwan
-
 Tajikistan
-
 Tanzania, United Republic Of
-
 Thailand
-
 Trinidad and Tobago
-
 Tunisia
-
 Turkey
-
 UAE
UAE
-
 Uganda
-
 Ukraine
-
 United Kingdom
-
United States
-
 Uzbekistan
-
 Venezuela
-
 Vietnam
-
 Yemen
Yemen
-
 Zambia
-
 Zimbabwe
- Forex
- Crypto

