What Is Boom And Crash Trading?


Editorial Note: While we adhere to strict Editorial Integrity, this post may contain references to products from our partners. Here's an explanation for How We Make Money. None of the data and information on this webpage constitutes investment advice according to our Disclaimer.
Boom and Crash in trading can be used in 2 cases:
- A trading pattern that consists of a sharp rise in price (Boom) followed by a fall (Crash)
- Boom and Crash indices - synthetic financial instruments offered by some brokers
A boom and crash in trading refers to a sharp rise in the price of a financial asset, called a “boom”, and its subsequent steep fall, or “crash”. In this article, Traders Union looks at what a boom and crash trade is, explains what the boom and crash index is, breaks down what influences boom and crash in trading, and then provides some tips for trading boom and crash.
What is a boom and crash trade?
A boom in trading is a sudden spike in an asset’s price. Traders can trade a boom by entering a trade as the price is moving upwards, trying to enter before the trend suddenly reverses and the price drops downward. When the boom, or spike, ends, then the fall begins, which is referred to as the “crash”. If you’ve ever heard the expression “what goes up, must come down”, think of a boom and crash like that. When there is a sudden boom, traders anticipate the crash. To successfully trade a boom and crash, traders aim to enter before the boom ends, and sell before the crash begins.
In the chart below, we can see a boom and crash scenario. The ideal time for a trader to enter a trade here would be when the price is at roughly 82.700. The boom ends at 84.400, which would be an optimal time for the trader to sell, before the crash begins. As you can see, the boom and crash take place over an incredibly short period of time.
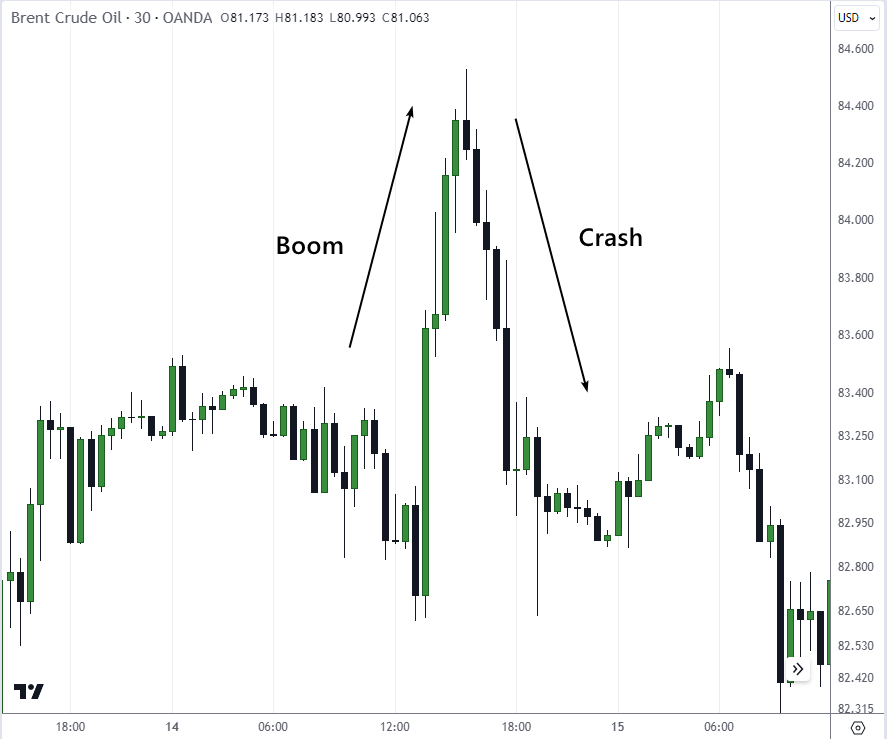 Example of the Boom and Crash pattern
The Boom and Crash pattern is essentially the same as the Pump and Dump pattern used among crypto traders
Best Forex brokers
The best brokers for boom and crash trading are those whose trading conditions are suitable for fast trading like scalping through low spreads and commissions, high leverage if needed, and platforms that allow one-click trading and order execution for the ultra-fast reactions required to capitalize on short-lived volatility spikes.
| Plus500 | Pepperstone | OANDA | |
|---|---|---|---|
|
Min. deposit, $ |
100 | No | No |
|
Max. leverage |
1:300 | 1:500 | 1:200 |
|
Scalping |
Yes | Yes | Yes |
|
One click trading |
Yes | Yes | Yes |
|
Open account |
Open an account Your capital is at risk. |
Open an account Your capital is at risk.
|
Open an account Your capital is at risk. |
Where To Trade Boom and Crash?
Forex brokers that offer trading directly from TradingView charts are a great option for trading Boom and Crash. TradingView provides hundreds of useful indicators, including those designed to detect atypical price movements. Additionally, the platform features a couple of blogs that specialize in analyzing these unusual price movements. For your convenience, we have also compared such brokers based on additional useful criteria.
| Plus500 | Pepperstone | |
|---|---|---|
|
TradingView ingergation |
Yes | Yes |
|
Min. deposit, $ |
100 | No |
|
Supported currency pairs |
60 | 90 |
|
ECN Spread EUR/USD |
No | 0,1 |
|
ECN Spread GBP/USD |
No | 0,15 |
|
ECN Commission |
No | 3 |
|
Open account |
Open an account Your capital is at risk. |
Open an account Your capital is at risk.
|
What influences boom and crash in trading
There are a few key factors that can influence periods of boom and crash in markets and trading:
News and events. Major unexpected news announcements, political decisions, economic reports, or other events can abruptly shift market sentiment and trigger volatility.
Technical factors. Price levels like support/resistance breaks and trends changing direction are watched for signs of momentum shifts.
Sentiment shifts. As behavioral biases like fear and greed take over, rapid sentiment changes among traders/investors can amplify volatility for a time.
Liquidity issues. Thin trading conditions in low liquidity assets make them more prone to sharp swings as buy/sell orders can significantly move the market.
Macro trends. Shifts in broader economic trends, monetary policy changes, geopolitical risks, etc. can fuel volatility spikes sector-wide or across whole markets.
Social media. Increased influence of online chatter/hype has shown the ability to catalyze dramatic short-term rallies and sell-offs at times.
Options expiry. Quarterly option expiry dates tend to coincide with spikes in underlying asset volatility as positions are unwound.
Earnings releases. Company earnings that miss or beat expectations sharply have led to post-ER boom and crash cycles.
So in essence, any unexpected development that abruptly alters the prevailing risk sentiment or liquidity dynamics has the potential to spark a boom or crash-type move in a given trading period. Timing these influences is challenging.
Boom and crash trading tips
Buying the boom
Identify strong market conditions. Look for a strong market backdrop, such as a breakout from a consolidation zone or a sustained uptrend. Analyze technical indicators signaling strength, like increasing trading volumes or bullish chart patterns.
Risk management. Set clear entry and exit points to manage risks. Utilize stop-loss orders to protect against sudden reversals (the crash).
Confirm bullish signals. When entering a trade during the boom, validate your decision with multiple indicators, ensuring a convergence of signals supporting the upward trend. Consider any fundamental factors that contribute to a positive market sentiment.
Selling the crash
Identify weak market conditions. Look for signs of a weak market, such as a breakdown from key support levels or a sustained downtrend. Analyze technical indicators indicating weakness, like high trading volumes or bearish chart patterns.
Confirm bearish signals. Cross-verify any signals using multiple indicators, ensuring a consensus pointing to a downward trend. Consider any fundamental factors that might contribute to negative market sentiment.
Stay informed. Keep up to date with any news or economic events that might worsen market conditions. Be prepared for any sudden shifts in sentiment that could affect the trajectory of the crash.
What is the boom and crash index?
The "Boom and Crash" index typically refers to a set of volatility indices offered exclusively by online broker Deriv. The boom and crash indices are synthetic indices. These indices simulate market conditions, providing traders with the opportunity to speculate on price movements without trading actual financial instruments. They employ random number generators that use cryptographically secure computer software. Traders and brokers have no way of predicting the numbers, ensuring transparency.
Traders can trade in the Boom and Crash synthetic index to gain exposure to the fluctuations of prices. These indices offer fast-paced trading, and are based on some of the most popular indices such as forex, commodities and crypto. They are incredibly volatile and can only be traded through the Deriv broker.
Expert Opinion

While boom and crash trading can seem like an exciting strategy with the potential for large profits, it is also extremely high risk. I would caution newcomers considering this approach.
Even with technical analysis, fundamentals research, and an understanding of market psychology, this remains an inexact science. Prices do not always behave as charts or indicators suggest, and geopolitical or macroeconomic surprises can trigger sharp reversals at any time.
For a retail trader just starting out, the risk of ruin from a mistimed or premature trade is simply too great when attempting to catch booms and crashes. The psychological pressure of high-volatility trading can also exacerbate emotional decision-making that ends up hurting performance.
My advice would be to gain substantial experience with less risky strategies first, using demo accounts to practice comprehensive risk management techniques. Focus on understanding long-term trends and order flow rather than chasing short-term volatility. Once consistently profitable over various market conditions, a trader could then consider allocating a small portion of their portfolio to boom and crash opportunities.
Conclusion
Boom and crash trading involves traders attempting to buy into a position when an asset is experiencing a spike in price, or a “boom”, then selling the position before the price starts to fall, or when the “crash” begins.
FAQs
What does a boom crash mean?
Boom and crash refers to a sudden spike and then fall in price movements of any given asset. It is also the name of a set of synthetic indices offered by broker Deriv.
Which indicator is best for boom and crash?
No indicator can predict the beginning of a boom and the beginning of a crash. Whichever indicator you use, each of them will show extreme changes in readings, which indicates the emergence of strong momentum.
How do you catch a boom and crash?
The use of scalping strategies after the publication of important news that lead to the formation of impulsive price movements can be considered one of the reasonable ways to “catch booms and crashes”.
Should I trade Boom and Crash?
It is not recommended for beginner traders to trade Boom and Crash. Although the indices can be quite lucrative for some, price movements are incredibly volatile and can cause a trader to quickly lose all of their money. Additionally, a random number generator dictates where prices will go next, meaning that trading Boom and Crash does not involve the same level of expertise that comes with being a seasoned trader and learning to understand the market.
Related Articles
Team that worked on the article
Jason Law is a freelance writer and journalist and a Traders Union website contributor. While his main areas of expertise are currently finance and investing, he’s also a generalist writer covering news, current events, and travel.
Jason’s experience includes being an editor for South24 News and writing for the Vietnam Times newspaper. He is also an avid investor and an active stock and cryptocurrency trader with several years of experience.
Dr. BJ Johnson is a PhD in English Language and an editor with over 15 years of experience. He earned his degree in English Language in the U.S and the UK. In 2020, Dr. Johnson joined the Traders Union team. Since then, he has created over 100 exclusive articles and edited over 300 articles of other authors.
Mirjan Hipolito is a journalist and news editor at Traders Union. She is an expert crypto writer with five years of experience in the financial markets. Her specialties are daily market news, price predictions, and Initial Coin Offerings (ICO).
Options trading is a financial derivative strategy that involves the buying and selling of options contracts, which give traders the right (but not the obligation) to buy or sell an underlying asset at a specified price, known as the strike price, before or on a predetermined expiration date. There are two main types of options: call options, which allow the holder to buy the underlying asset, and put options, which allow the holder to sell the underlying asset.
A boom and crash in trading refers to a sharp rise in the price of a financial asset, called a “boom”, and its subsequent steep fall, or “crash”.
Cryptocurrency is a type of digital or virtual currency that relies on cryptography for security. Unlike traditional currencies issued by governments (fiat currencies), cryptocurrencies operate on decentralized networks, typically based on blockchain technology.
Pump and dump" is a fraudulent scheme commonly seen in financial markets, especially in the context of stocks or cryptocurrencies. In a pump and dump scheme, manipulative individuals or groups artificially inflate the price of an asset, often through spreading false or misleading information to attract unsuspecting investors.
Forex indicators are tools used by traders to analyze market data, often based on technical and/or fundamental factors, to make informed trading decisions.

-
 Afghanistan
-
 Albania
-
 Algeria
-
 Argentina
-
 Armenia
-
 Australia
-
 Austria
-
 Azerbaijan
-
 Bahamas
-
 Bahrain
-
 Bangladesh
-
 Belgium
-
 Botswana
-
 Brazil
-
 Brunei
-
 Bulgaria
-
 Burma
Burma
-
 Cambodia
-
 Cameroon
-
 Canada
-
 Chile
Chile
-
 China
China
-
 Colombia
-
 Costa Rica
-
 Cote d'Ivoire
-
 Croatia
-
 Cyprus
-
 Czech Republic
-
 Denmark
-
 Dominican Republic
-
 Ecuador
-
 Egypt
Egypt
-
 Estonia
-
 Eswatini
-
 Ethiopia
-
 Finland
-
 France
-
 Georgia
-
 Germany
-
 Ghana
Ghana
-
 Greece
-
 Haiti
Haiti
-
 Hong Kong
-
 Hungary
-
 India
India
-
 Indonesia
-
 Iran, Islamic republic
-
 Iraq
Iraq
-
 Ireland
-
 Israel
-
 Italy
Italy
-
 Jamaica
-
 Japan
Japan
-
 Jordan
-
 Kazakhstan
-
 Kenya
Kenya
-
 Korea
Korea
-
 Kuwait
-
 Kyrgyzstan
-
 Laos
Laos
-
 Latvia
-
 Lebanon
-
 Libyan Arab Jamahiriya
-
 Lithuania
-
 Luxembourg
-
 Macedonia
-
 Madagascar
-
 Malaysia
-
 Malta
Malta
-
 Mauritius
-
 Mexico
-
 Moldova
-
 Mongolia
-
 Montenegro
-
 Morocco
-
 Mozambique
-
 Namibia
-
 Nepal
Nepal
-
 Netherlands
-
 Nigeria
-
 Norway
-
 Oman
Oman
-
 Pakistan
-
 Palestine
-
 Papua New Guinea
-
 Peru
Peru
-
 Philippines
-
 Poland
-
 Portugal
-
 Puerto Rico
-
 Qatar
Qatar
-
 Romania
-
 Rwanda
-
 Saudi Arabia
-
 Serbia
-
 Singapore
-
 Slovakia
-
 Slovenia
-
 Somalia
-
 South Africa
-
 Spain
Spain
-
 Sri Lanka
-
 Sweden
-
 Switzerland
-
 Syrian Arab Republic
-
 Taiwan
-
 Tajikistan
-
 Tanzania, United Republic Of
-
 Thailand
-
 Trinidad and Tobago
-
 Tunisia
-
 Turkey
-
 UAE
UAE
-
 Uganda
-
 Ukraine
-
 United Kingdom
-
United States
-
 Uzbekistan
-
 Venezuela
-
 Vietnam
-
 Yemen
Yemen
-
 Zambia
-
 Zimbabwe
- Forex
- Crypto
