Effective Strategies For Using Fibonacci Retracement


Editorial Note: While we adhere to strict Editorial Integrity, this post may contain references to products from our partners. Here's an explanation for How We Make Money. None of the data and information on this webpage constitutes investment advice according to our Disclaimer.
Replenish your trading arsenal with effective Fibonacci retracement strategies: Golden Ratio methods allow you to gain a competitive advantage, can predict price movements, and will help you confidently make informed trading decisions in any market.
Fibonacci Retracement is:
- Qualitative market analysis: helps you to see trend initiation and key price levels.
- Reliability and efficiency: positive statistics of market entry points over several decades.
- Versatility of Application: the method can be applied in different market conditions, timeframes, assets.
- Combination with other tools: maximum efficiency in combination with volume indicators and oscillators.
The purpose of Fibonacci retracement in trading is its ability to predict future strong price levels. By applying these levels to a live chart, traders can identify areas where price may retrace (retracement) or pause before finally reversing or continuing in the original trend direction. This time-tested method is especially useful in today's volatile markets and should definitely be in the arsenal of a successful trader.
What is a Fibonacci Retracement?
What we now call Fibo levels is based on the properties of a sequence of numbers described by the famous Italian Leonardo Fibocacci. A series of numbers, in which each number is the sum of two previous numbers (0, 1, 1, 2, 3, 5, 8, 13, ...), works perfectly well both in living nature and in various fields of human activity.
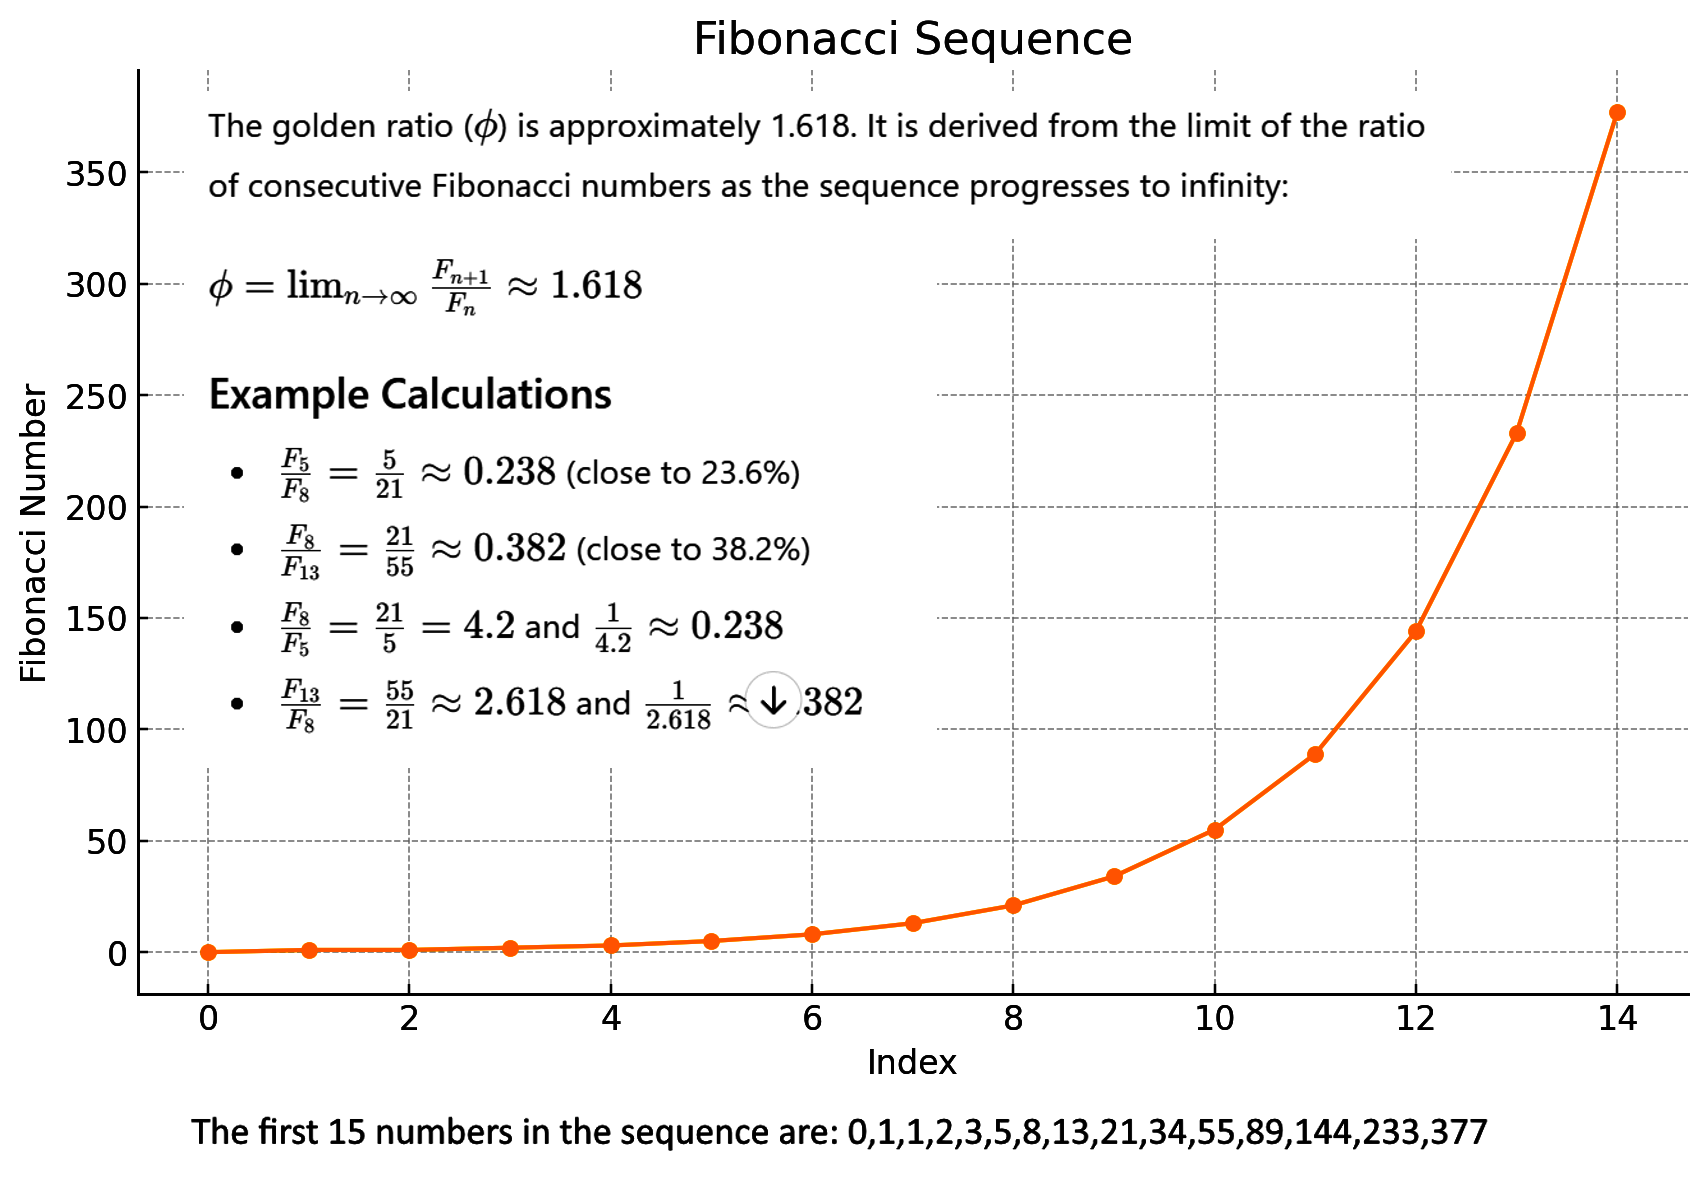 Calculating Fibonacci levels
In trading, the 23.6%, 38.2%, 50%, 61.8% and 78.6% Fibonacci levels represent potential support/resistance zones where price can take a strong impulse to reverse or continue trending after a short-term consolidation.
Fibonacci logic corresponds to the market "crowd psychology", which enhances the reliability of such signals. The price movement according to the calculated levels is called Fibonacci retracements.
How to draw Fibonacci Retracement level
Fibo technical tools are embedded in all trading platforms: let us remind you how to perform basic constructions in two popular terminals.
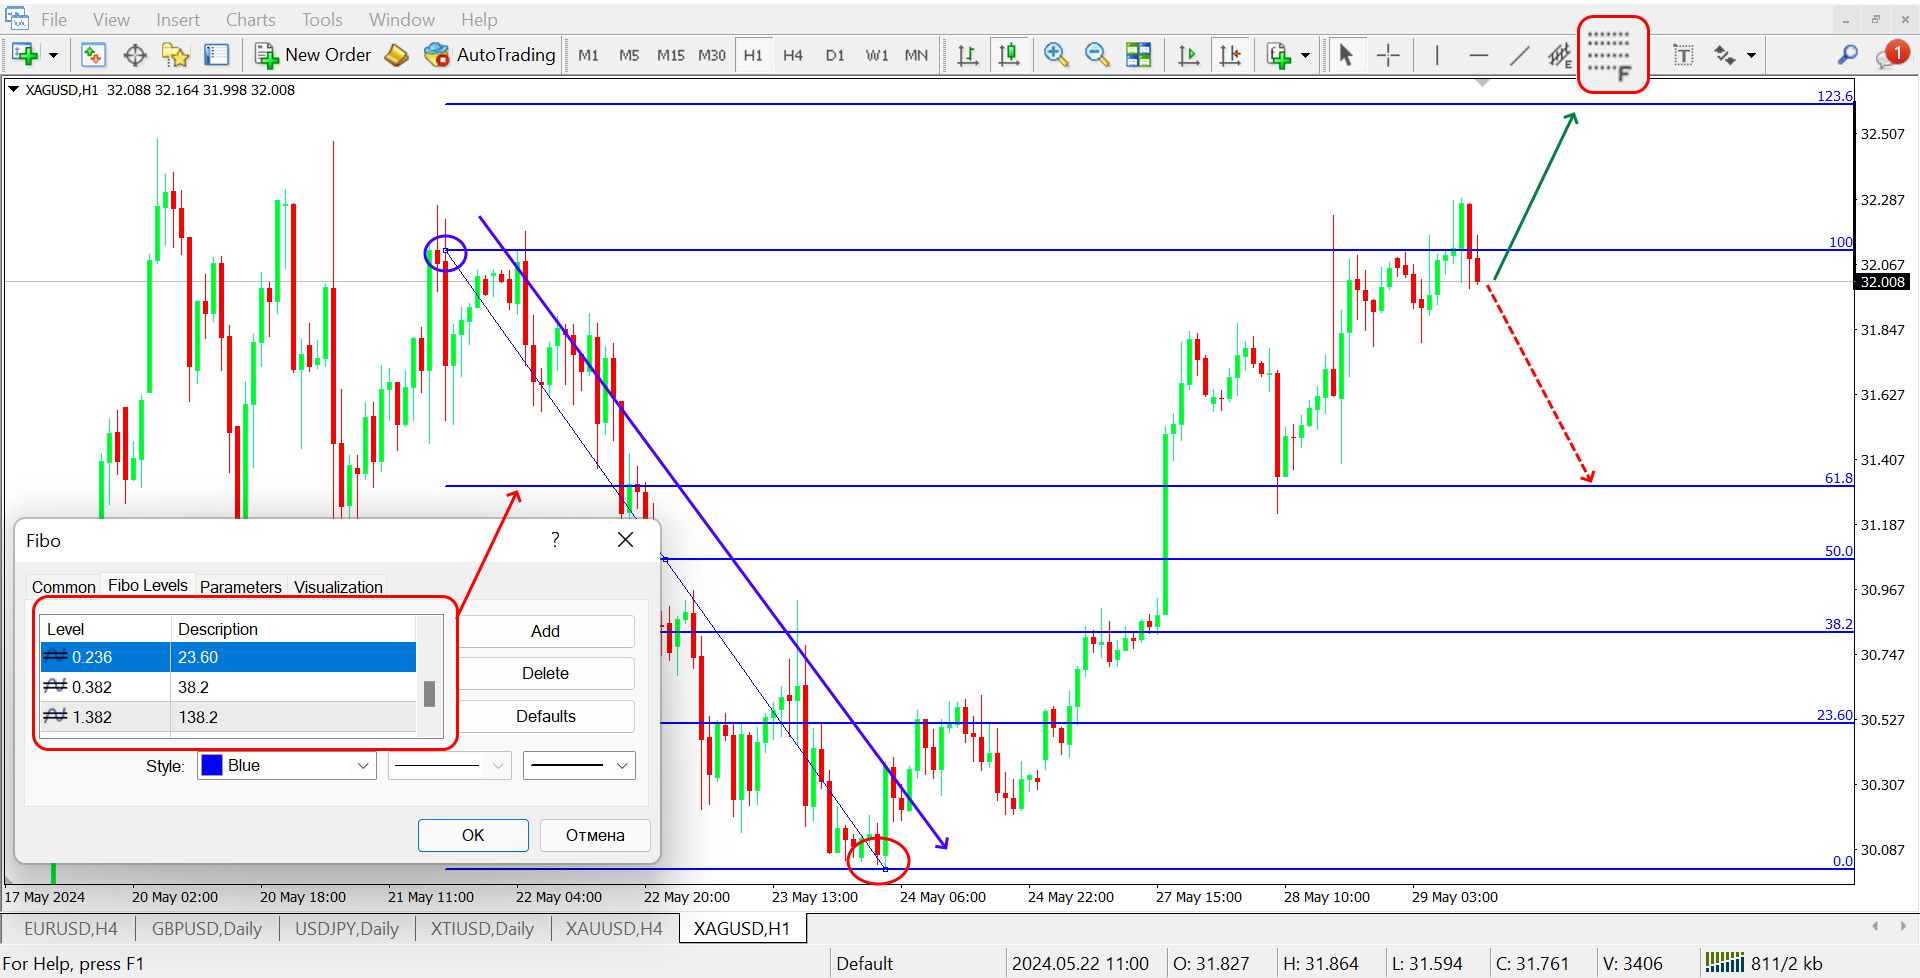 Fibo Levels in MetaTrader
Fibo for downtrend reversal in TradingView:
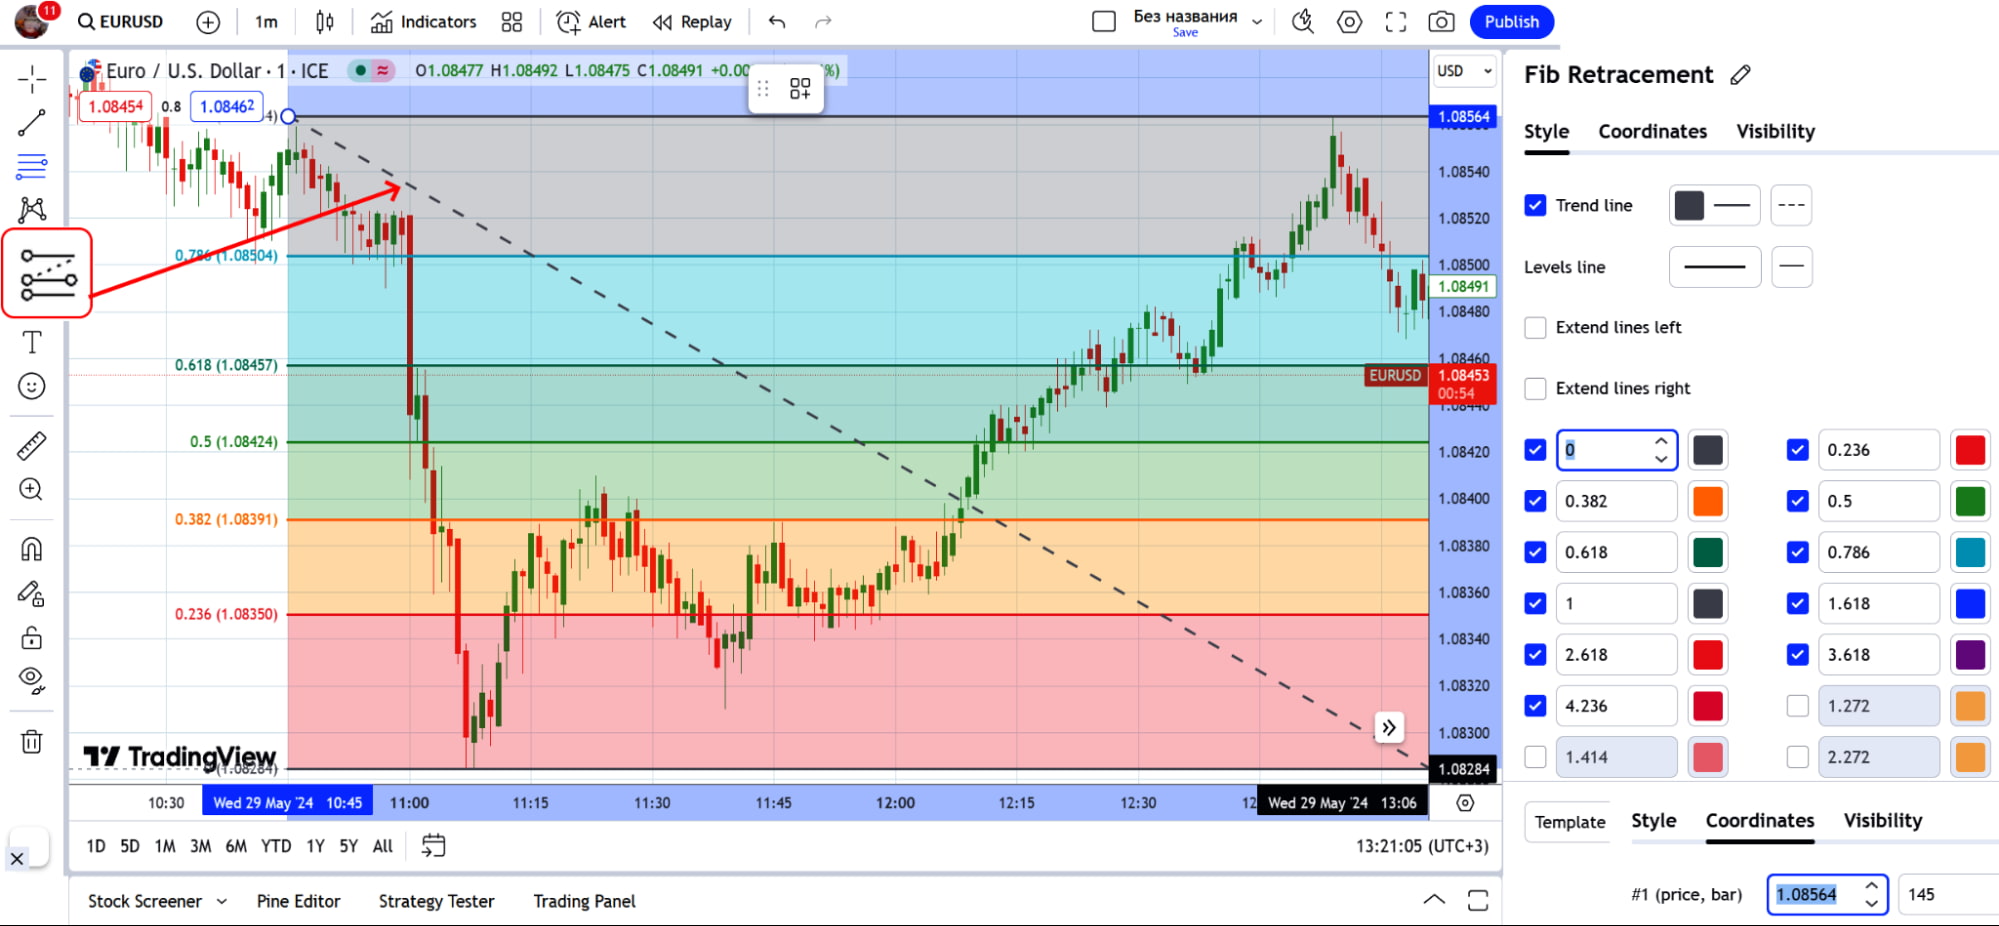 Fibo Levels in TradingView
Before using the Fibonacci retracement tool, it's crucial to identify the prevailing trend in the market. Whether the market is in an uptrend or downtrend determines how the tool will be applied and which levels will be of interest.
In an uptrend, Fibo levels are built from swing-low to swing-high and help to identify potential support levels, on a pullback from which the price will continue the bullish trend. If the levels break down and the price reverses, do not hurry to remove the built structure. On the new trend, the price continues to move along the same levels for some time, until the scheme is fully worked out.
 Fibonacci retracement levels on an uptrend
In a downtrend, Fibonacci Levels are used to identify potential resistance levels where the price may reverse to the downside. Traders build a chart of the instrument from the swing high to the swing low: we will either sell on the pullback from the correction level (23.6%, 38.2%) or buy if the trend reversal is confirmed.
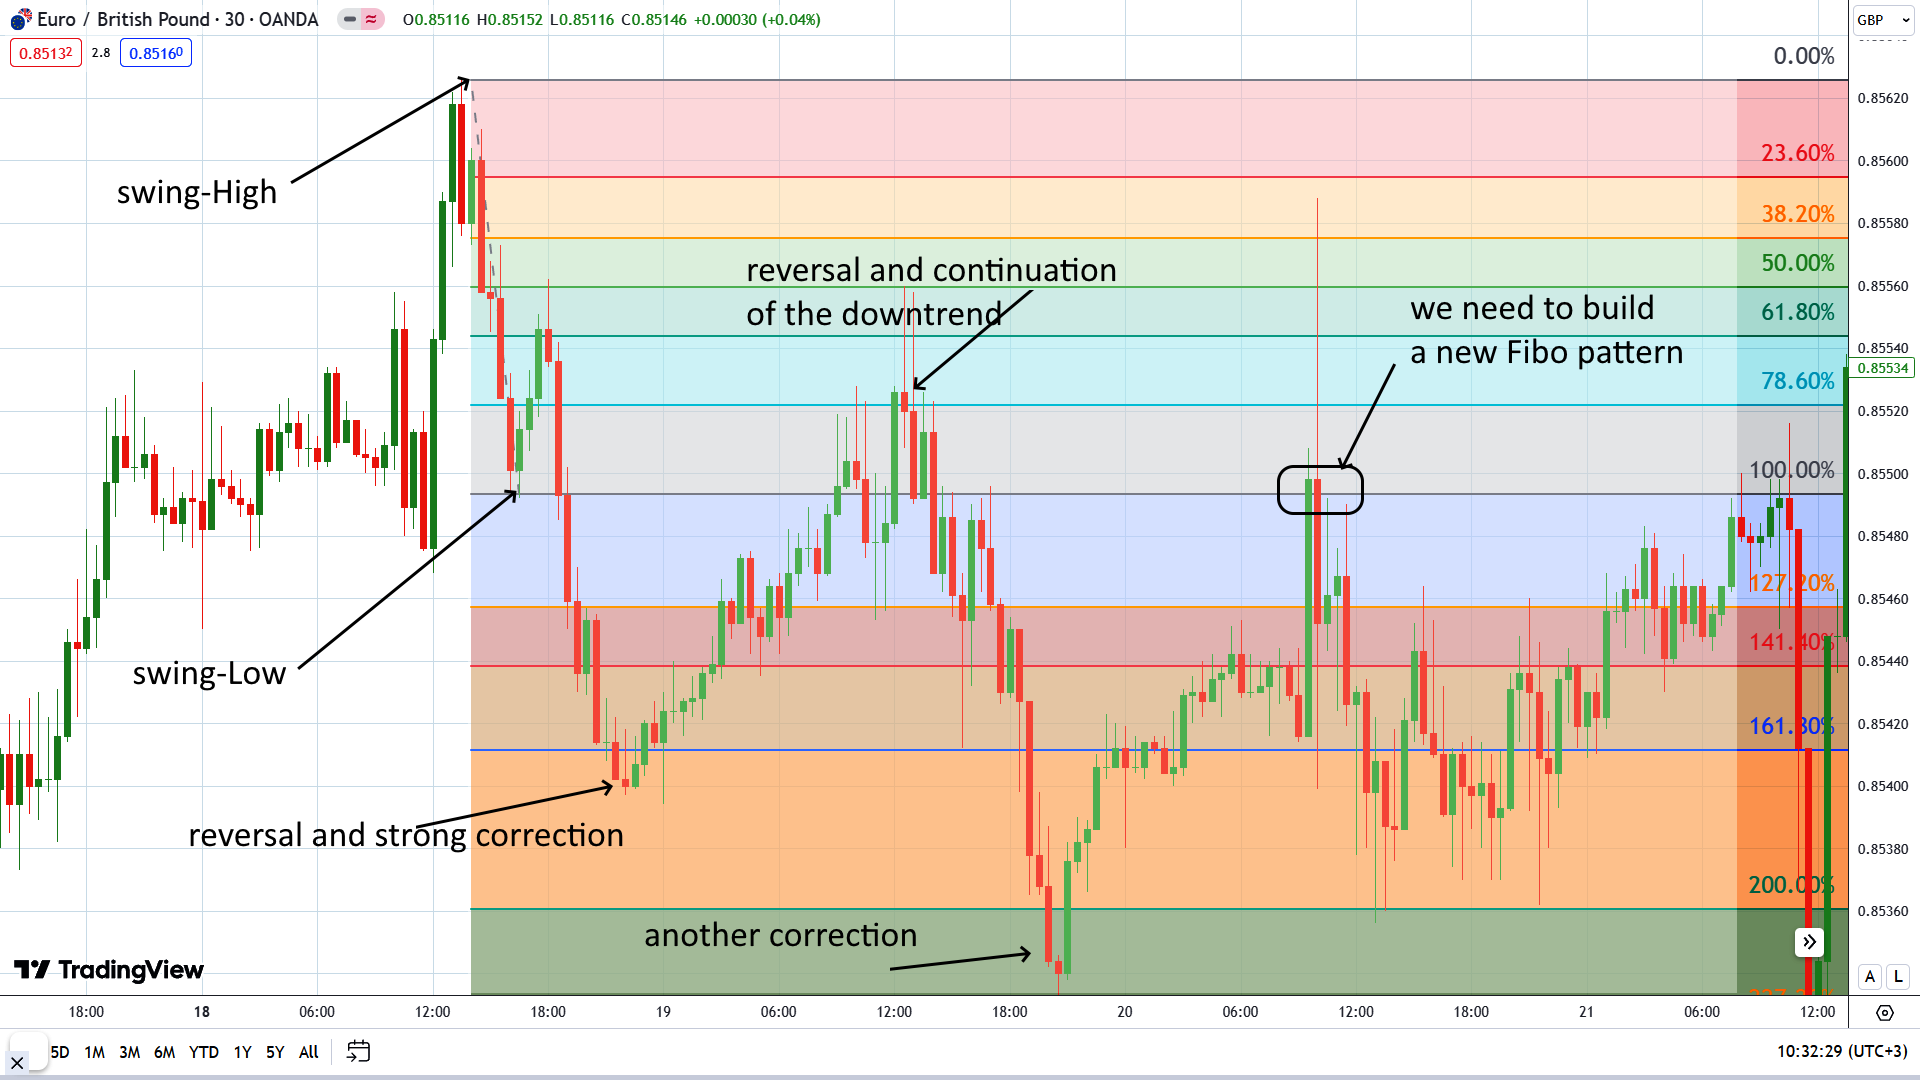 Fibonacci retracement on a downtrend
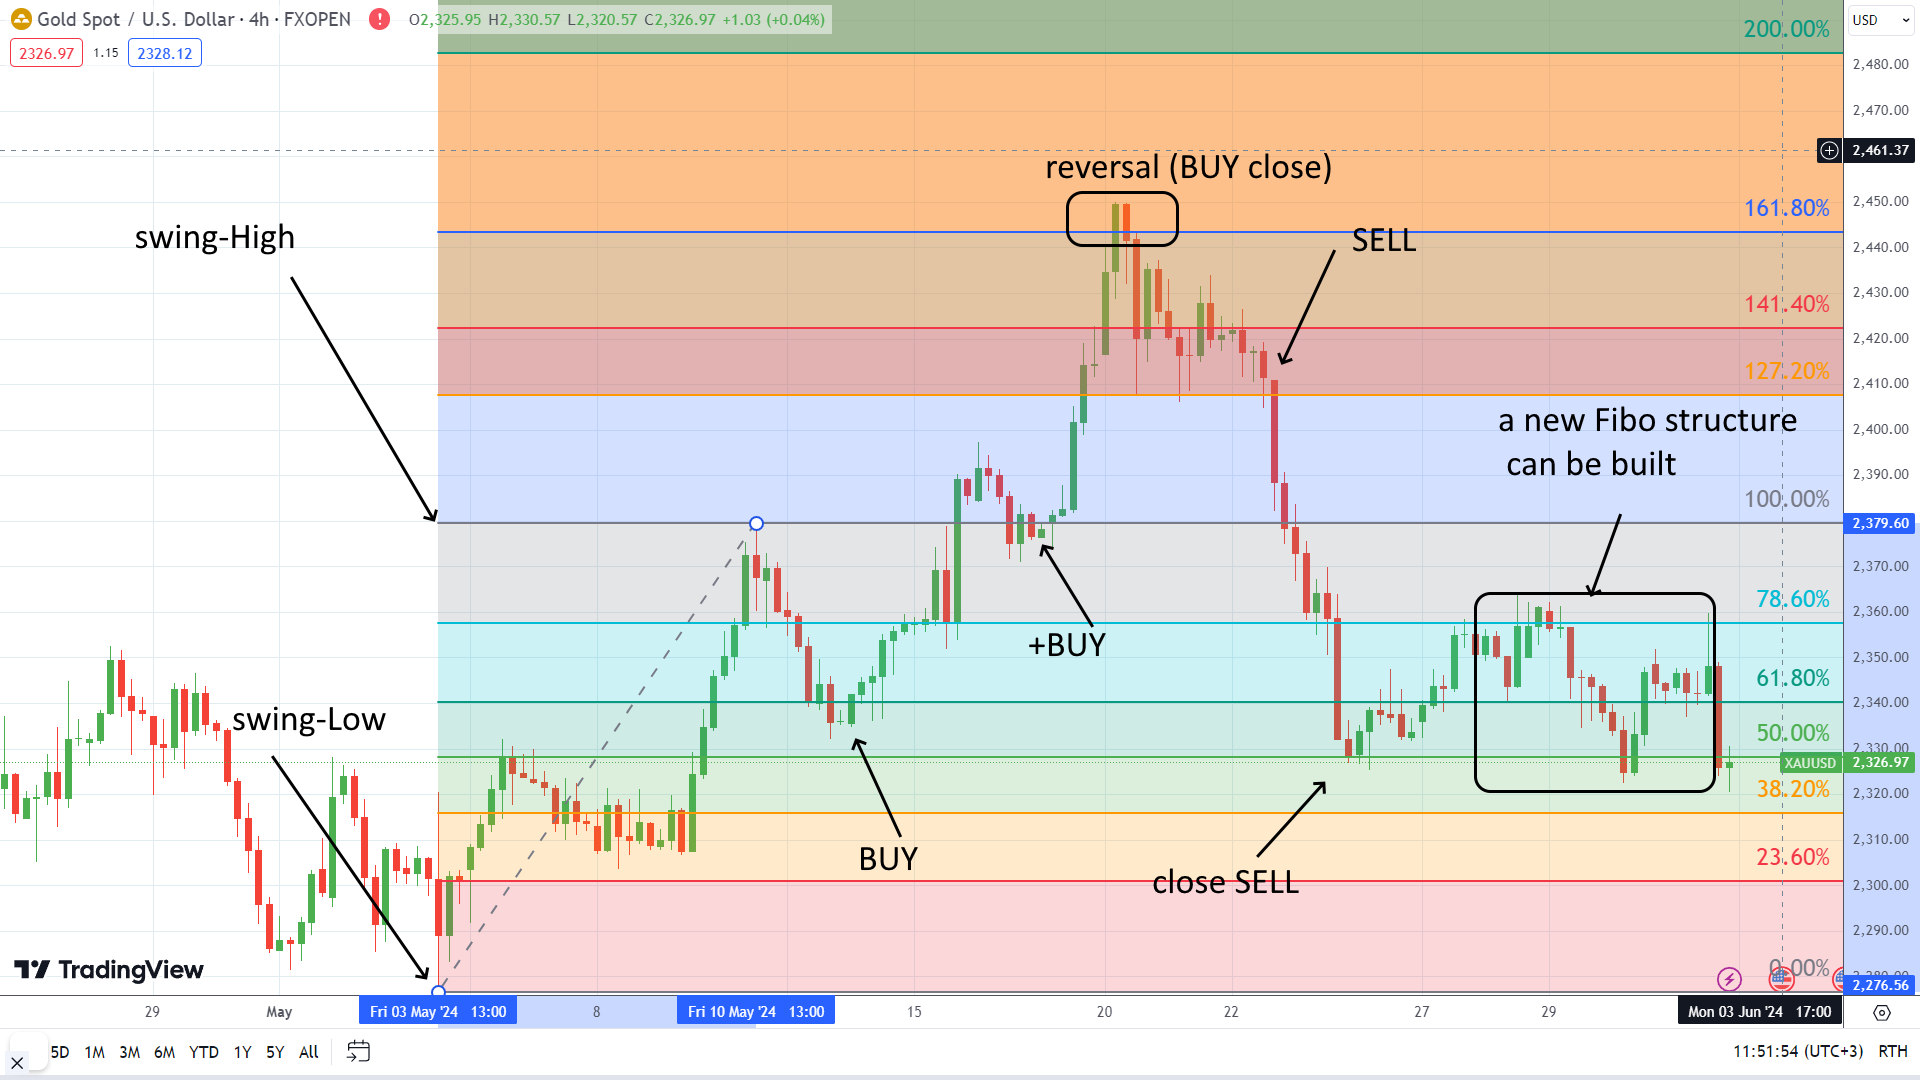
If during the movement the market updates one of the swing-high or swing-low points, it is recommended to correct the already built Fibo levels.
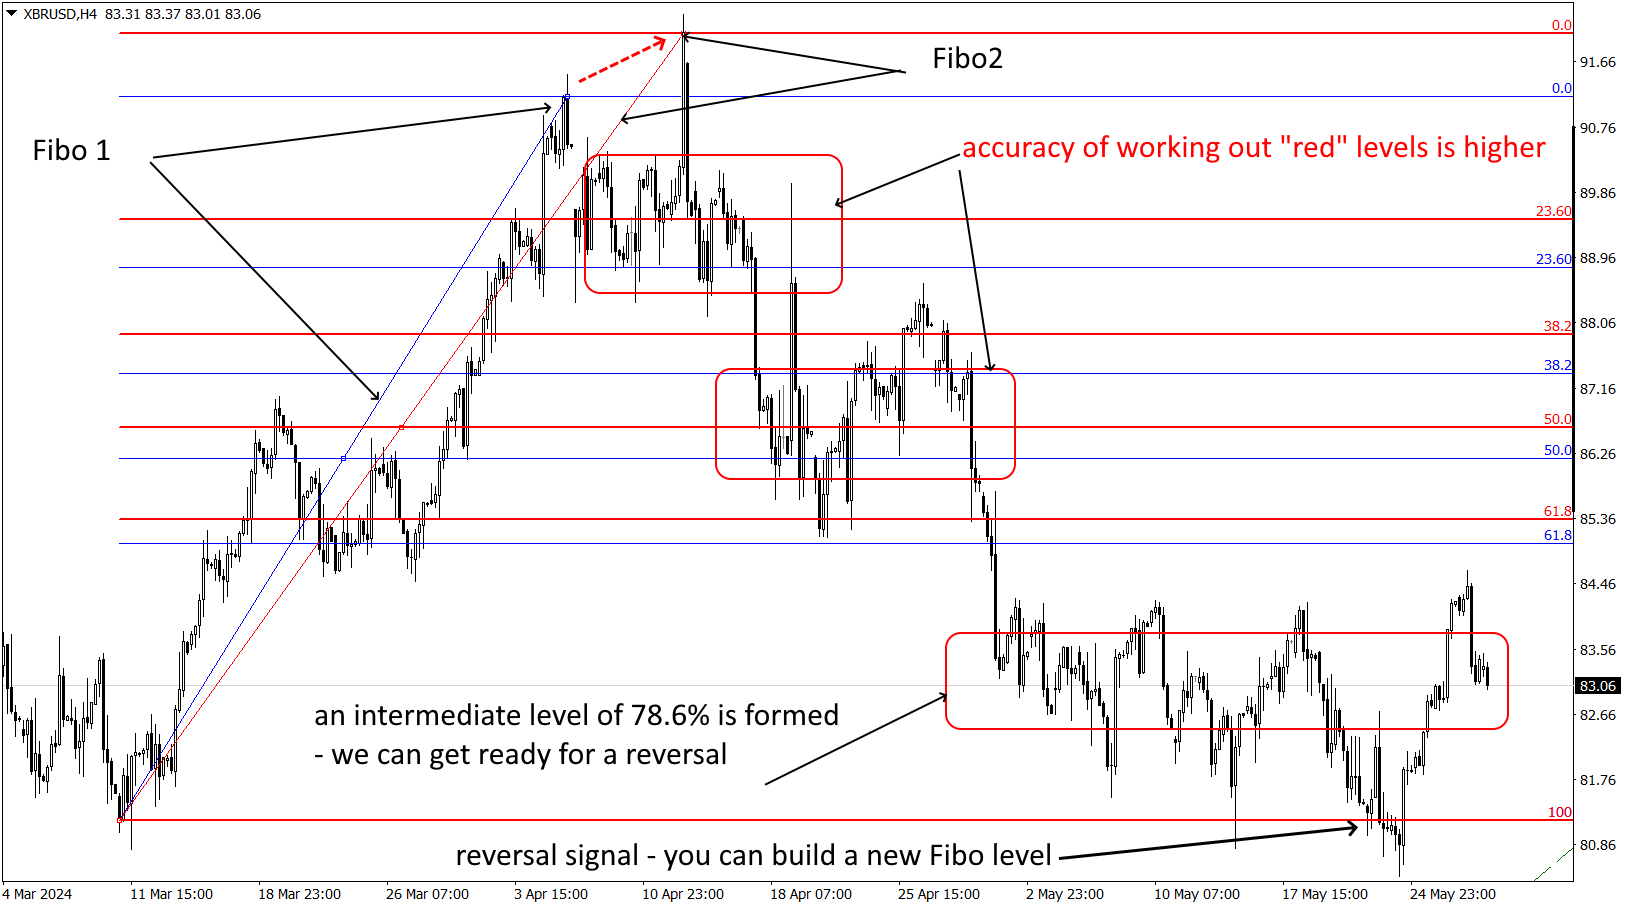 Fibo correction by new key points
Accumulated trading statistics claim that using Fibonacci levels in the actual direction is more effective than against the trend. But we believe that the reversal signal in this structure turns out to be stronger.
Recall:
The result of your deals depends on the accuracy of building the levels.
If you have doubts about the built levels, go to the senior timeframe and build another Fibo grid. If the medium-term trend is stable, the key levels of both grids fall into approximately the same price zones.
The reverse scheme also works: if the trend is really going to reverse, the reversal signal will be both on the smaller and on the older timeframe.
Which Fibo levels are the most effective?
It is only possible to assess the value of each Fibonacci retracement level in the overall context of the market, but trading signals at certain levels are more reliable.
61.8% (0.618): "golden section", the strongest in the Fibo series. If the price reaches this level on the actual trend, the probability of reversal is very high. It is necessary (as a minimum1) to pull up StopLoss on open positions and prepare to enter the market in a new direction.
76.8% (0.768): an intermediate level, which is most often not included in the standard conditions of construction, but is always visible on the real market. At this level the volumes of positions for reversal start to accumulate (it can be seen on market and tick volume indicators). It is from here that you should start, if the reversal is confirmed at the level of 100%.
50% (0.5): an absolutely psychological level, although from the point of view of technical analysis it is rather weak and is not mentioned in the Fibonacci series at all. This is where the longest consolidation phase is usually located.
38.2% (0.382): It is used to evaluate the initial correction after the first strong impulse. A real reversal is unlikely, but if the correction continues beyond the 23.6% level, the entire current Fibonacci retracement pattern is canceled.
23,5% (0.236): It is used to identify small corrections and can serve as an early signal of a trend change.
 How to use Fibonacci Retracement
Combine with other technical indicators
Fibo levels do not give independent trading signals, but when combined with additional standard indicators, stable trading systems are obtained.
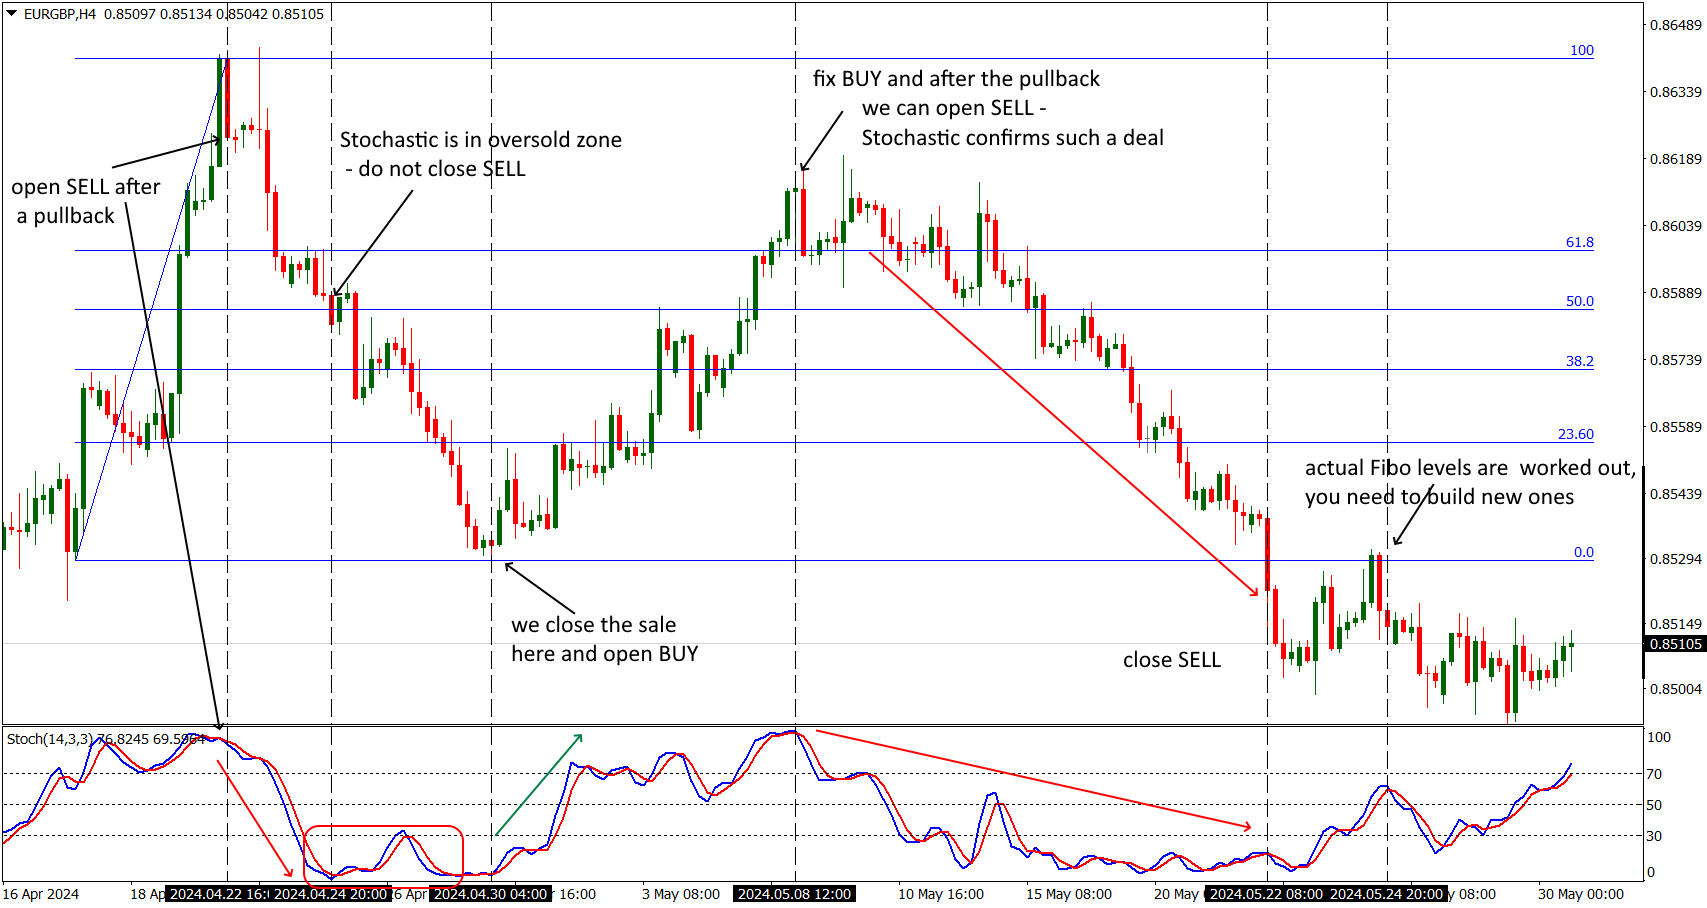 Strategy Fibo+Stochastic
In combination with MACD trend oscillator in the Fibonacci zone you can get leading signals.
 Strategy Fibo+MACD
Effective fibonacci retracement strategies are obtained in combination with market profile tools - in the situation in the example below it was possible to successfully work the trading day in both directions.
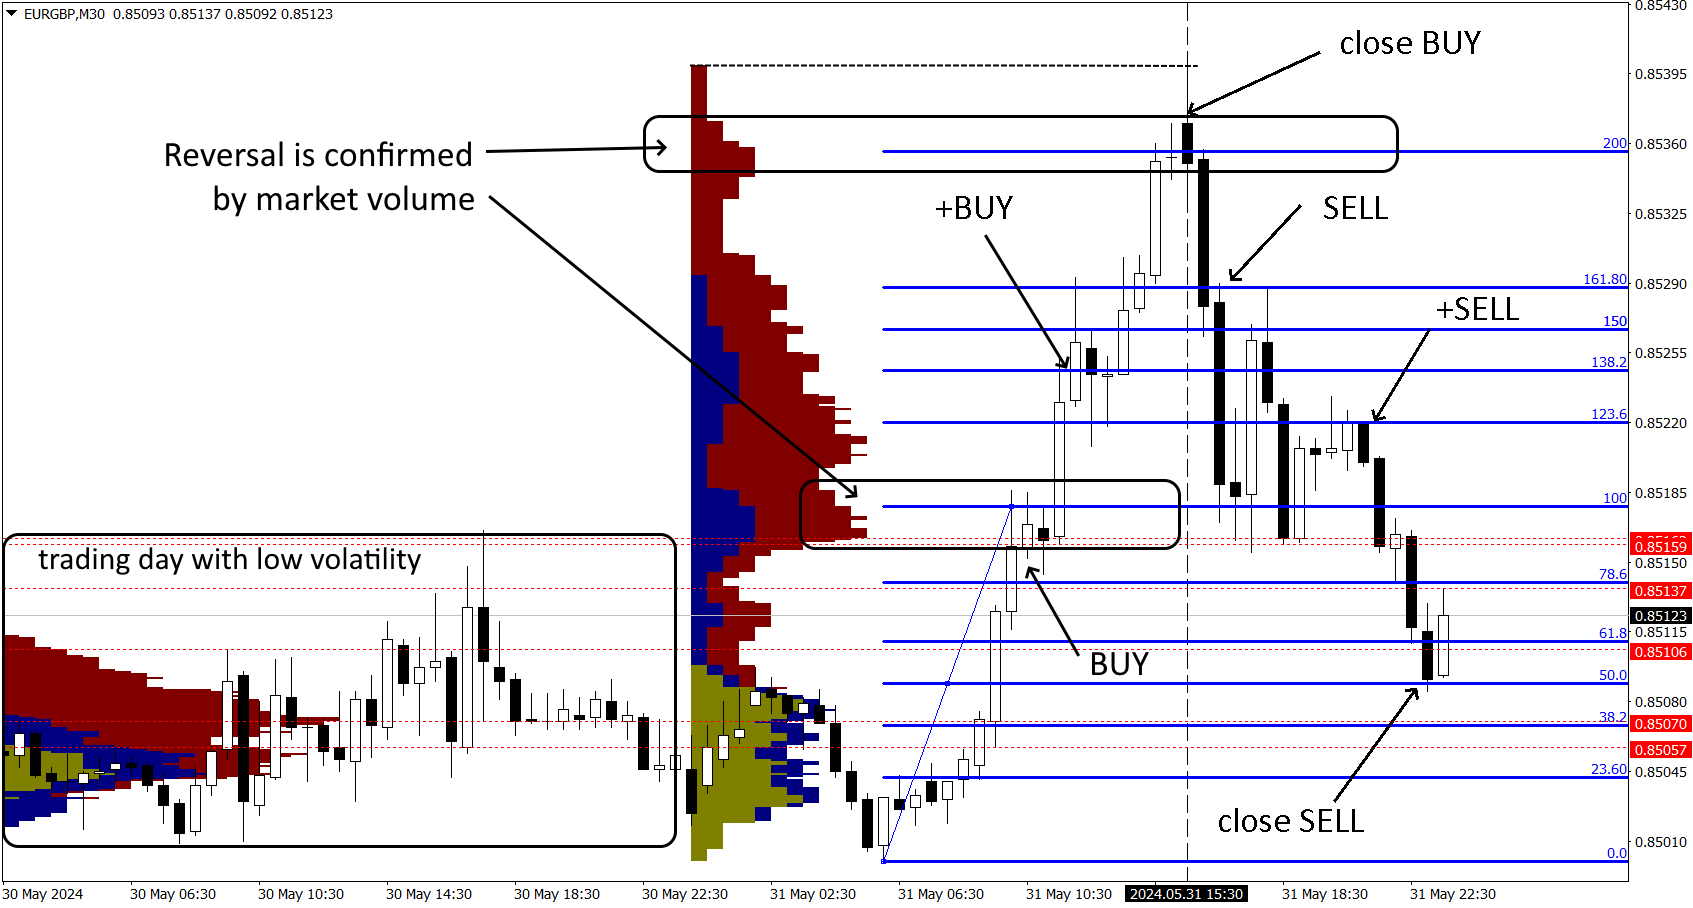 Strategy Fibo+VolumeProfile
Note: Charting of not only correction levels, but also all other Fibonacci figures (Arcs, Fans, Time Zones, Channels) can be perfectly handled by external technical tools such as Autochartist. External technical tools such as Autochartist are excellent - we recommend choosing brokers that allow using this service on a real chart.
How to improve the effectiveness of Fibonacci levels?
The accuracy of Fibo signals in real trading can (should!) be improved by applying several strategies and techniques:
Key price zones : Look for Fibonacci levels that coincide with support/resistance zones that have been identified by other methods.
Trend lines and channels : Look for Fibonacci levels that coincide with trend lines or channel boundaries.
Additional indicators : Use oscillators ( RSI, MACD, Stochastic etc) to confirm signals from Fibonacci levels.
Volume Analysis : Watch the trading volume at Fibonacci levels - increased activity confirms the importance of the level and the possibility of a reversal.
Level Confluence : Look for the coincidence of several Fibonacci levels from different timeframes or different waves of price movement. The more levels that match, the stronger the support or resistance level.
Chart patterns : Look for confirmation of Fibonacci levels using technical analysis patterns such as double bottoms, head and shoulders, flags, and pennants. A reversal signal additionally confirmed by a chart or candlestick pattern is almost 100% success.
Risk Management : Set stop losses and take profits based on Fibonacci levels and other key levels to limit losses and lock in profits. Calculate position size based on risk level and distance between Fibo levels.
Analyze price history : check how Fibonacci levels have worked in the past on the selected asset to correct your targets in time. Keep in mind that the actual Fibonacci price zone can be extended by 10-15 pips if several historical strong levels fall within this zone.
Please note: The Fibonacci retracement analyzes the price ex post-factum, using only mathematical methods. Dow Theory assumes that "price includes all”. So the Fibonacci price forecast should be combined with actual fundamental analysis.
Combining these methods will help you increase the accuracy and effectiveness of using Fibonacci levels in trading.
The result of using the Fibonacci correction strictly depends on the accuracy of its construction, i.e. on the reliability and technical capabilities of your main financial partner - broker. Slippage, loss of communication, "failure" in the flow of quotes, low speed of order processing and other problems affect the efficiency of your actions. Besides, serious trading platforms offer additional analytical tools, indicators, scripts and other resources that help traders make more informed decisions.
We have independently assessed the reliability and technical conditions and offer you to choose a convenient option from the top 5 best ones:
| Bybit | XM Group | RoboForex | Exness | VT Markets | |
|---|---|---|---|---|---|
|
Regulation |
VARA, AFSA, NBG, MiCAR | CySEC, FSC (Belize), DFSA, FSCA, FSA (Seychelles), FSC (Mauritius) | FSC | FCA, CySEC, FSA (Seychelles), FSCA, BVI FSC, CBCS, CMA | ASIC, FSCA, FSC Mauritius |
|
Min. deposit, $ |
No | 5 | 10 | 10 | 100 |
|
Max leverage, 1: |
Up to 1:500 | 1:30 (only for EU regulated Entity and AU). For all the other countries - 1:1000. | 1:2000 | 1:unlimited for retail clients (Terms and Conditions apply) | Up to 1:500 |
|
Min Spread EUR/USD, pips |
Not supported | 0,7 | 0,5 | 0,6 | 0,4 |
|
ECN |
Yes | Yes | Yes | Yes | Yes |
|
Scalping |
Yes | Yes | Yes | Yes | Yes |
|
Autochartist |
No | No | Yes | No | No |
|
Open account |
Open an account Your capital is at risk. |
Open an account Your capital is at risk. |
Open an account Your capital is at risk. |
Open an account Your capital is at risk.
|
Open an account Your capital is at risk. |
Benefits and challenges of Fibonacci levels
In almost 100 years of using Fibonacci levels, the market has accumulated a lot of statistics on the results, and here's what you get:
- Pros:
- Cons:
- Clear entry and exit points: Fibonacci retracement levels provide specific levels where traders can enter or exit trades, making decision-making more structured.
- Versatility: The Fibonacci method can be applied to any assets, markets, timeframes.
- Identification of key levels: Helps in identifying potential support and resistance levels where price reversals are likely to occur.
- Combines well with other indicators: It can be used alongside other technical indicators to confirm trading signals and improve accuracy.
- Requires confirmation of signals: The effectiveness of Fibonacci retracement relies heavily on correctly identifying swing highs and lows, which can be subjective.
- False signals in volatile markets: High volatility can lead to misleading signals, increasing the risk of losses.
- Historical basis: Relies on historical price movements, which may not always predict future behavior accurately.
- Requires experience: Effective use of Fibonacci retracement often requires significant experience and understanding of market dynamics.
Risks of using Fibonacci methods
Fibonacci retracement is a graphical method of analysis, so its main risk is considered to be errors in calculating key points.
If you have incorrectly identified the upper and/or lower swing bars, all the constructed levels become erroneous, and in these zones the market will choose a completely different scenario than you expect.
In addition, consider the following:
False signals in a volatile market;
Market Crowding.
Since Fibonacci levels and fibonacci retracement strategy are a popular tool among traders, they can become a self-fulfilling prophecy. This means that a large number of traders can open positions at the same level at the same time, which can lead to sudden and significant price swings.
Subjectivity of the starting and ending point for building levels
Ineffectiveness in trend conditions
Inaccuracy of signals in short-term trading due to “market noise”
Cancellation of signals at speculative volatility
Incorrect assessment of the fundamental background, such as news or other force majeure, will also cause an inadequate reaction at the Fibo levels.
This problem can only be solved by correcting chart constructions and confirming trading signals with additional indicators.
Expert option: Market logic is beyond competition

I prefer fundamental market assessment, but it is the Fibonacci retracement levels that have maintained my confidence in classical technical analysis for many years. I am sure that Fibonacci retracement zones are the best option for setting TakeProfit/StopLoss, if the key points for building them are chosen correctly. Fibonacci retracement levels provide specific levels where traders can enter or exit trades, making decision-making more structured.
The universality of the Fibonacci scheme , which does not depend on the timeframe and asset type, can be used to check the signals of any strategies.
So, if a strategy offers you a trading signal, especially for a trend reversal, don't be lazy - build Fibonacci levels on the nearest section of the trend , and if the current price falls into the key zone, you can safely open a position.
Conclusion
Fibonacci Retracement is a simple, universal, price history-tested technical analysis tool, its calculations are based not only on math, but also on market psychology. So the ability to use it effectively should be in every trader's asset. In any difficult situation, for example, when there is a lack of technical or fundamental information - build Fibo levels and the market will definitely work them out.
Profits to y’all!
FAQs
How to draw Fibonacci retracement levels?
To draw Fibonacci retracement levels, follow the steps below:
Identify the high and low points of the recent price movement (swing high and swing low).
Use the charting tool to draw a trend line from min to max in an uptrend or from max to min in a downtrend.
The Fibonacci retracement tool will automatically draw retracement levels on your chart based on the selected points.
Which Fibonacci levels are most important?
The most important Fibonacci retracement levels are 38.2%, 50%, and 61.8%. These levels are significant because they often correspond to areas where the price tends to reverse or consolidate. The 50% level, although not derived from the Fibonacci sequence, is considered a psychological level where prices tend to retrace half of their previous movement.
Can Fibonacci retracement be used in any time frame?
Yes, Fibonacci retracement can be used in any time frame, from short-term to long-term charts. However, the effectiveness of the levels can vary depending on the volatility and context of the market. It is often used in conjunction with other indicators to improve accuracy and reduce false signals.
Can the Fibonacci retracement be used for flat trading?
Yes, the Fibonacci retracement can be used in both trending and flat markets: in a strong trend, Fibonacci retracement levels estimate the probability of a pause or continuation, while in range trading they help to identify pivot points within the range. However, to increase accuracy and reliability, Fibonacci retracement should be used in combination with other technical indicators and fundamental analysis.
Related Articles
Team that worked on the article
Chinmay Soni is a financial analyst with more than 5 years of experience in working with stocks, Forex, derivatives, and other assets. As a founder of a boutique research firm and an active researcher, he covers various industries and fields, providing insights backed by statistical data. He is also an educator in the field of finance and technology.
As an author for Traders Union, he contributes his deep analytical insights on various topics, taking into account various aspects.
Dr. BJ Johnson is a PhD in English Language and an editor with over 15 years of experience. He earned his degree in English Language in the U.S and the UK. In 2020, Dr. Johnson joined the Traders Union team. Since then, he has created over 100 exclusive articles and edited over 300 articles of other authors.
Mirjan Hipolito is a journalist and news editor at Traders Union. She is an expert crypto writer with five years of experience in the financial markets. Her specialties are daily market news, price predictions, and Initial Coin Offerings (ICO).
Volatility refers to the degree of variation or fluctuation in the price or value of a financial asset, such as stocks, bonds, or cryptocurrencies, over a period of time. Higher volatility indicates that an asset's price is experiencing more significant and rapid price swings, while lower volatility suggests relatively stable and gradual price movements.
Forex indicators are tools used by traders to analyze market data, often based on technical and/or fundamental factors, to make informed trading decisions.
A trading system is a set of rules and algorithms that a trader uses to make trading decisions. It can be based on fundamental analysis, technical analysis, or a combination of both.
Day trading involves buying and selling financial assets within the same trading day, with the goal of profiting from short-term price fluctuations, and positions are typically not held overnight.
Cryptocurrency is a type of digital or virtual currency that relies on cryptography for security. Unlike traditional currencies issued by governments (fiat currencies), cryptocurrencies operate on decentralized networks, typically based on blockchain technology.
-
 Afghanistan
-
 Albania
-
 Algeria
-
 Argentina
-
 Armenia
-
 Australia
-
 Austria
-
 Azerbaijan
-
 Bahamas
-
 Bahrain
-
 Bangladesh
-
 Belgium
-
 Botswana
-
 Brazil
-
 Brunei
-
 Bulgaria
-
 Burma
Burma
-
 Cambodia
-
 Cameroon
-
 Canada
-
 Chile
Chile
-
 China
China
-
 Colombia
-
 Costa Rica
-
 Cote d'Ivoire
-
 Croatia
-
 Cyprus
-
 Czech Republic
-
 Denmark
-
 Dominican Republic
-
 Ecuador
-
 Egypt
Egypt
-
 Estonia
-
 Eswatini
-
 Ethiopia
-
 Finland
-
 France
-
 Georgia
-
 Germany
-
 Ghana
Ghana
-
 Greece
-
 Haiti
Haiti
-
 Hong Kong
-
 Hungary
-
 India
India
-
 Indonesia
-
 Iran, Islamic republic
-
 Iraq
Iraq
-
 Ireland
-
 Israel
-
 Italy
Italy
-
 Jamaica
-
 Japan
Japan
-
 Jordan
-
 Kazakhstan
-
 Kenya
Kenya
-
 Korea
Korea
-
 Kuwait
-
 Kyrgyzstan
-
 Laos
Laos
-
 Latvia
-
 Lebanon
-
 Libyan Arab Jamahiriya
-
 Lithuania
-
 Luxembourg
-
 Macedonia
-
 Madagascar
-
 Malaysia
-
 Malta
Malta
-
 Mauritius
-
 Mexico
-
 Moldova
-
 Mongolia
-
 Montenegro
-
 Morocco
-
 Mozambique
-
 Namibia
-
 Nepal
Nepal
-
 Netherlands
-
 Nigeria
-
 Norway
-
 Oman
Oman
-
 Pakistan
-
 Palestine
-
 Papua New Guinea
-
 Peru
Peru
-
 Philippines
-
 Poland
-
 Portugal
-
 Puerto Rico
-
 Qatar
Qatar
-
 Romania
-
 Rwanda
-
 Saudi Arabia
-
 Serbia
-
 Singapore
-
 Slovakia
-
 Slovenia
-
 Somalia
-
 South Africa
-
 Spain
Spain
-
 Sri Lanka
-
 Sweden
-
 Switzerland
-
 Syrian Arab Republic
-
 Taiwan
-
 Tajikistan
-
 Tanzania, United Republic Of
-
 Thailand
-
 Trinidad and Tobago
-
 Tunisia
-
 Turkey
-
 UAE
UAE
-
 Uganda
-
 Ukraine
-
 United Kingdom
-
 United States
-
 Uzbekistan
-
 Venezuela
-
 Vietnam
-
 Yemen
Yemen
-
 Zambia
-
 Zimbabwe
- Forex
- Crypto
