How To Identify A Trend?


Editorial Note: While we adhere to strict Editorial Integrity, this post may contain references to products from our partners. Here's an explanation for How We Make Money. None of the data and information on this webpage constitutes investment advice according to our Disclaimer.
To identify a trend, begin by analyzing price charts and looking for consistent movements in one direction, characterized by higher highs and higher lows for an uptrend, or lower highs and lower lows for a downtrend. Utilize technical indicators like Moving Averages, MACD, and RSI to confirm the trend and assess its strength. Combining these indicators with fundamental analysis and staying updated on economic news can enhance your trend identification skills and improve trading decisions.
A trend is the direction in which prices move in a market over a period of time. Understanding and being able to identify trends are key elements of successful trading. The purpose of this article is to provide a detailed guide to identifying trends for beginner traders, covering visual analysis, the use of technical indicators, and a combined approach to trend analysis.
How to identify a trend
A trend is the predominant direction of an asset's price movement in the market. There are three main types of trends:
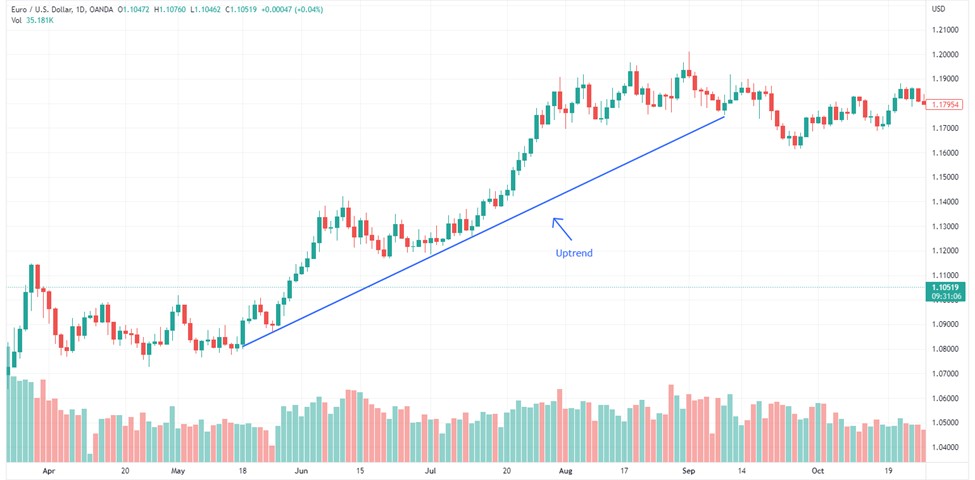
Uptrend — characterized by a sequence of higher highs and lows.
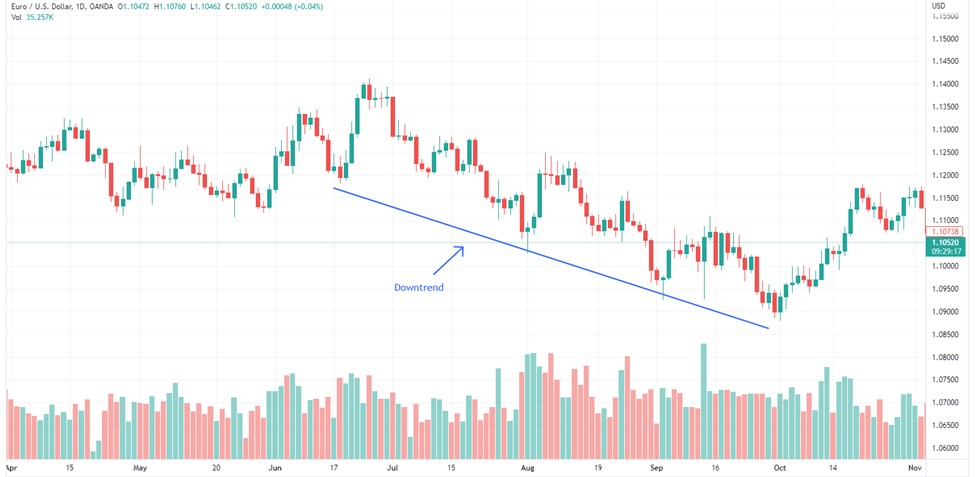
Downtrend — characterized by a sequence of lower highs and lows.
Sideways trend (flat) — the price moves in a narrow range without a clear direction.

The importance of trends in trading is that they help traders determine market movement and build their trading strategies based on this.
Visual analysis of trends
Visual trend analysis plays a fundamental role in determining the direction of the market. Using charts allows traders to easily recognize uptrends, downtrends, and sideways trends, as well as support and resistance levels. Let's look at the main visual analysis methods and provide examples of using charts to determine trends.
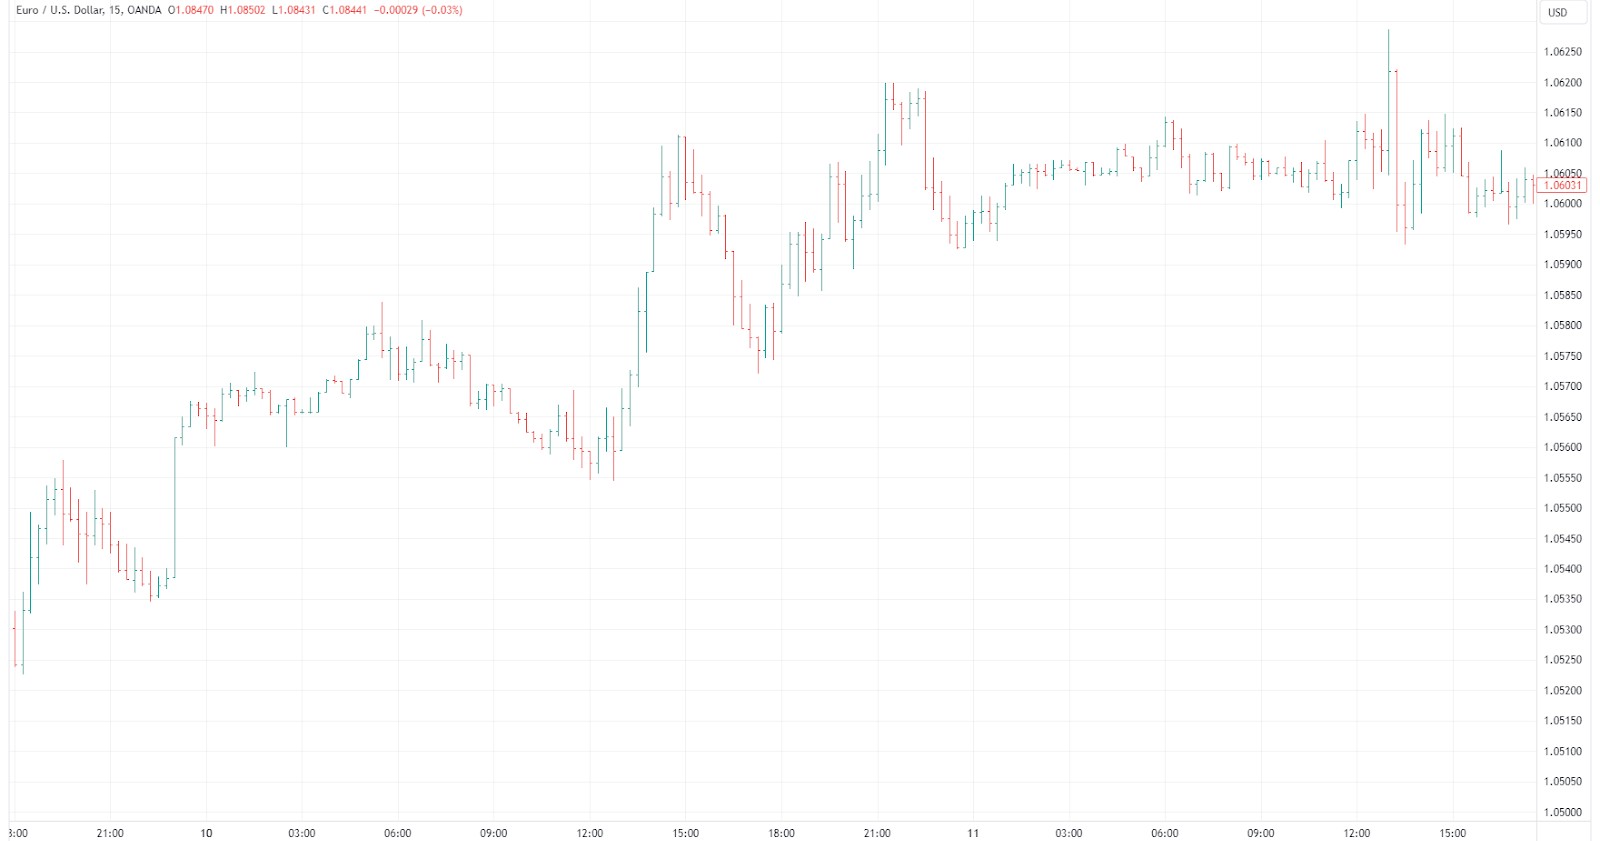
1. Using charts to identify trends
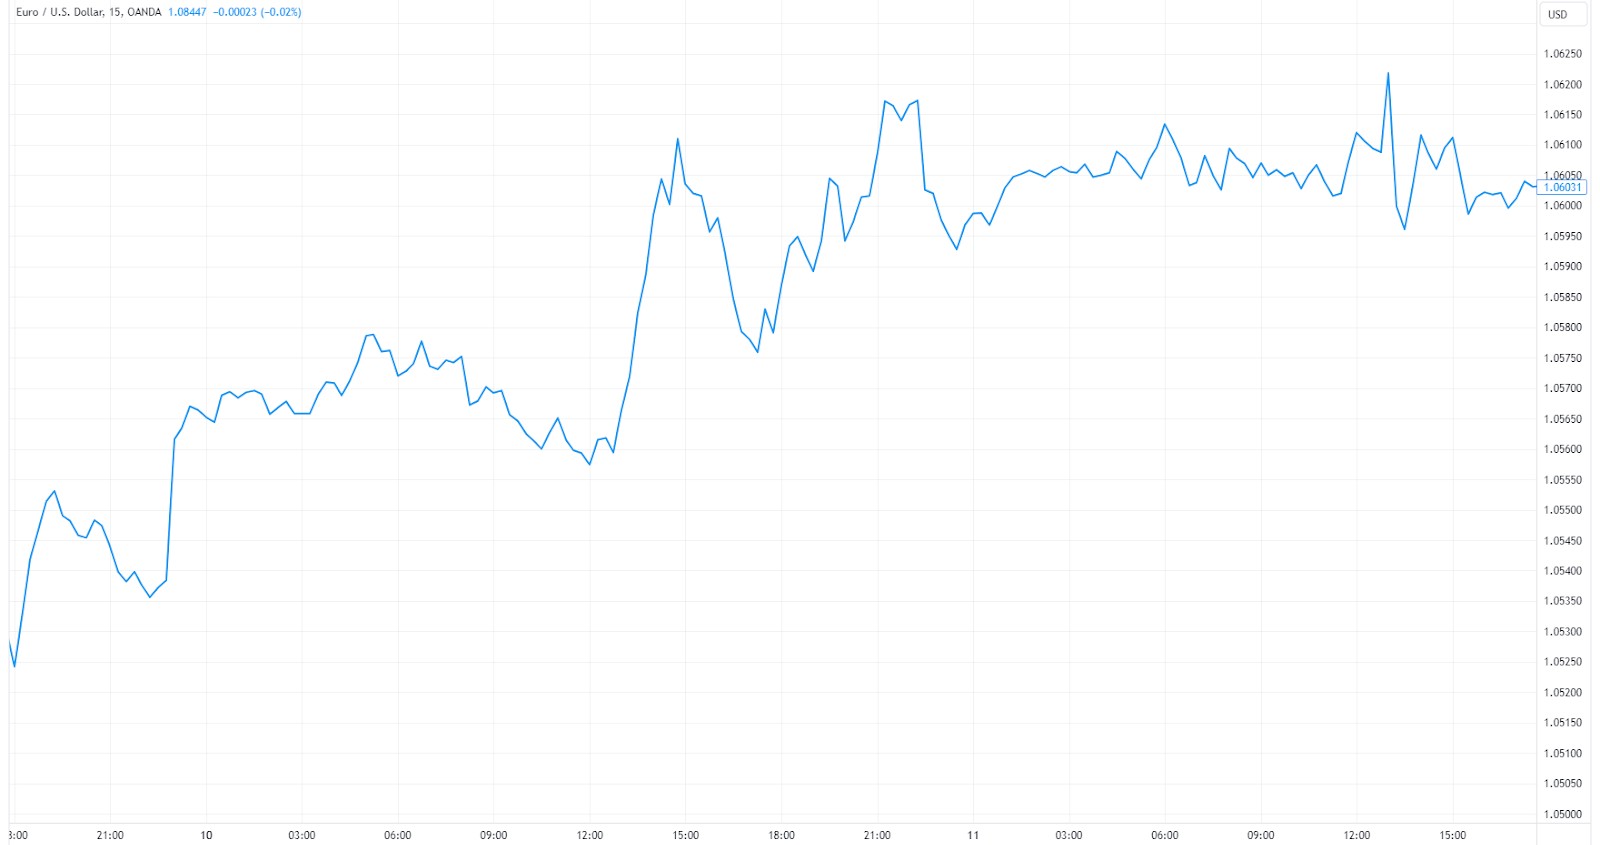
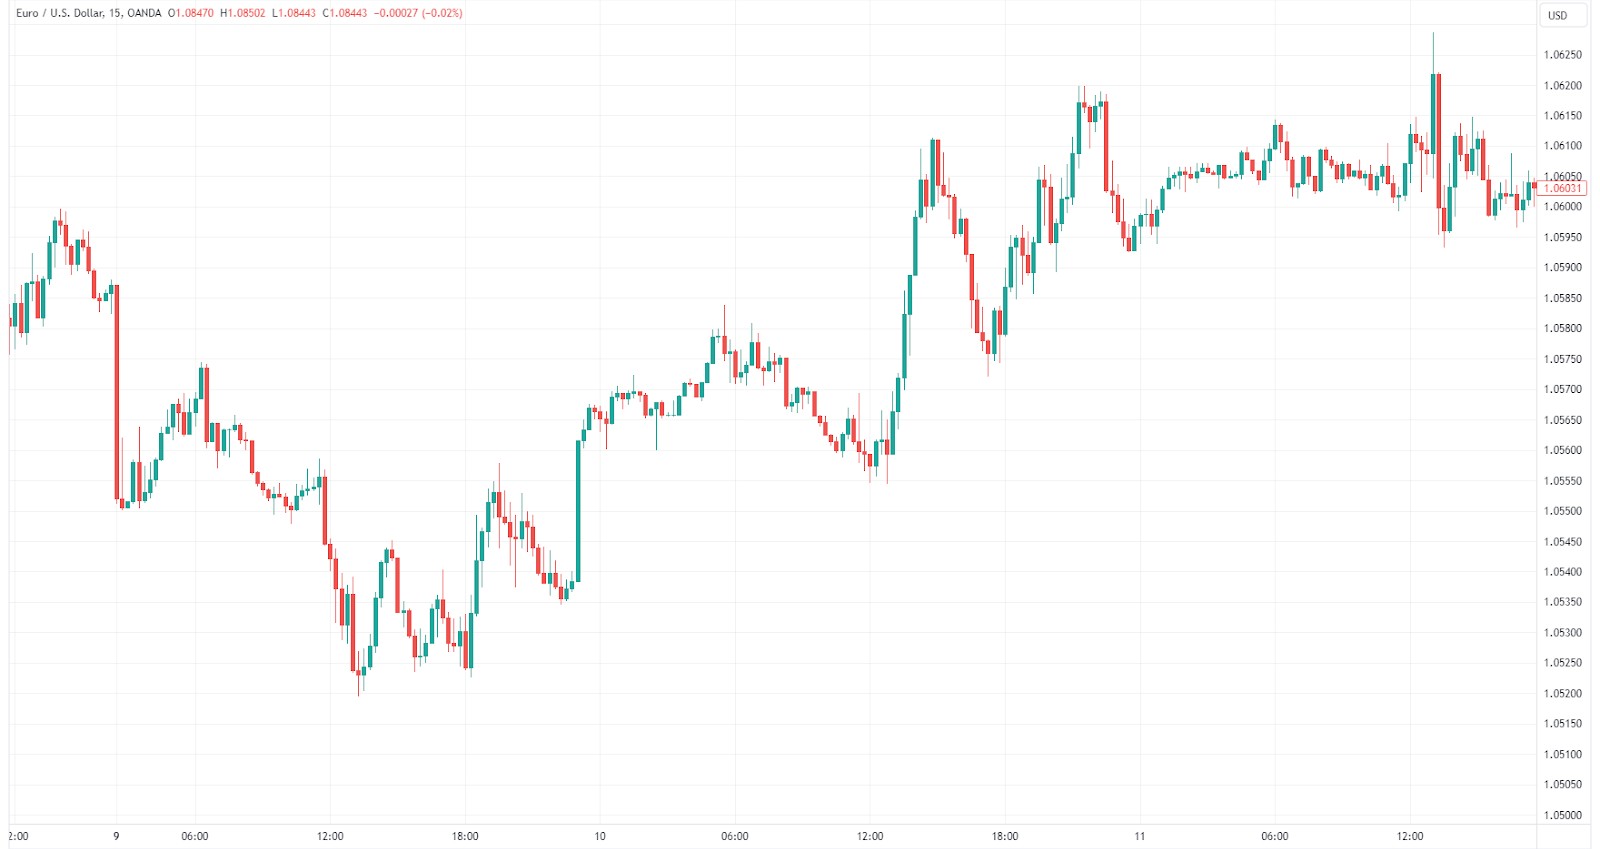
Charts are the primary tool for visually analyzing trends. The most popular chart types include line charts, candlestick charts, and bar charts.
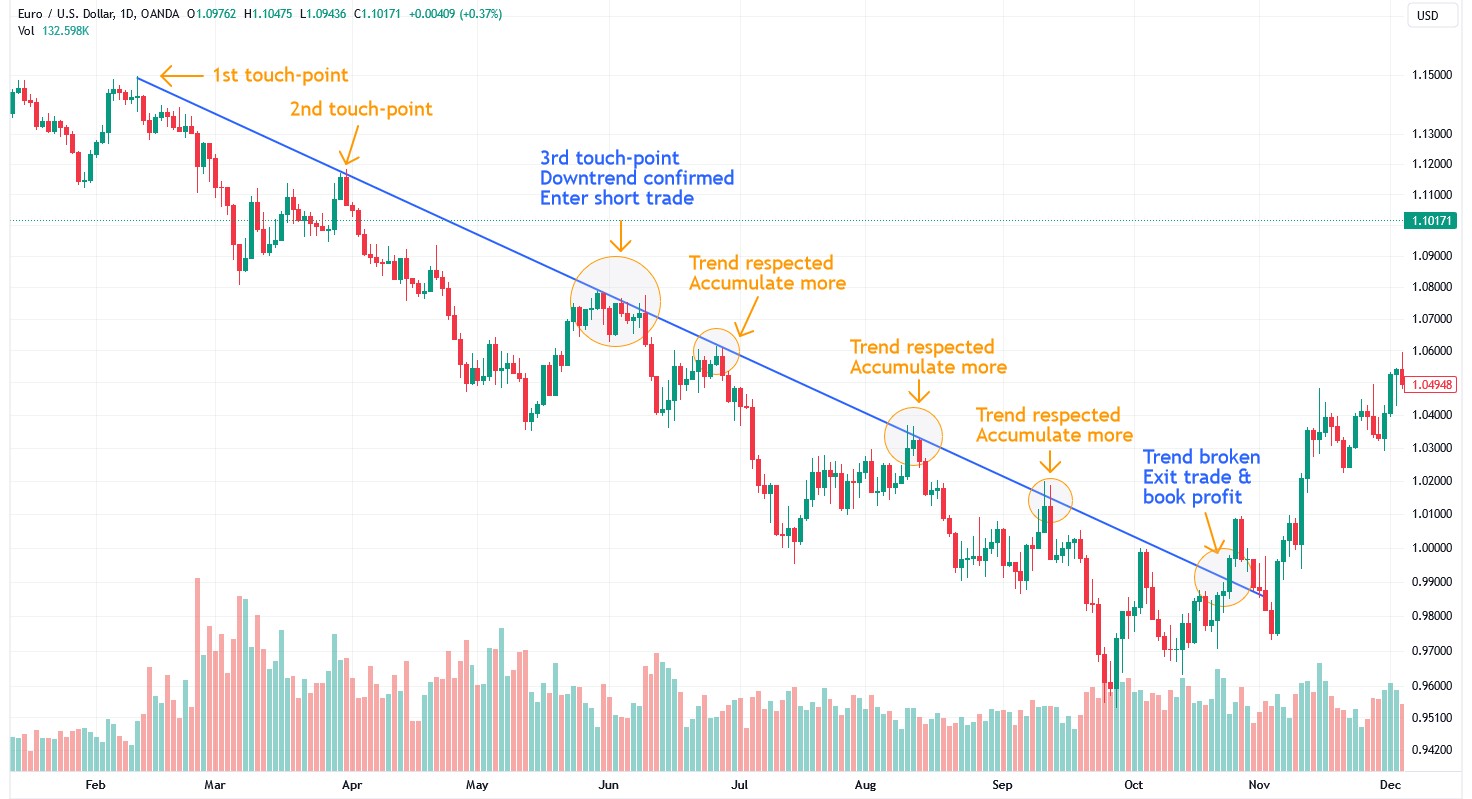
2. Support and resistance levels
Support levels are price levels where an asset typically finds support when falling.
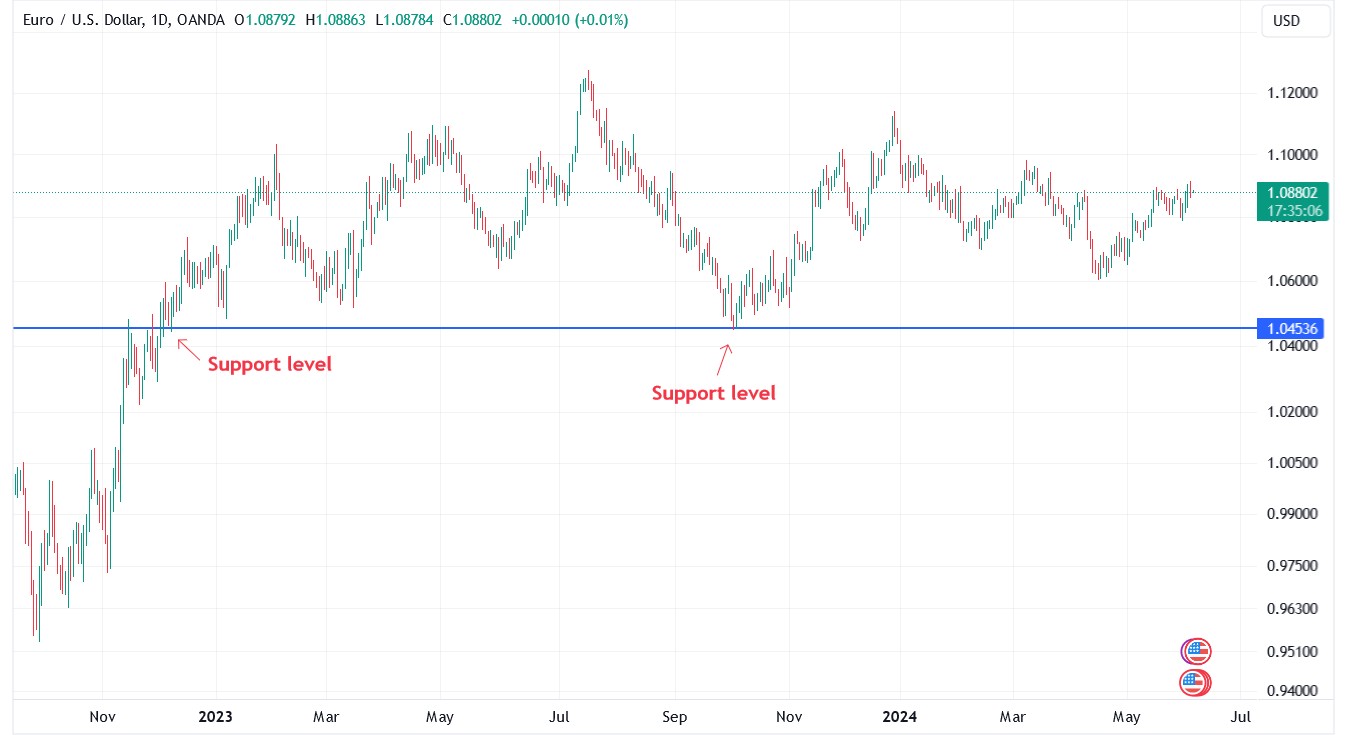
Resistance levels are price levels where an asset typically encounters resistance when rising.
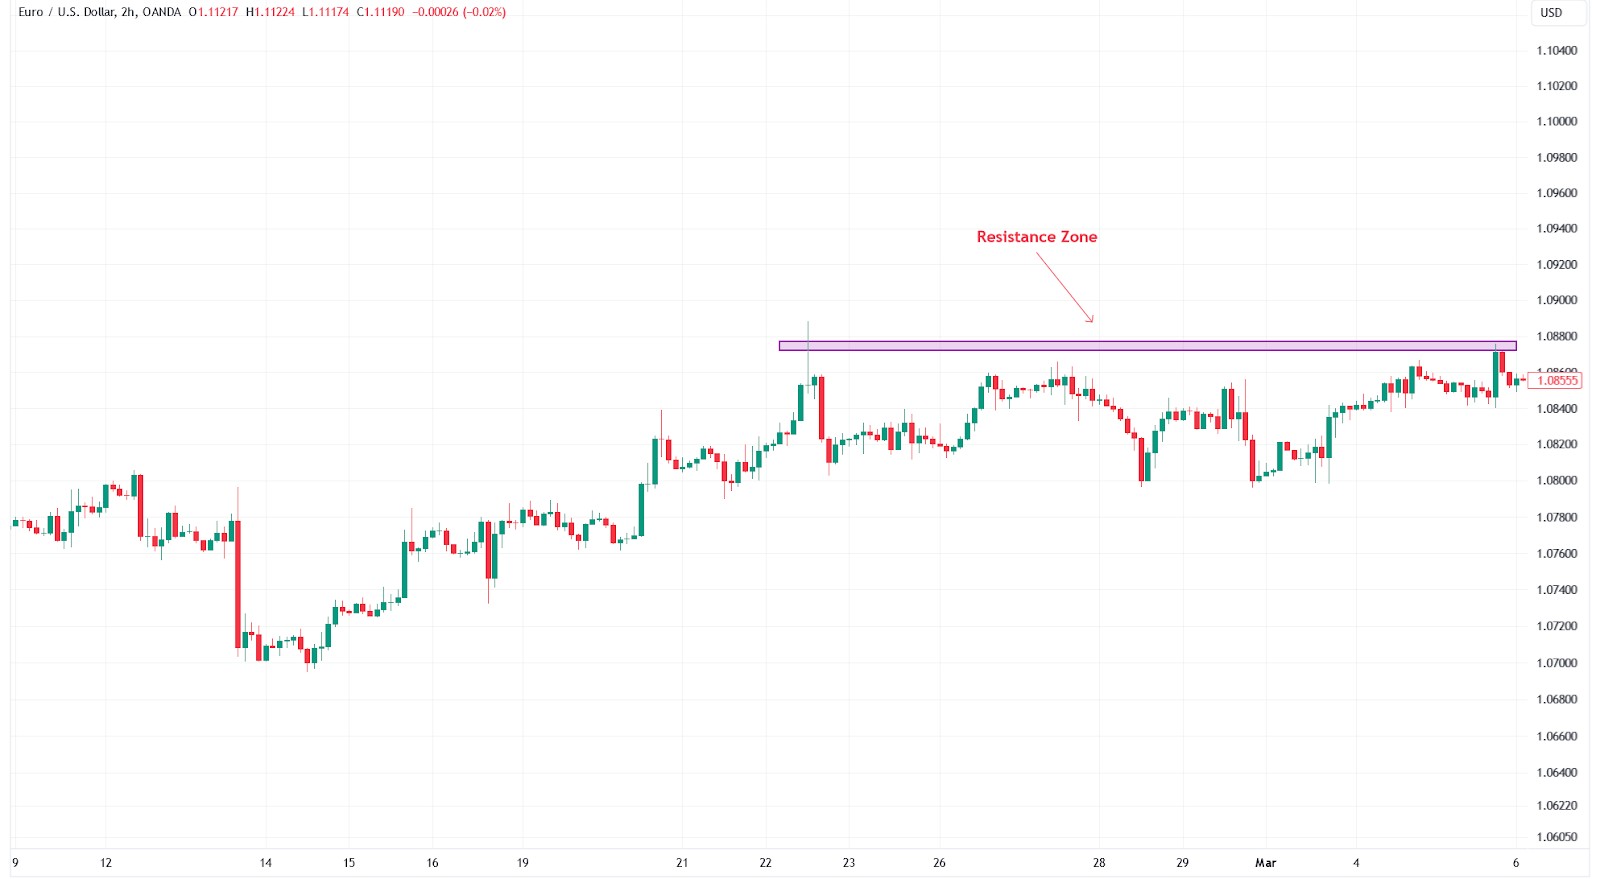
Identifying these levels helps traders make decisions about entering and exiting positions.
Technical indicators for determining the trend
Technical indicators are indispensable tools for traders, allowing them to quantify the direction and strength of a trend. Using indicators such as moving averages, MACD, RSI, and others helps traders make more informed decisions and reduce risks.
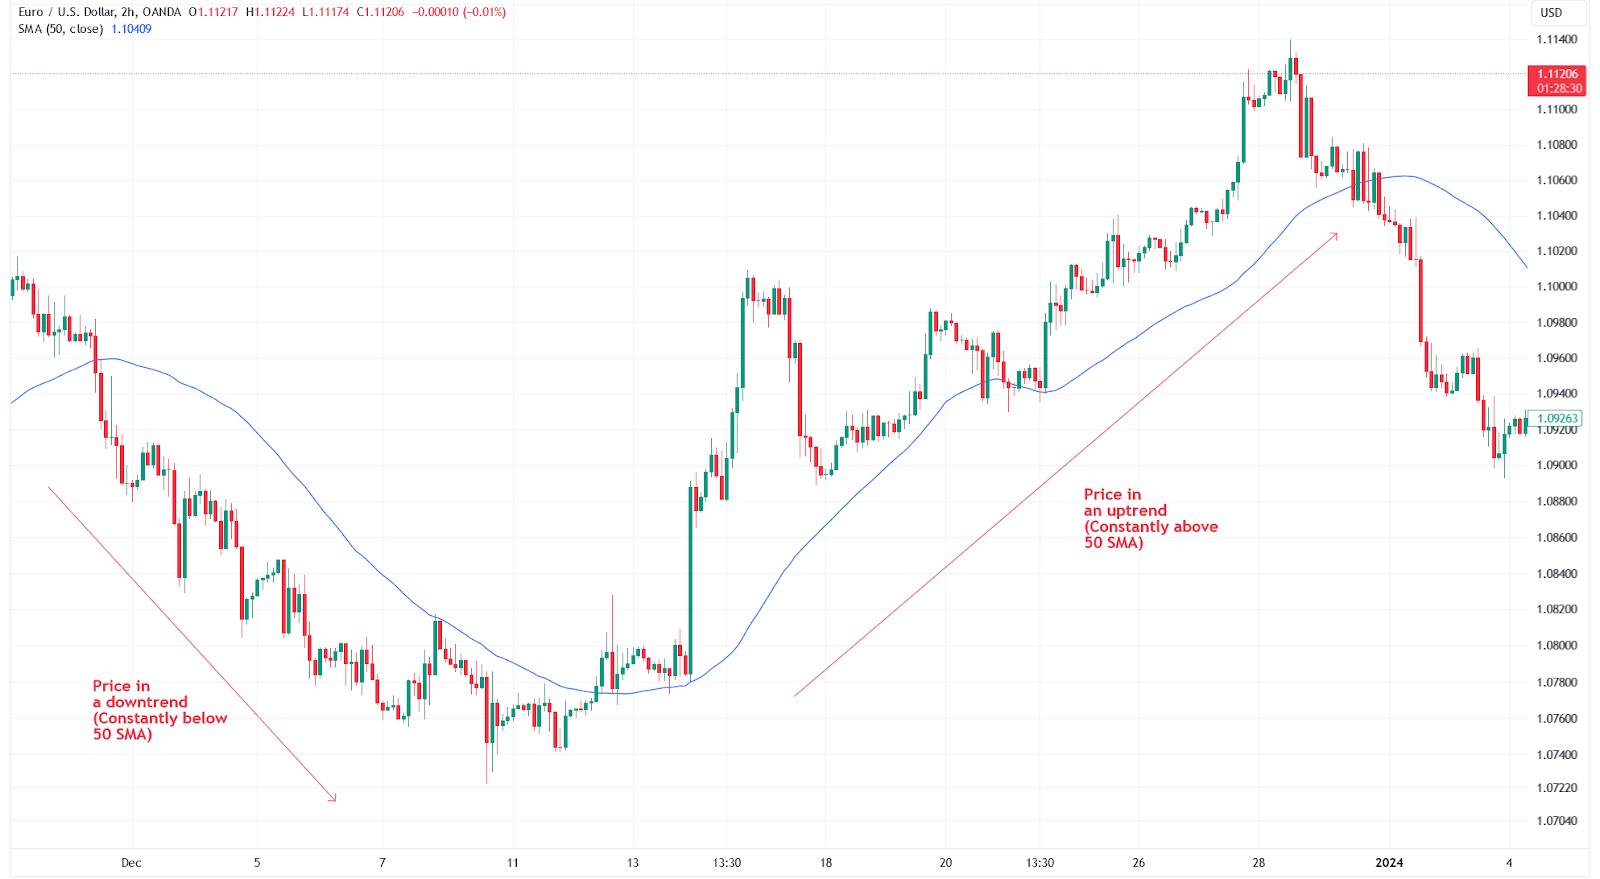
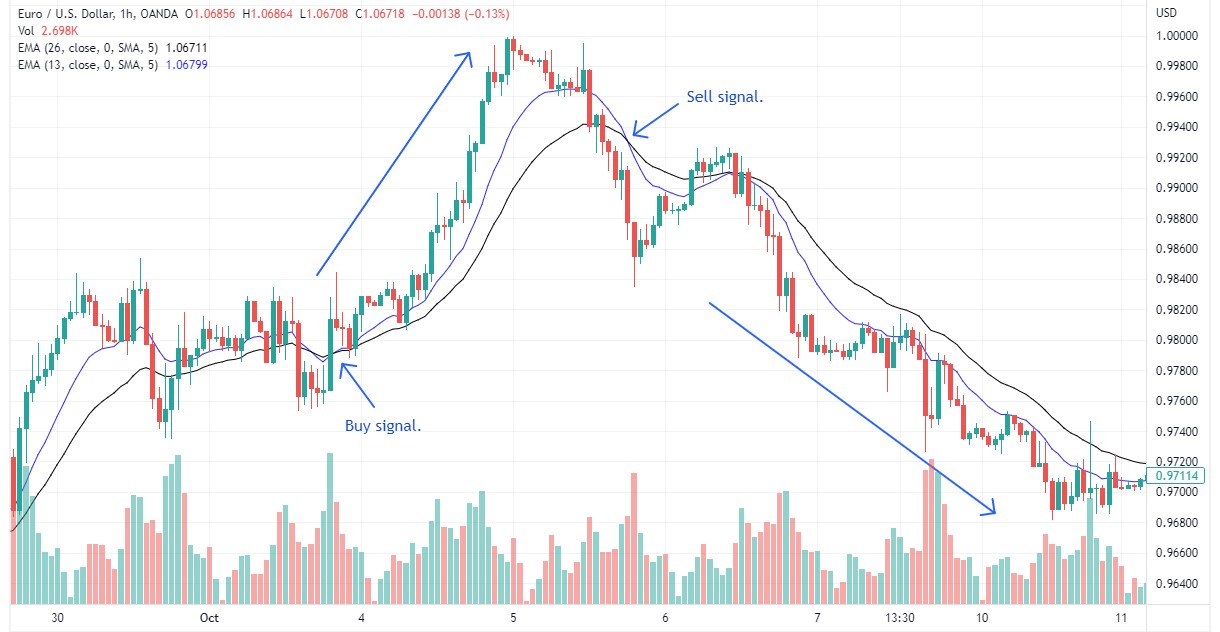
1. Moving Averages (SMA and EMA)
Moving Averages are among the most popular technical indicators for determining a trend. They smooth out price fluctuations, helping traders determine the overall direction of an asset.
Simple Moving Average (SMA). Calculated as the average of prices over a given period. For example, a 50-day SMA would be the average of the closing prices over the last 50 days. It distributes weight equally across all data in the period, making it less sensitive to recent price changes.
Exponential Moving Average (EMA).EMA places more weight on recent prices, making it more sensitive to changes. For example, a 50-day EMA will react more to recent price fluctuations than a 50-day SMA.
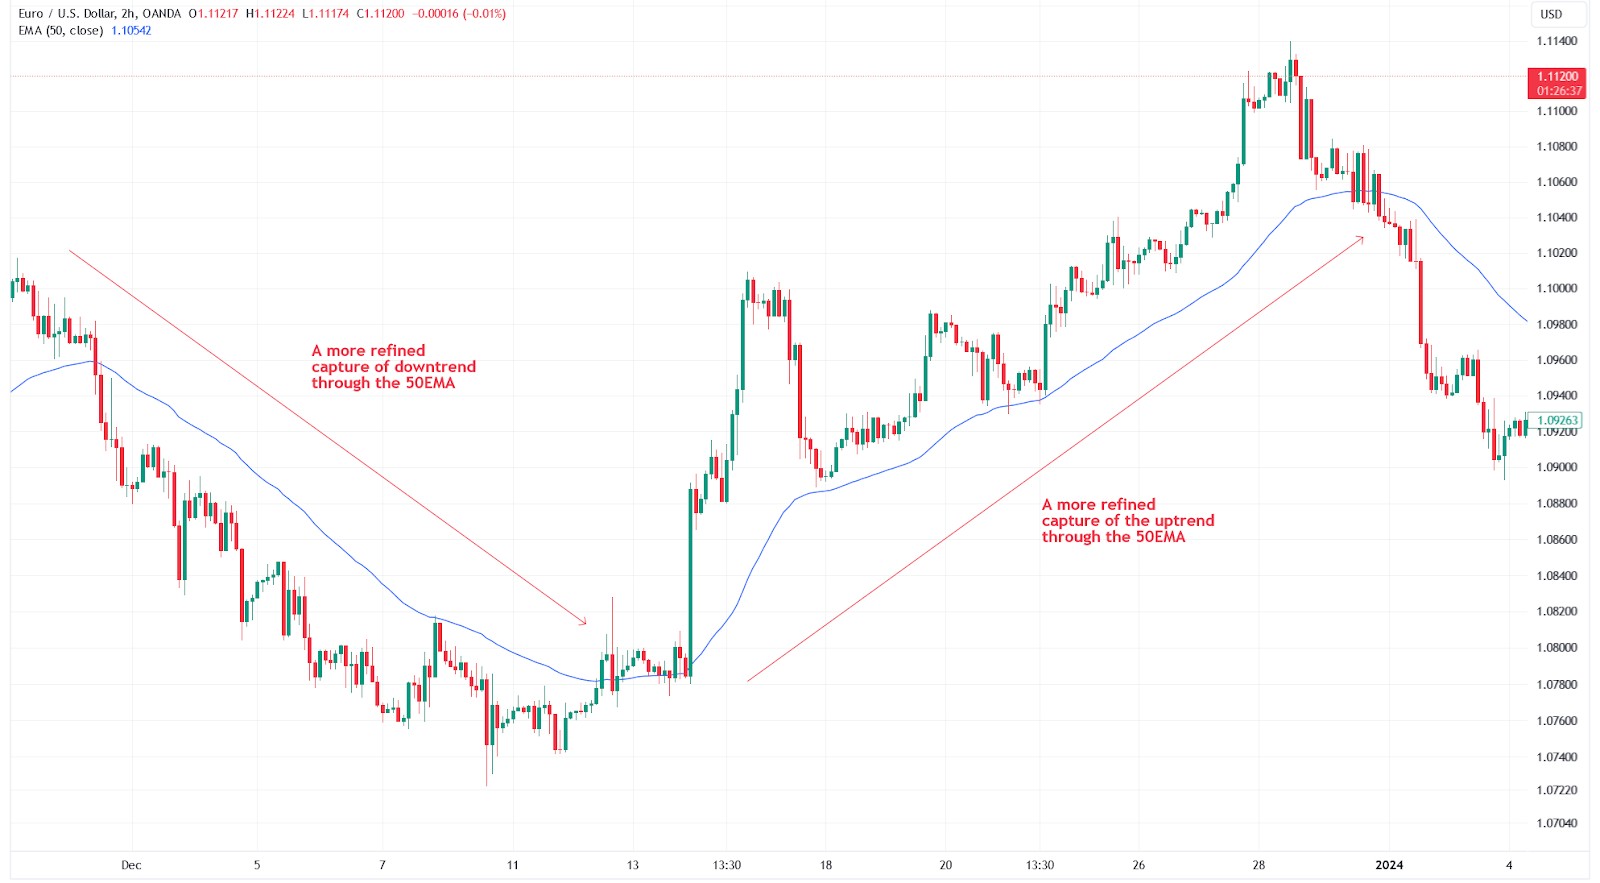
The primary use of SMA and EMA is to determine trend direction and identify crossover points that may signal possible trend changes. For example, if the 50-day EMA crosses above the 200-day EMA, it may indicate the beginning of an uptrend.
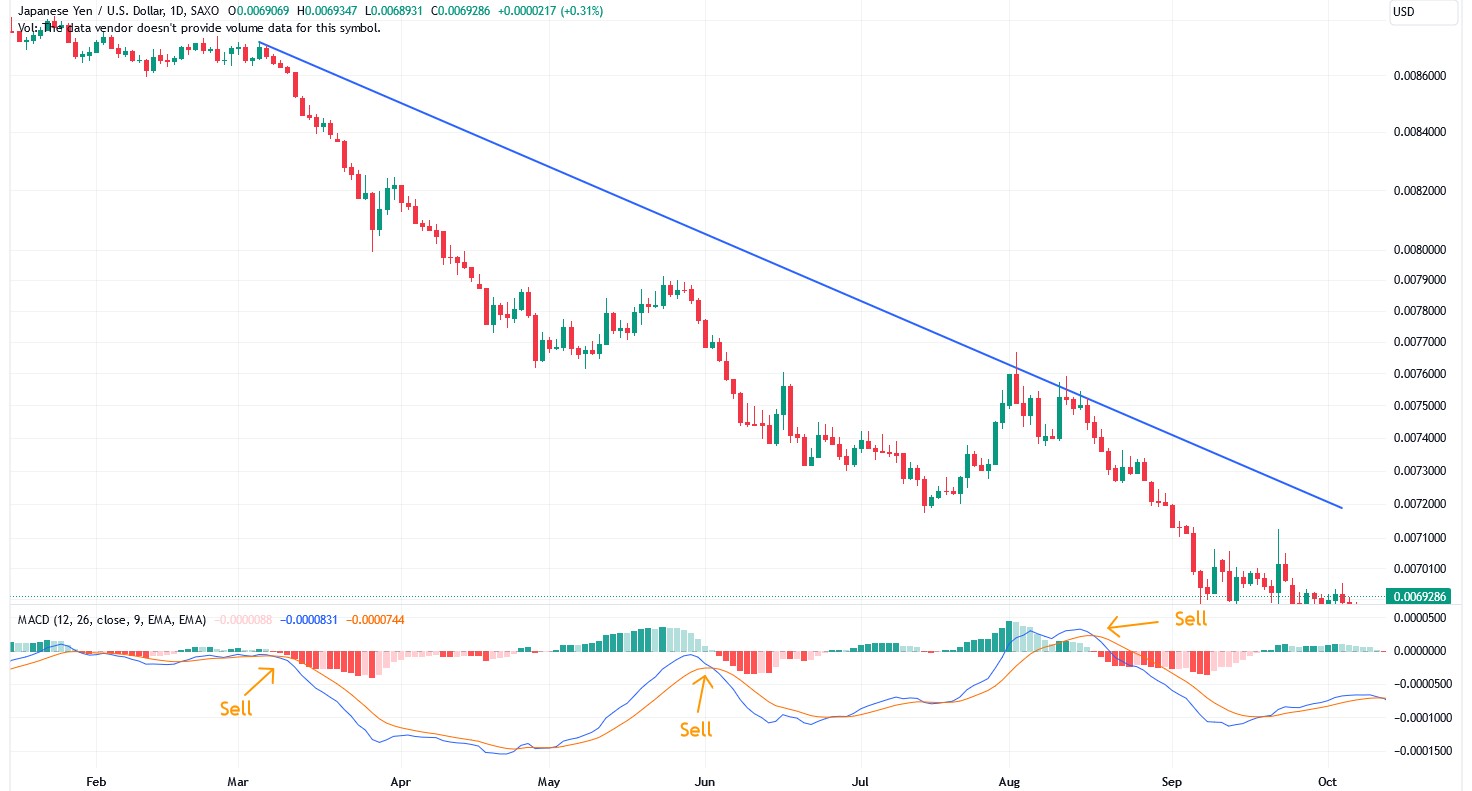
2. MACD (Moving Average Convergence Divergence) Indicator
MACD is a trend and oscillator indicator that is used to determine the strength and direction of a trend, as well as to identify potential reversal points.
MACD Line. The difference between the 12-day and 26-day EMA
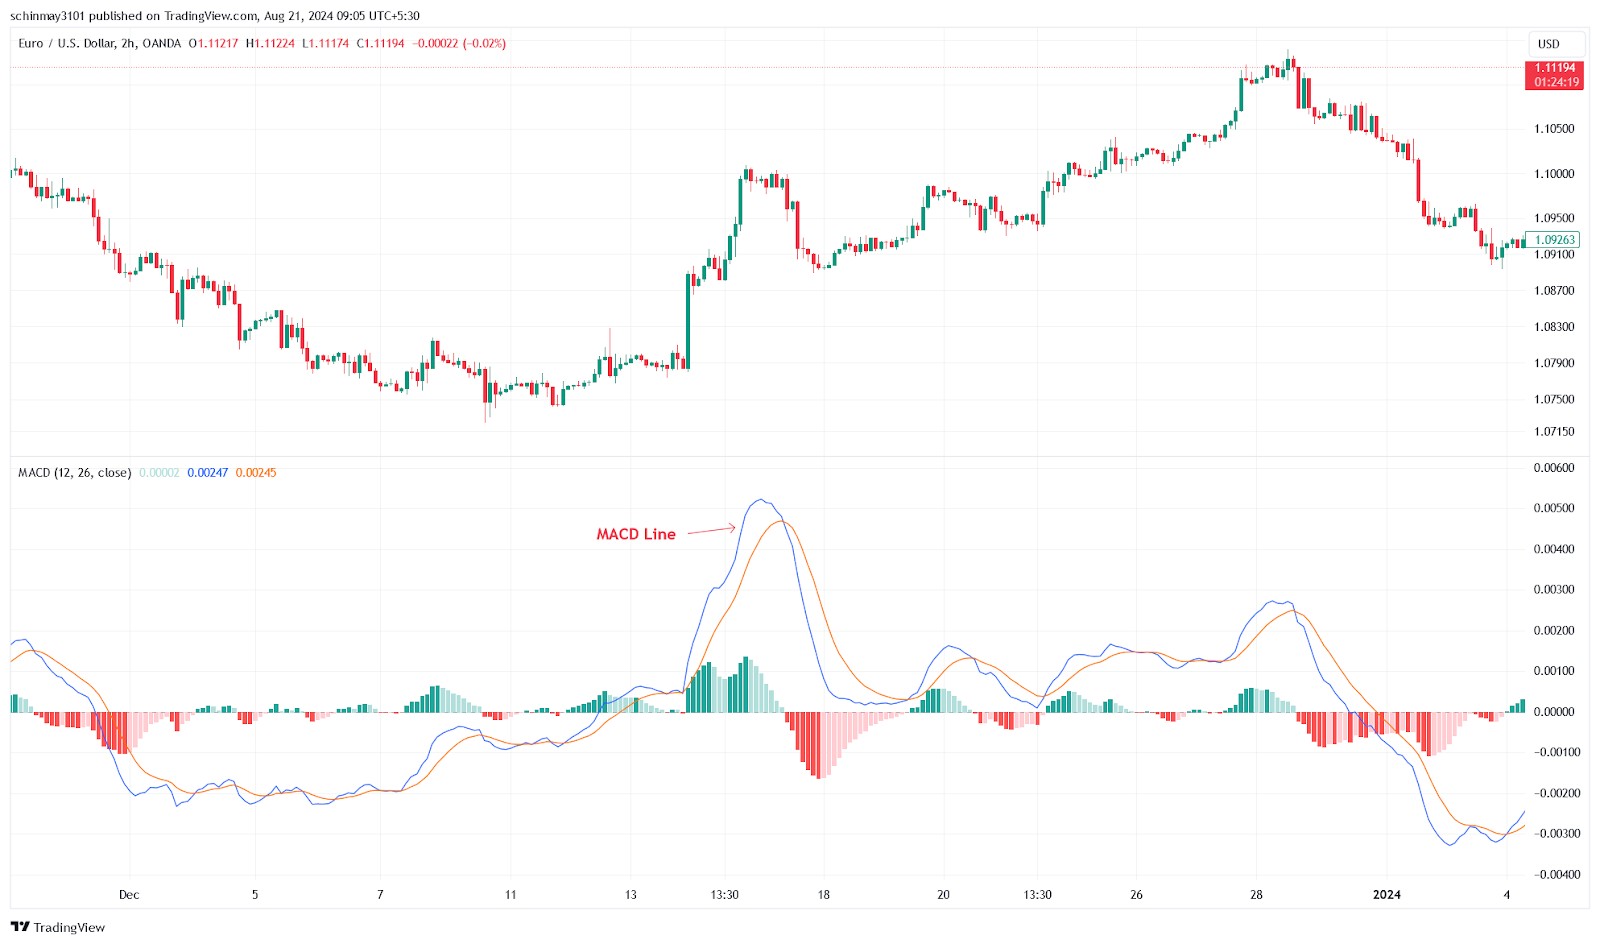
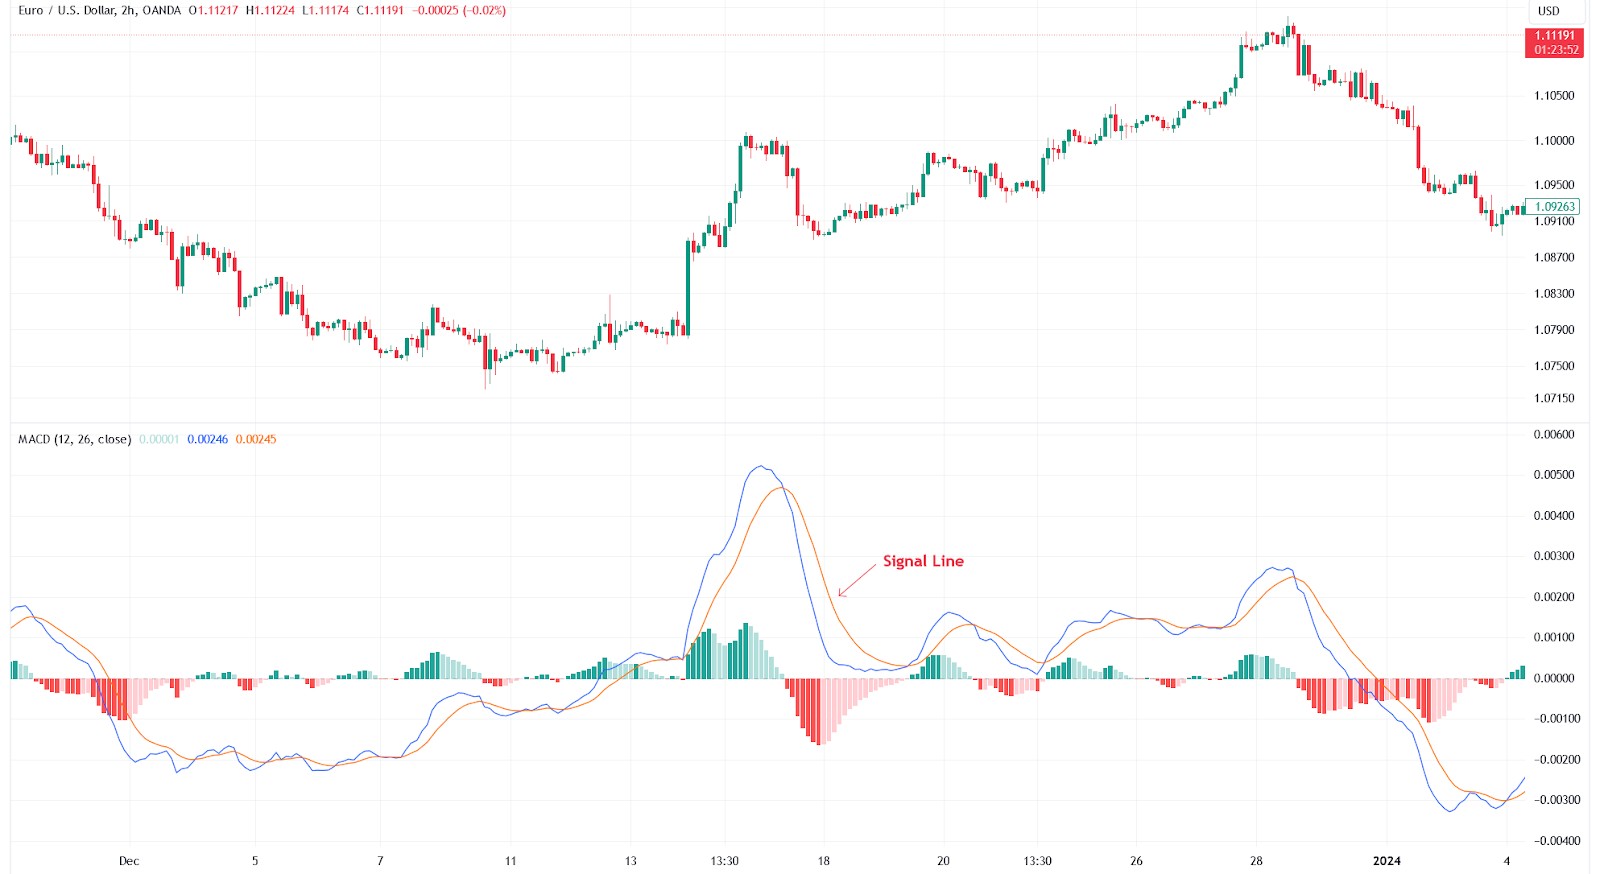
Signal Line. The 9-day EMA of the MACD Line
MACD Histogram. The difference between the MACD Line and the Signal Line
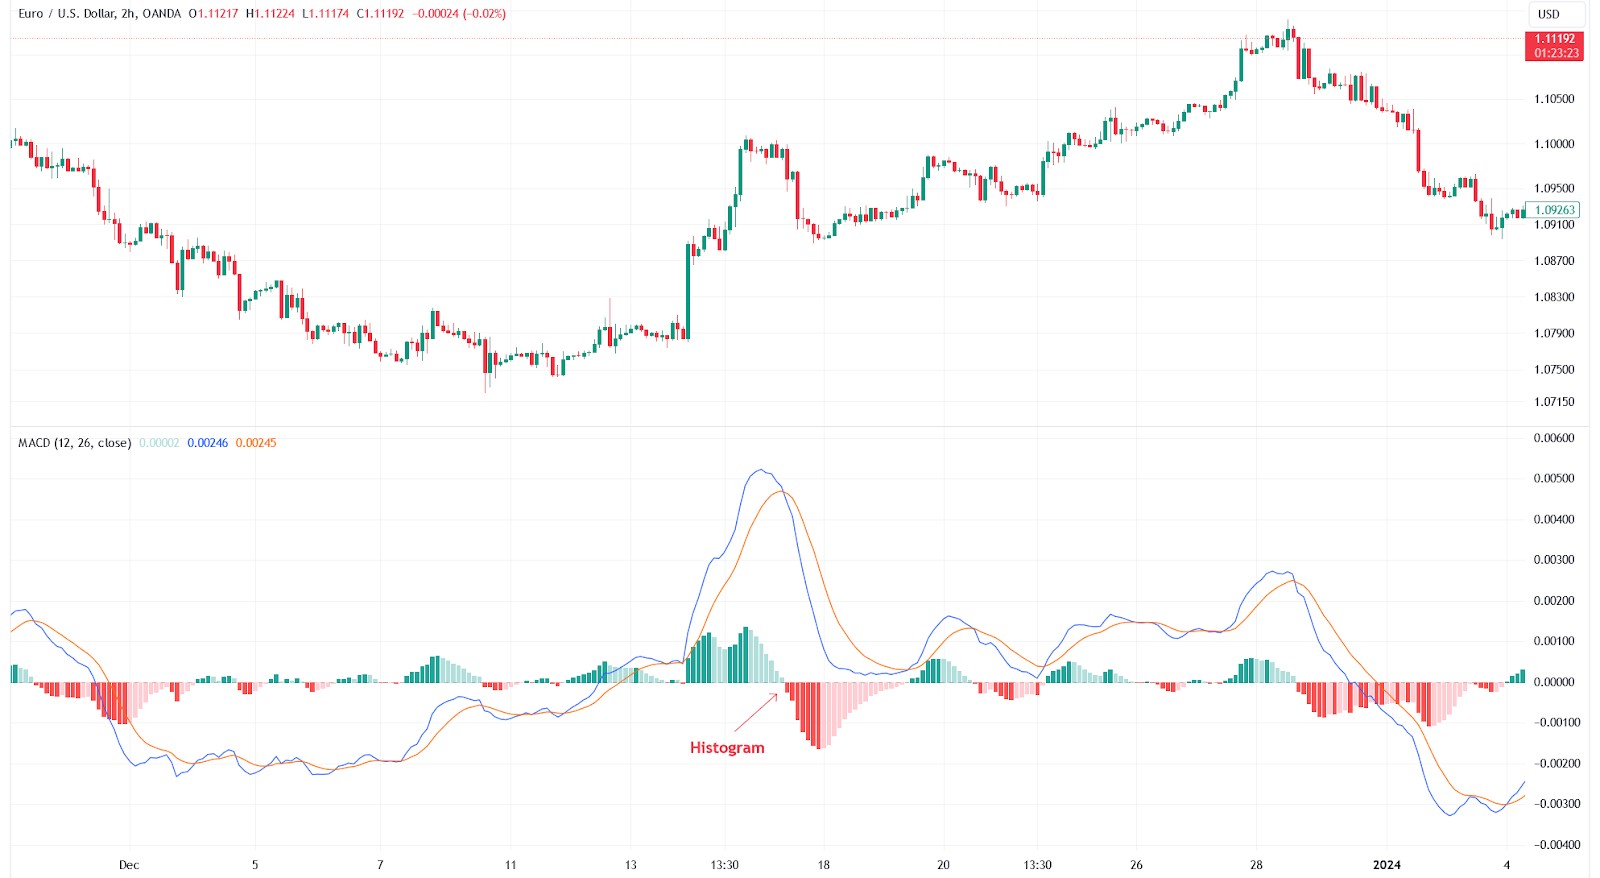
When the MACD Line crosses above the Signal Line, it is considered a bullish signal, indicating a possible increase in prices. A reverse crossover is considered a bearish signal, indicating a possible decrease in prices. MACD is also useful for identifying divergences between MACD and the price of an asset, which may indicate a change in trend.
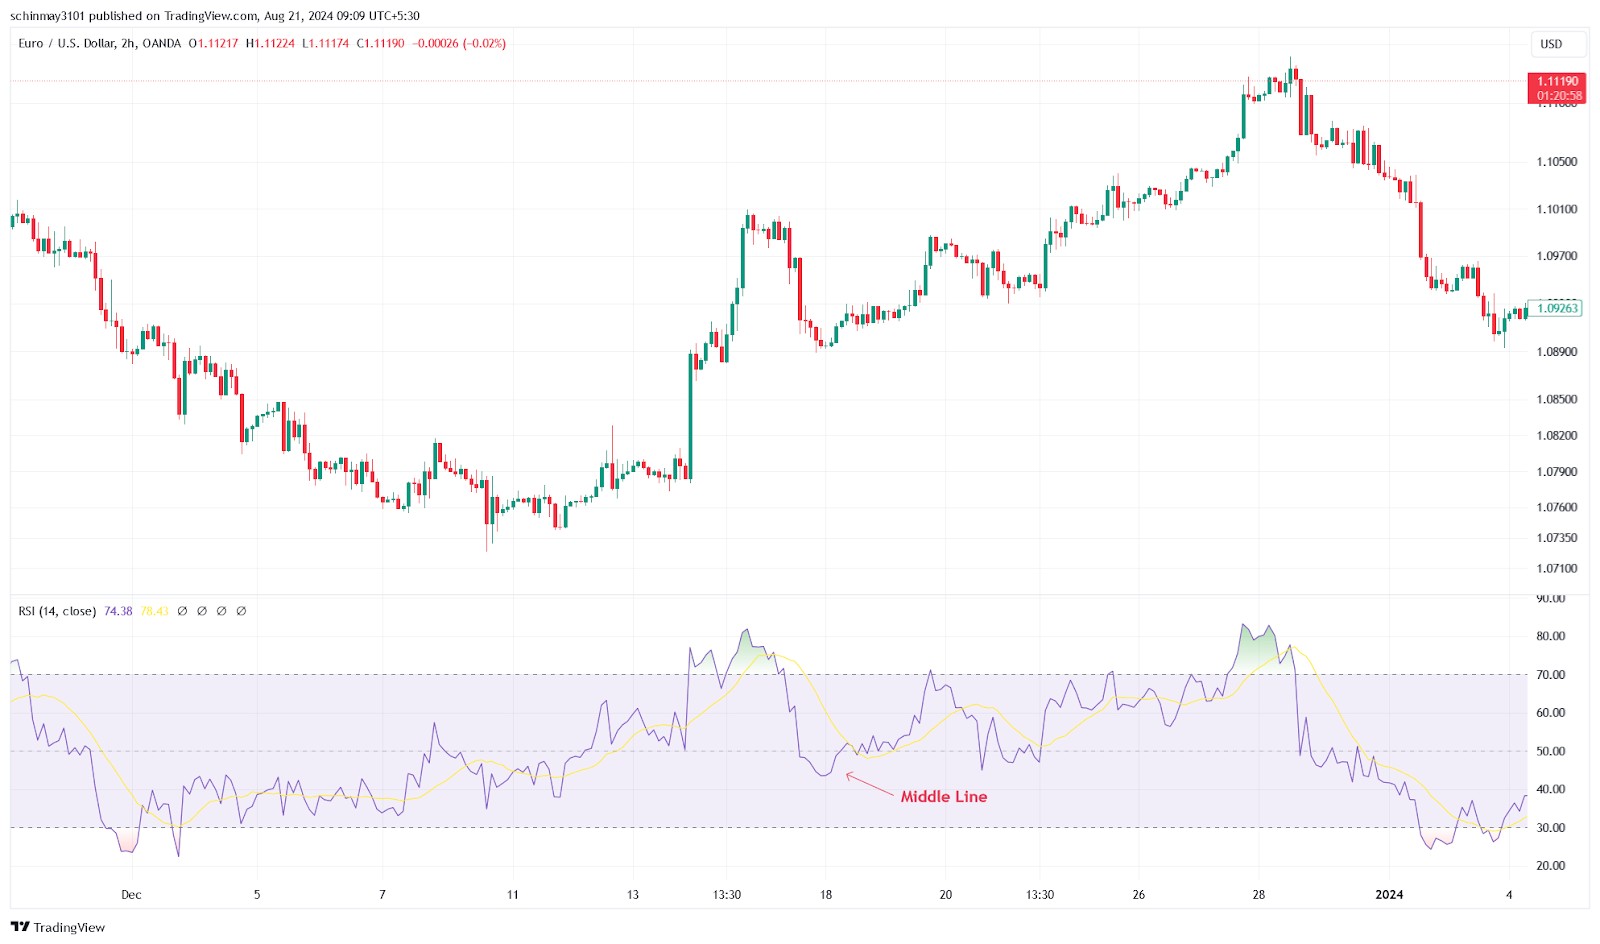
3. RSI (Relative Strength Index)
RSI measures the speed and change of price movements, helping to determine whether an asset is overbought or oversold.
RSI Calculation
RSI = 100 - 100/1+RS
where
RS = Average profit/Average loss
An RSI reading above 70 indicates that the asset is overbought and may fall in price, while a reading below 30 indicates that the asset is oversold and may rise in price. RSI can also be used to identify divergences, which signal possible trend reversals.
Bollinger Bands
Bollinger Bands measure market volatility and help to identify possible trend reversal points.
Middle Line. Typically a 20-day SMA.
Upper and Lower Bands. Situated a certain number of standard deviations (usually 2) above and below the middle line.
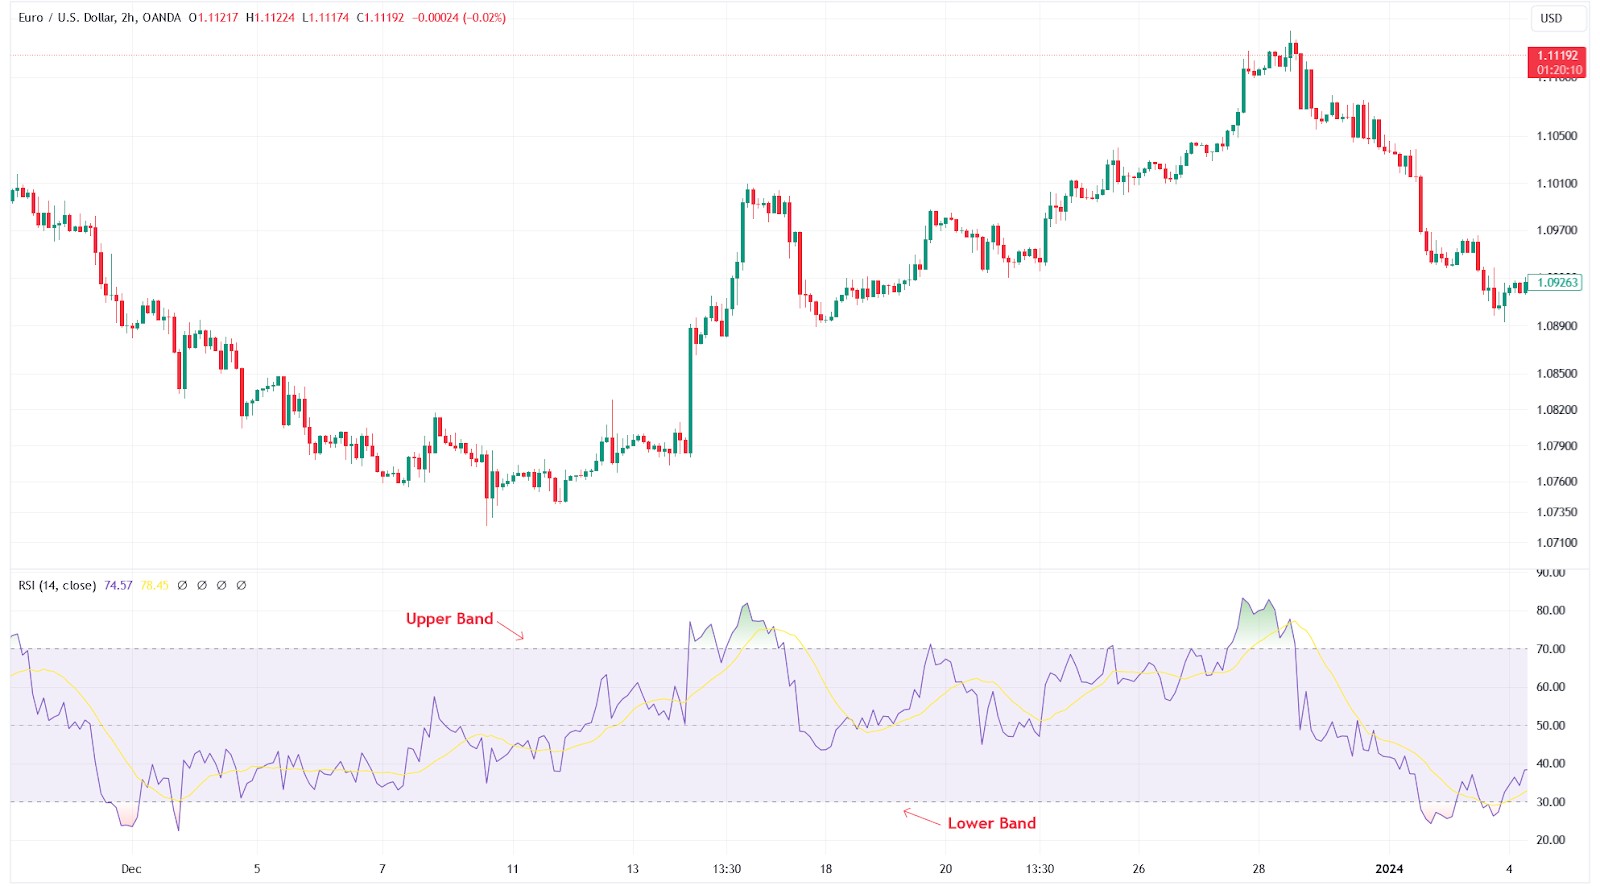
When the price approaches the upper band, the asset may be overbought, and when it approaches the lower band, it may be oversold. Narrowing of the bands (squeeze) often foreshadows a sharp increase in volatility and the beginning of a new trend.
4. ADX (Average directional index) indicator
ADX measures the strength of a trend without regard to its direction, helping traders determine whether to continue following the trend or wait for it to reverse.
ADX calculation. ADX is calculated based on the average of the Directional Movement Index (DMI), which includes +DI and -DI, which measure the direction of price movement.
ADX = ∑ni=1DXi/n
where DXi are the Directional Movement Index values for each period and n is the number of periods (usually 14).
ADX readings above 25 indicate a strong trend, while readings below 20 indicate a weak or no trend.
Using ADX in combination with other indicators, such as RSI or MACD, can improve the accuracy of the analysis and help traders make more informed decisions.
How to trade with a trend
Trend-following strategy. Trend-following involves opening positions in the direction of the current trend. This strategy can be especially effective during strong trends.
Moving average strategy. Moving averages help determine entry and exit points based on the intersection of moving average lines.
MACD strategy. MACD strategy involves entering the market when the MACD lines cross and exiting when they cross back.
Combination approach to trend analysis
1. Using multiple indicators to confirm a trend
A combination approach involves using multiple indicators to confirm a trend. For example, if the SMA and RSI show an uptrend, and the MACD confirms this, the probability of correctly identifying the trend increases.
2. The role of volume in confirming trend strength
Trading volumes can serve as an indicator of trend strength. High volumes confirm the strength of a trend, while low volumes may indicate its weakness or a possible reversal.
Risk management
Stop losses and take profits help limit losses and lock in profits. Setting these orders is an important part of risk management. Using stop losses at support and resistance levels, as well as partially closing positions when certain targets are reached, helps minimize risks.
We have selected several reliable brokers to test our investment decisions based on chart analysis and technical indicators. The key criteria when choosing a broker are low fees, access to a wide range of markets, platform convenience, quality of analytical tools, as well as the reputation and reliability of the company.
| Demo | Min. deposit, $ | Max. leverage | Min Spread EUR/USD, pips | Max Spread EUR/USD, pips | Signals (alerts) | Copy trading | Trading bots (EAs) | Open an account | |
|---|---|---|---|---|---|---|---|---|---|
| Yes | 100 | 1:500 | 0,4 | 1,5 | No | No | Yes | Open an account Your capital is at risk. |
|
| Yes | 5 | 1:1000 | 0,7 | 1,2 | Yes | Yes | Yes | Open an account Your capital is at risk. |
|
| Yes | No | 1:500 | Not supported | Not supported | No | Yes | Yes | Open an account Your capital is at risk. |
|
| Yes | 10 | 1:2000 | 0,5 | 2 | No | Yes | Yes | Open an account Your capital is at risk. |
|
| Yes | 100 | 1:500 | 0,4 | 1,2 | Yes | Yes | Yes | Open an account Your capital is at risk. |
Successful trading is not only about identifying trends, but also about risk management

When it comes to identifying market trends, it is a good idea to use additional techniques to improve your analytical skills. One such approach is multi-frame analysis. This method involves analyzing trends on different time frames, from short-term to long-term. For example, if the daily chart shows an uptrend, but the weekly chart shows a downtrend, this may indicate a possible correction or reversal.
Another important aspect is taking into account fundamental factors. Technical analysis is certainly important, but you should not forget about news, economic reports, and general market conditions. For example, even the strongest technical signal can turn out to be false against the backdrop of an important economic event, such as the release of GDP data or a central bank decision on interest rates. Therefore, always keep your finger on the pulse of economic news and take it into account in your analysis.
Also, do not forget about the importance of capital and risk management. Even if you are confident in your analysis, always set stop losses and do not risk a large percentage of your capital on a single trade. This will help minimize losses in the event of an unexpected trend reversal and preserve your capital for future trading opportunities. Successful trading is not only about identifying trends, but also about effective risk management.
Conclusion
Identifying trends is an important element of successful trading. Visual analysis, the use of technical indicators, and a combined approach help traders make informed investment decisions while minimizing the likelihood of losses. Beginner traders are advised to start with learning the basics of visual analysis and simple technical indicators, gradually moving on to more complex methods and a combined approach.
FAQs
What other indicators can help in determining the trend, besides those mentioned in the article?
In addition to the indicators discussed, you can use Ichimoku Kinko Hyo, which includes several lines to determine the trend and support/resistance levels. The Parabolic SAR indicator can also be useful, which helps identify trend reversal points.
How can multi-frame analysis improve the accuracy of trend determination?
Multi-frame analysis improves accuracy by allowing traders to see trends on different time intervals. For example, confirming a long-term trend on a weekly chart and a short-term trend on a daily chart helps avoid false signals and improves the timing of trade entry.
How can using oscillators, such as Stochastic, help in trend analysis?
Oscillators help determine whether an asset is overbought or oversold. They can signal possible trend reversals, especially if their readings diverge from the price direction, allowing traders to exit or enter a trade in time.
How can news and economic events affect the current trend?
Important economic reports, such as employment data or interest rate decisions, can change market expectations and cause a trend reversal. It is important for traders to keep an eye on the economic calendar and factor these events into their analysis.
Related Articles
Team that worked on the article
Maxim Nechiporenko has been a contributor to Traders Union since 2023. He started his professional career in the media in 2006. He has expertise in finance and investment, and his field of interest covers all aspects of geoeconomics. Maxim provides up-to-date information on trading, cryptocurrencies and other financial instruments. He regularly updates his knowledge to keep abreast of the latest innovations and trends in the market.
Chinmay Soni is a financial analyst with more than 5 years of experience in working with stocks, Forex, derivatives, and other assets. As a founder of a boutique research firm and an active researcher, he covers various industries and fields, providing insights backed by statistical data. He is also an educator in the field of finance and technology.
As an author for Traders Union, he contributes his deep analytical insights on various topics, taking into account various aspects.
Mirjan Hipolito is a journalist and news editor at Traders Union. She is an expert crypto writer with five years of experience in the financial markets. Her specialties are daily market news, price predictions, and Initial Coin Offerings (ICO).
Risk management is a risk management model that involves controlling potential losses while maximizing profits. The main risk management tools are stop loss, take profit, calculation of position volume taking into account leverage and pip value.
Bollinger Bands (BBands) are a technical analysis tool that consists of three lines: a middle moving average and two outer bands that are typically set at a standard deviation away from the moving average. These bands help traders visualize potential price volatility and identify overbought or oversold conditions in the market.
Copy trading is an investing tactic where traders replicate the trading strategies of more experienced traders, automatically mirroring their trades in their own accounts to potentially achieve similar results.
Trend trading is a trading strategy where traders aim to profit from the directional movements of an asset's price over an extended period.
Risk management in Forex involves strategies and techniques used by traders to minimize potential losses while trading currencies, such as setting stop-loss orders and position sizing, to protect their capital from adverse market movements.


-
 Afghanistan
-
 Albania
-
 Algeria
-
 Argentina
-
 Armenia
-
 Australia
-
 Austria
-
 Azerbaijan
-
 Bahamas
-
 Bahrain
-
 Bangladesh
-
 Belgium
-
 Botswana
-
 Brazil
-
 Brunei
-
 Bulgaria
-
 Burma
Burma
-
 Cambodia
-
 Cameroon
-
 Canada
-
 Chile
Chile
-
 China
China
-
 Colombia
-
 Costa Rica
-
 Cote d'Ivoire
-
 Croatia
-
 Cyprus
-
 Czech Republic
-
 Denmark
-
 Dominican Republic
-
 Ecuador
-
 Egypt
Egypt
-
 Estonia
-
 Eswatini
-
 Ethiopia
-
 Finland
-
 France
-
 Georgia
-
 Germany
-
 Ghana
Ghana
-
 Greece
-
 Haiti
Haiti
-
 Hong Kong
-
 Hungary
-
 India
India
-
 Indonesia
-
 Iran, Islamic republic
-
 Iraq
Iraq
-
 Ireland
-
 Israel
-
Italy
-
 Jamaica
-
 Japan
Japan
-
 Jordan
-
 Kazakhstan
-
 Kenya
Kenya
-
 Korea
Korea
-
 Kuwait
-
 Kyrgyzstan
-
 Laos
Laos
-
 Latvia
-
 Lebanon
-
 Libyan Arab Jamahiriya
-
 Lithuania
-
 Luxembourg
-
 Macedonia
-
 Madagascar
-
 Malaysia
-
 Malta
Malta
-
 Mauritius
-
 Mexico
-
 Moldova
-
 Mongolia
-
 Montenegro
-
 Morocco
-
 Mozambique
-
 Namibia
-
 Nepal
Nepal
-
 Netherlands
-
 Nigeria
-
 Norway
-
 Oman
Oman
-
 Pakistan
-
 Palestine
-
 Papua New Guinea
-
 Peru
Peru
-
 Philippines
-
 Poland
-
 Portugal
-
 Puerto Rico
-
 Qatar
Qatar
-
 Romania
-
 Rwanda
-
 Saudi Arabia
-
 Serbia
-
 Singapore
-
 Slovakia
-
 Slovenia
-
 Somalia
-
 South Africa
-
 Spain
Spain
-
 Sri Lanka
-
 Sweden
-
 Switzerland
-
 Syrian Arab Republic
-
 Taiwan
-
 Tajikistan
-
 Tanzania, United Republic Of
-
 Thailand
-
 Trinidad and Tobago
-
 Tunisia
-
 Turkey
-
 UAE
UAE
-
 Uganda
-
 Ukraine
-
 United Kingdom
-
 United States
-
 Uzbekistan
-
 Venezuela
-
 Vietnam
-
 Yemen
Yemen
-
 Zambia
-
 Zimbabwe
- Forex
- Crypto
