Best Support and Resistance Trading Strategies
Strategies based on technical analysis are built on psychological and mathematical patterns of previous periods. Support and resistance levels are a pattern that determines the points of the most likely change in the direction of the price or confirmation of trend continuation.
In this review, you will learn:
What Support and Resistance levels are.
How to build level lines and determine price reversal points.
How to apply the levels in trading strategies.
This will prove to be useful!
How to construct Support and Resistance in forex trading | Course for Beginners Traders by TU
Below you will find all the information.
What is Support and Resistance
Support and resistance levels in trading are key price levels, where a sufficient number of buyers and sellers capable of reversing the price or shifting trend movement into a flat appear.
Types of levels:
Horizontal. They are horizontal lines built on extremes that can be used to determine reversal prices or signify a flat range.
Horizontal Levels
Trend. They determine the direction of the trend.
Trend Levels
Flexible. These are indicators that form channels, where the price is most of the time.
Flexible Levels
Levels determined by patterns, for example figures of chart analysis, such as Flag, Triangle, etc.
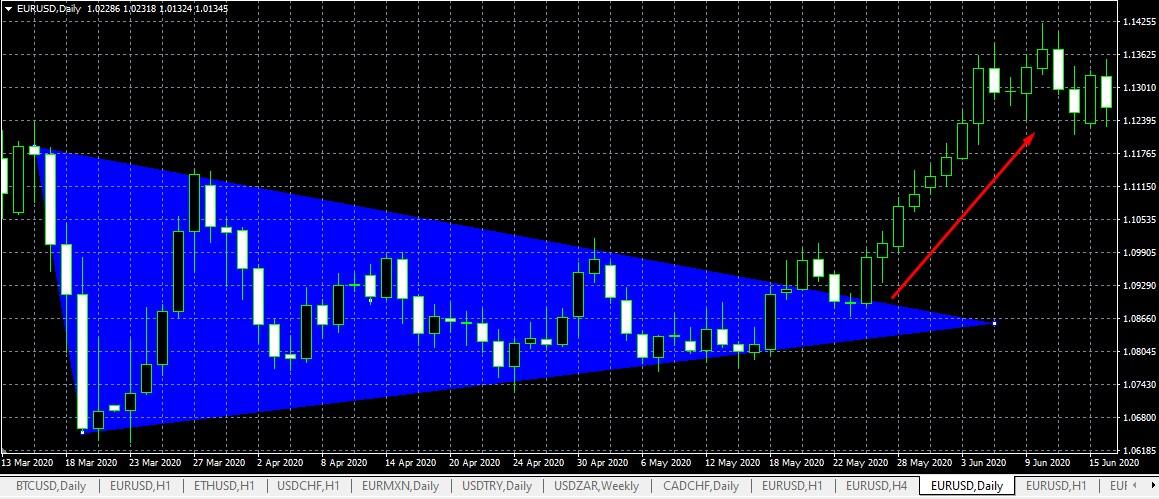
A Triangle Pattern
What is Support Level
Support level indicates the price of a buyer’s interest in the growing market or a seller’s interest in the declining market. On this level, traders open a volume of long positions to seize the advantage of sellers and stop the downward movement of the price. In other words, support level is used to open a long or close a short position.
What is Resistance Level
Resistance level is a level where market participants are inclined to resist the growing trend. On this level, the majority of traders close long positions and open short positions.
Support and Resistances levels are levels where there is a balance of demand and supply. When buyers dominate the market, the price increases, because the supply of the sellers cannot meet demand. However, the higher the price, the fewer people want to buy an asset. The price increases slower and earlier or later hits the ‘ceiling’, i.e. the resistance level, where all bids of the buyers are satisfied by sellers or there are next to no orders.
Three situations can happen next:
The volumes of buyers will match the volumes of sellers, and the price will move into a horizontal flat.
Something will push the buyers to increase purchase volumes, and the breakout of the resistance level will happen.
The buyers, who bought an asset earlier at a lower price will start actively selling it. The supply will top the demand and the price will go down. At some point, buyers will return to the market and start buying the asset at a cheaper price. A balance between both parties of the transactions will be achieved so that the price will hit the ‘floor’ – the support level.
Levels are the key price indicators that determine further development of the situation.
Supply and Demand Zones
Supply and demand zones are zones that form over or under support and resistance levels. The market is inertial and dynamic, and it is impossible to draw a clear horizontal line so that it touches all extremes. Almost always, a candle will close higher or lower in a flat range. These candles will form supply and demand zones – areas, where market participants can create maximum demand or maximum supply.
Demand zone is a zone, where the volumes of buy orders begin to top sell orders. It is a zone, which is below closing prices and where pending orders for closing short or opening long positions are.
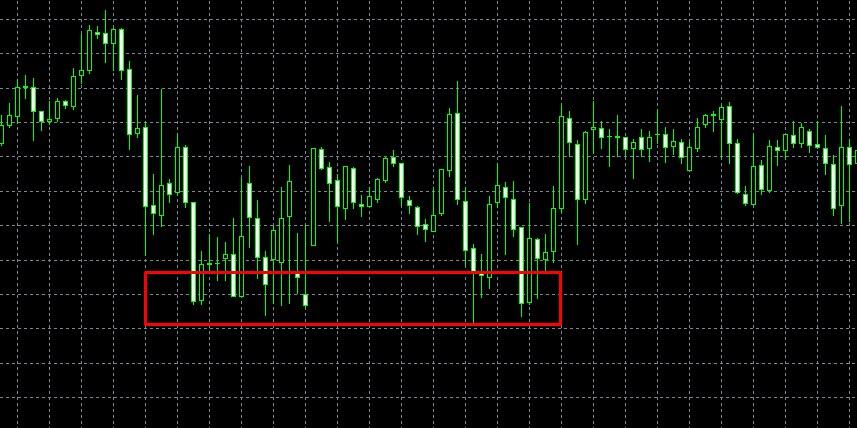
Demand zone
Supply zone is a zone where the volumes of sell orders begin to top buy orders. It is a zone, which is above closing prices and where pending orders for closing long or opening short positions are.
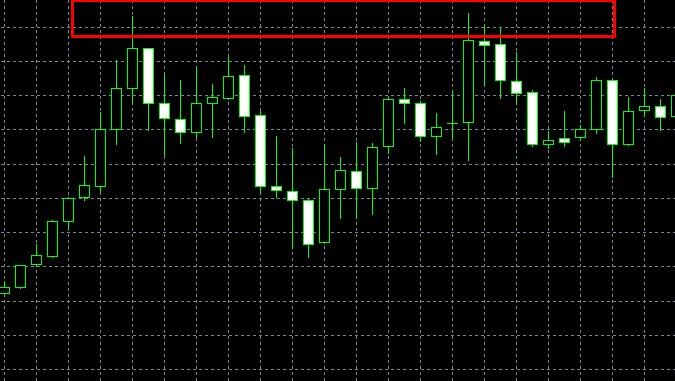
Supply zone
On a chart, these zones are indicated by long shadows. The presence of shadows indicates that one of the parties was pushing the continuation of the trend with bids. However, the volume of response orders was enough for the price to reverse. These zones can be used to set goals for pending orders.
Previous Highs and Lows as Support and Resistance
Horizontal lines are classic support and resistance levels. They are built based on several local extremes: along the boundaries of the body of candles or at the ends of shadows. A line drawn on at least three extremes is considered a strong level. Using a horizontal line, a flat range can be formed to trade inside of it on long timeframes.
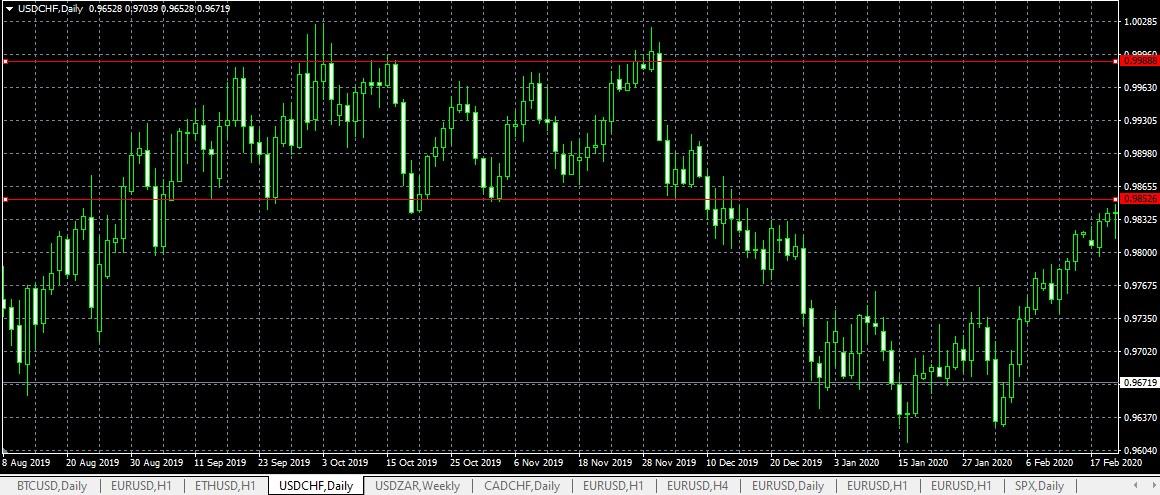
Previous Highs and Lows
Scaling logic is another rule for drawing horizontal lines. If an hourly timeframe is set on the chart, then there is no need to zoom out as much as possible and look for matching extremes. In other words, on a small interval, the extremes should be as close to each other as possible. A one-month gap between extremes is not admissible for a H1 timeframe.
Trendlines in Trading
Trendlines are called dynamic levels. They are ascending / descending and determine the direction of the trend.
Rules for drawing trendlines:
A level is drawn by at least two, ideally three, strong extremes.
Bullish trendline is drawn on minimums, bearish – extremes.
The line is drawn by candle bodies or by shadows. Preference is given to the first option. It is undesirable to build on candles and shadows at the same time if there are long shadows.
The closer the extremes the line is drawn on to each other the better.
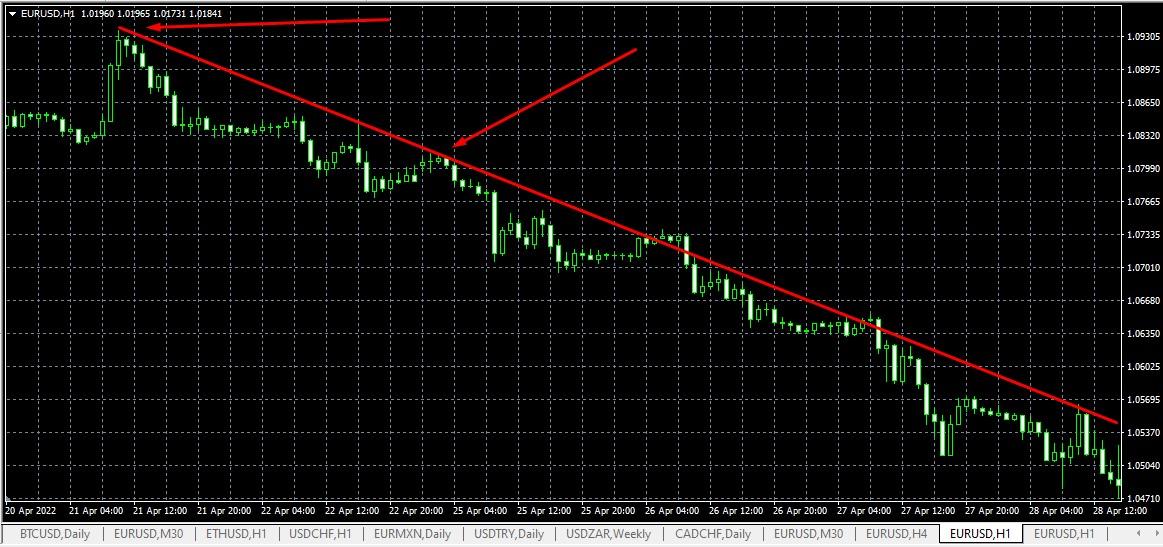
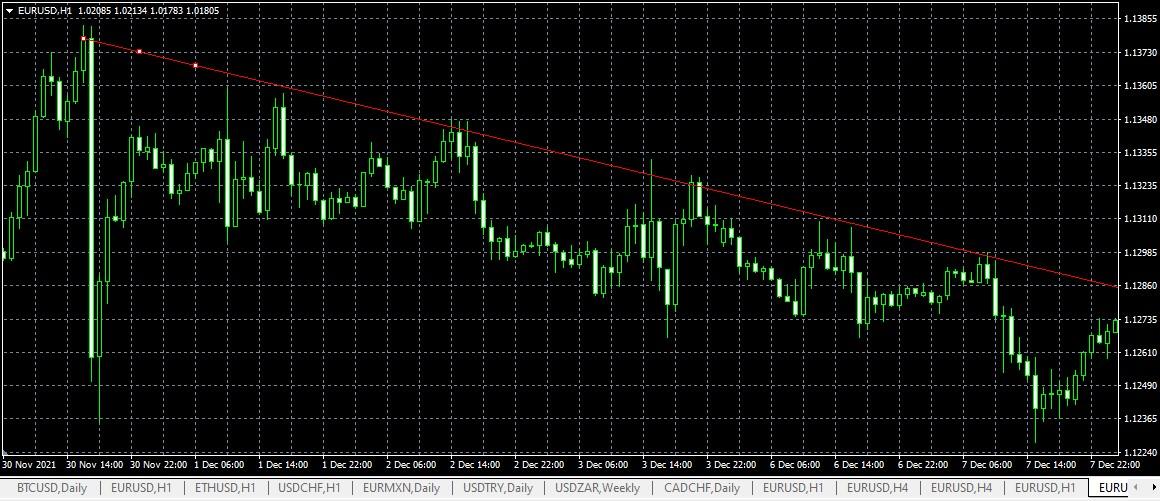
Trendline
This bearish trend is built on two clear extremes. The next three extremes support the correctness of the line drawing.
Examples of trendline signals:
Breakout with a change of direction. The signal indicates a change in the direction of the trend. It is accompanied by a reverse pattern: Pin Bar, double top or bottom. Confirmation signal is a situation where a resistance trendline turns into a support level, or vice versa.
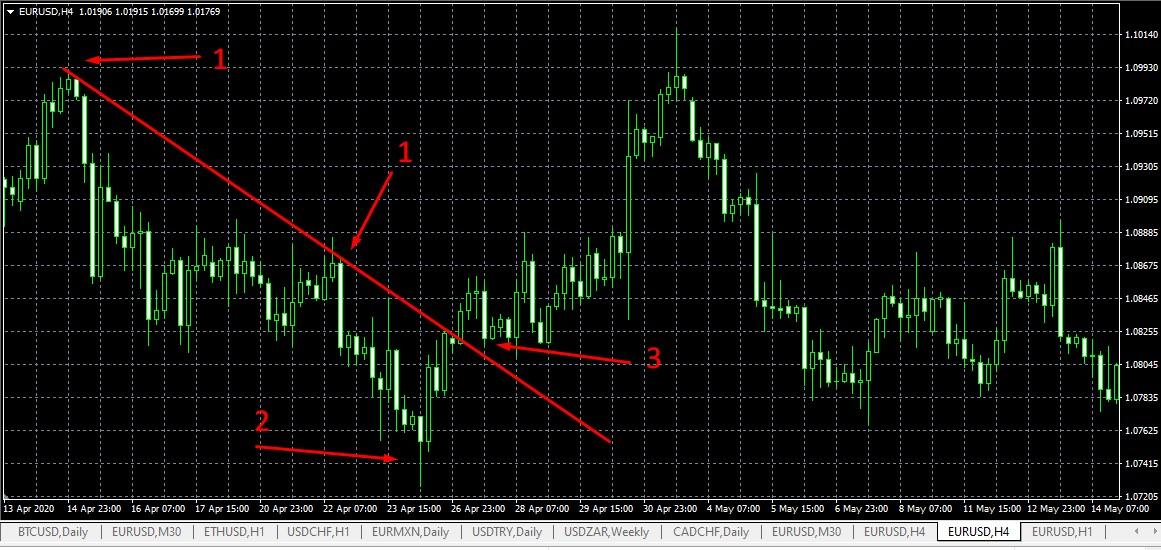
Breakout with a change of direction
A downward trendline is built on points “1”. Next, reverse pattern “2” appears; at point “3” there is a final jump from the trendline up, showing that the trend direction has changed.
Sudden departure from the trendline towards the trend. It is characterized by an abnormally large candle caused by fundamental factors. A position is opened at reversal with a Take Profit order on the trendline.
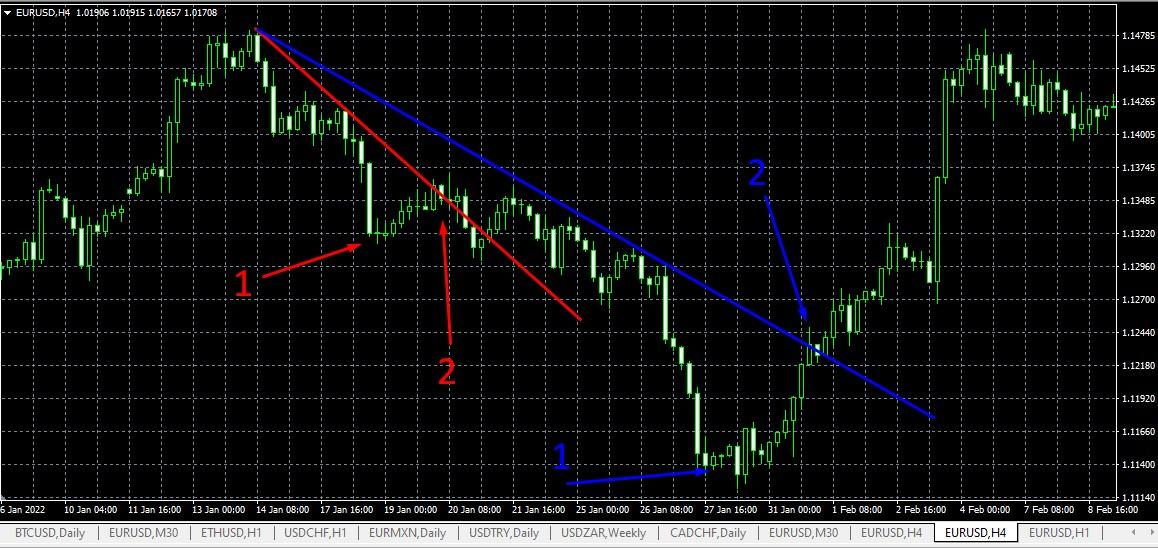
Sudden departure from the trendline towards the trend
The screen shows two similar situations: for short and long-term trends on a H4 timeframe. In the first case, there is one abnormal bearish candle, and in the second case – there are several of them. The more there are, the stronger the reverse movement. In both cases, a long position is opened in point “1” on bearish candles with a Take Profit order in point “2”.
Also, using dynamic levels, you can build ascending channels, the breakout of which indicates a fundamental change in the market situation.
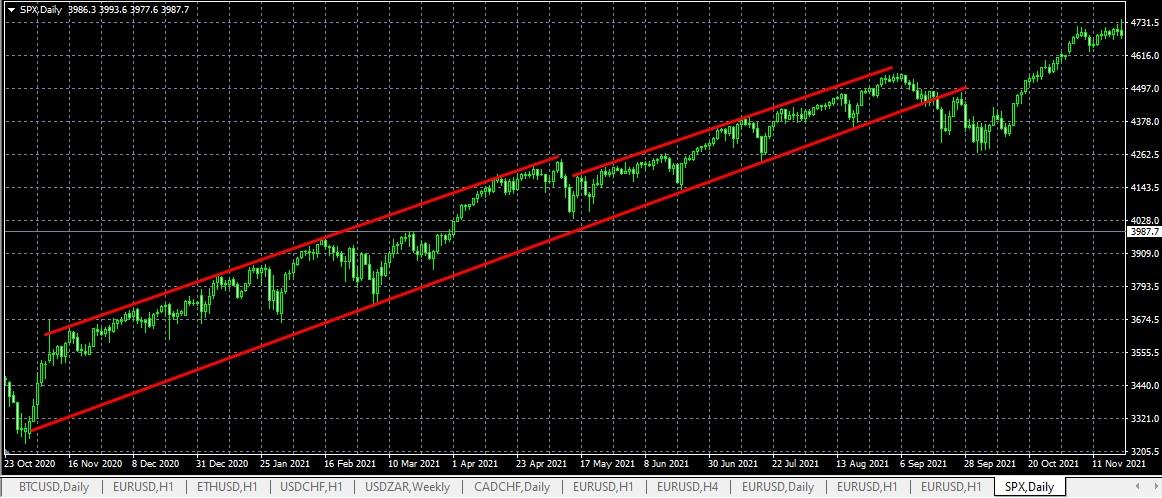
Dynamic levels
Fibonacci Retracement
Fibonacci numbers are one of the most popular tools for drawing levels. They are based on human psychology. On the MT4 platform, there is a separate set of tools that can be found in the menu “Insert/Fibonacci”: lines, arcs, fan, arcs, extension. Lines are the simplest and most frequently used option in strategies for beginners. The indicator represents horizontal lines located at a fixed distance from each other, taking into account the Golden Ratio. They act as key levels.
Example:
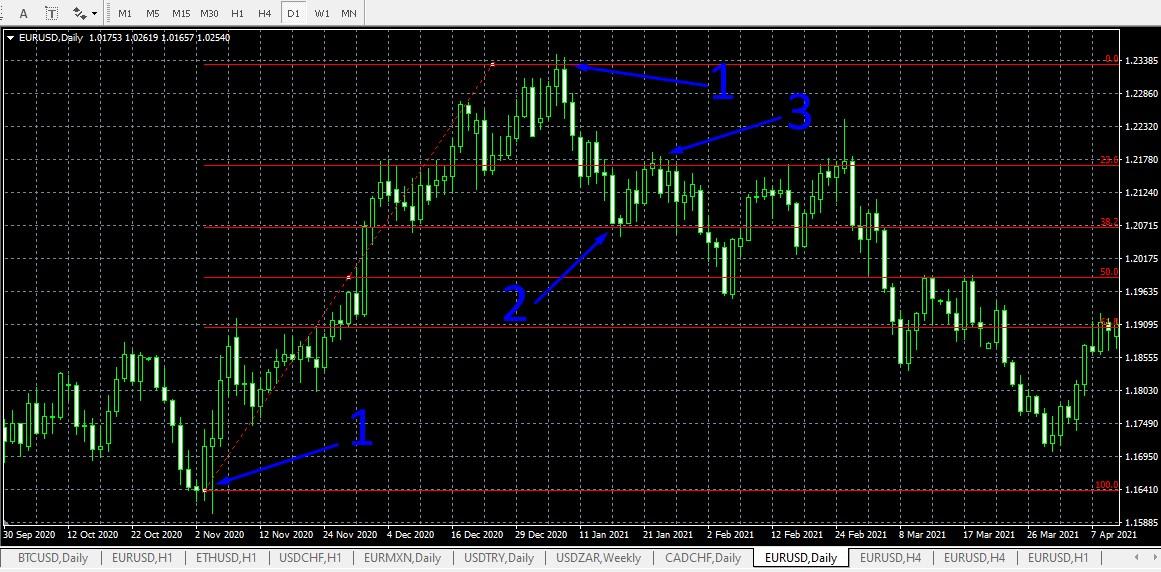
Fibonacci Retracement
The Fibonacci grid is built on trend extremes immediately after the start of correction – on points “1”. In this case, the reverse happened at the level of 38.2% - at point “2”. Since a long D1 interval is set, it is better to place Take Profit with minimal risk at the nearest Fibonacci level – at point "3"
Had the trend continued, and the price returned to level 0% and went up, the grid would have to be stretched to a new extreme at the next correction. In this case, the price kept moving between various levels for some time with their small breakout, and then it bounced off the 50% level and went down.
Round numbers
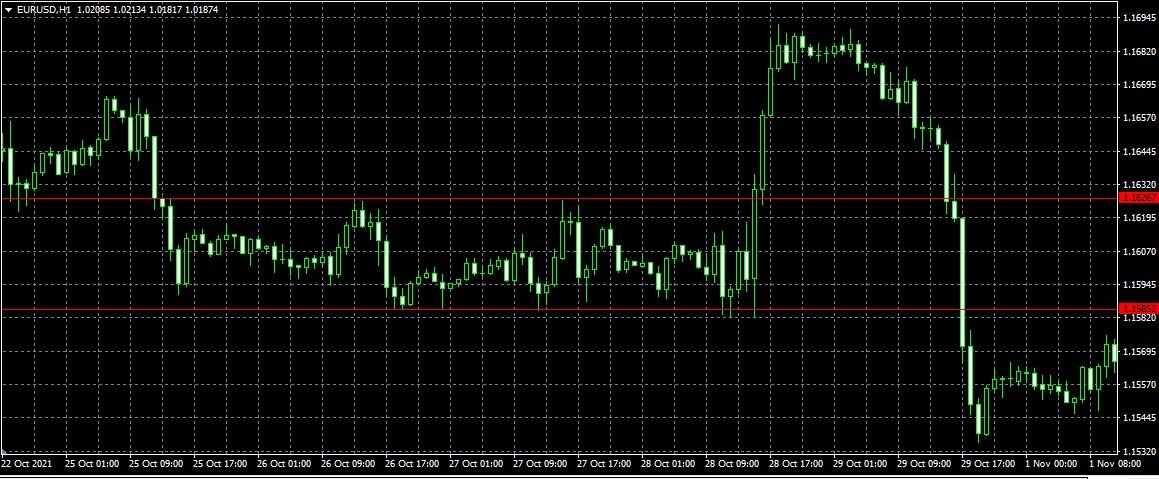
Round numbers are another version of common support and resistance levels that are based purely on psychology. Novice traders don’t know technical analysis well enough to correctly pinpoint the reversal points. Therefore, it is psychologically easier for them to place Stop or Take Profit orders on a round number, for example 1.1500 for EUR/USD. These levels can be clearly seen on highly volatile assets, for example cryptocurrencies.
The property of round levels is that the price does not bounce off them as in other situations, but moves within a horizontal range using the round number as a median. This is also explained by psychology. Traders use other levels to implement “trade flip” or “breakout trading” strategies, while round numbers are used as a reason to exit the market and observe the situation.
Example:
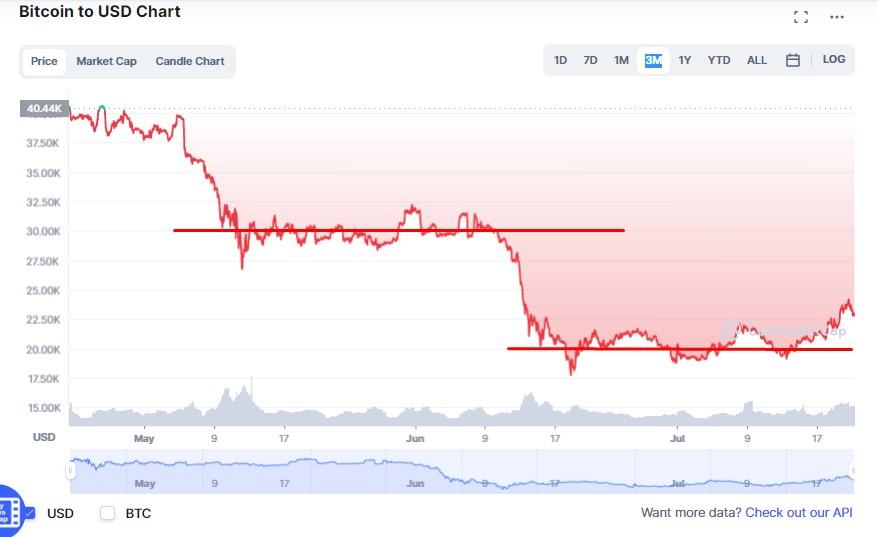
Round numbers
The example of BTC clearly shows the “round number psychology”. After staying for a bit at 40K, the price suddenly dropped, breaking out the round number of 30K. But then, it returned and moved horizontally for some time. If you zoom in and switch to a one-hour chart, you will be able to see clear extremes forming a range of movement with a median of 30K. Then the situation repeats itself: a sharp dip down and a horizontal movement with a median level of 20K.
NOTE! A round number does not mean that the price will reverse exactly at 30K or 20K. This is a horizontal line that the price breaks, but then returns, and where the price moves for some period of time.
Support and Resistance Indicators
There is a certain subjectivity in visual determination of levels. What extremes are indeed the most important? What lines should be used to draw support and resistance lines? Because of these inaccuracies, traders receive inaccurate signals. That’s where indicators come to the rescue. They are different depending on the type of levels that are being built, for example indicators that build flexible channels, or arrow indicators that show key extremes on a chart. Let’s review some of them briefly.
Support and Resistance Indicator For MT4Moving Averages
This is probably the most popular support and resistance indicator used both as an independent tool and as a basis for other indicators. Simple moving average (SMA) is an arithmetic price average for the period specified in settings. The price type (closing, opening, etc.) is also specified in settings. Other types of averages use different calculation formulas and approach to weighing later time intervals. The main signal is when the price crosses a MA. From bottom to top indicates an upward trend, and from top to bottom – a downtrend. There are also false signals, which you need to filter using other instruments.
What is a Moving Average (MA)? How Does it Work?Envelopes (you can give other examples)
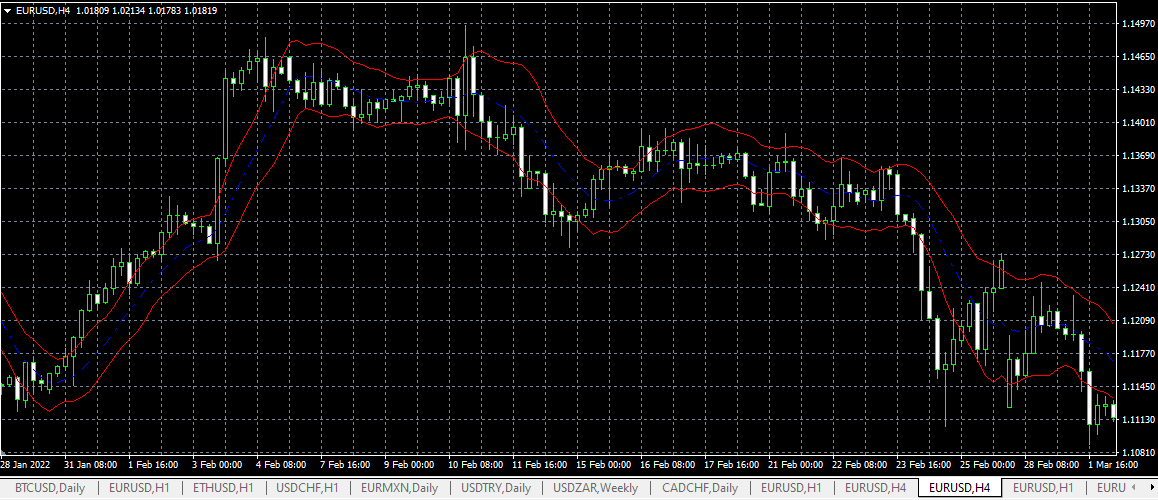
Moving average envelope is a variation of a channel indicator based on MA. The indicators form a channel, where the price stays most of the time. The channel boundaries can be used as target levels for Stop and Take Profit orders. A trading option is opening a position at the time of a reversal at the channel boundaries.
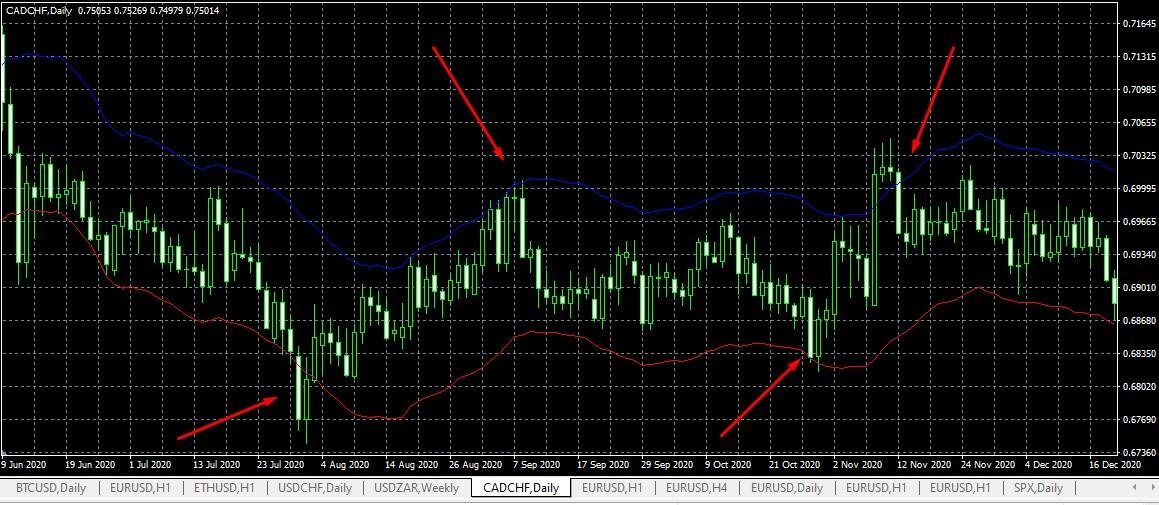
Envelopes
You can see on the screenshot that breakouts and false signals can be observed. However, at least in 4 points the opened positions turned out to be successful. To improve the accuracy of signals, you need to select parameters and timeframes individually for each asset and use additional indicators.
Pivot point
Pivot points are level, where the price is likely to change its direction. The classic calculation uses 6 levels – 3 resistance levels and 3 support levels. The central level is calculated as the arithmetic average of Max, Min, Close prices. Additional levels are calculated as deviations for Pivot values, price difference, etc. Additional levels are calculated as deviations of Pivot values, price difference, etc. You can use the Pivot Point indicator to determine the levels or simply use a calculator.
Since there are no perfect indicators, the calculation method is selected through testing. All types of Pivot points are alternately superimposed on the history of quotes and an analysis is performed for the largest number of matches.
Examples of other level indicators:
True Trendline. This instrument is used to determine strong trends on long-term timeframes. It consists of two main lines and auxiliary levels. A bounce of the price off the trendline towards its direction is considered a signal. Auxiliary levels confirm the direction of movement. The indicator is complex due to the large number of settings.
Murrey lines. Initially the instrument was developed based on the Gann Theory. However, the model of building levels based on statistics turned out to be too complicated for understanding. The Murrey line indicator makes the Gann Theory simpler. It builds the main and auxiliary squares based on mathematical coefficients and fractals. It is used only on long-term intervals, where the cyclicity of the chart is visible.
Rabbit and Rabbit TT.
Major and Minor Support and Resistance
There are major and minor support and resistance levels. The higher the probability of a signal appearing on the level, the higher its significance.
How to determine major levels:
By timeframes. The levels of daily and weekly timeframes are considered more significant, as they don’t take into account the speculative transactions of market makers on short-term periods.
By matching levels. The level on a smaller timeframe is strong if at least one of its extremes coincides with an extreme on a longer timeframe.
By the reason for appearance. The level is strong, if the reason for extremes is clear, for example a fundamental factor.
By changing the scale of the chart. The smaller the scale of level building, the stronger they are.
For intraday trading, the opening and closing levels of the day are considered strong.
Example:
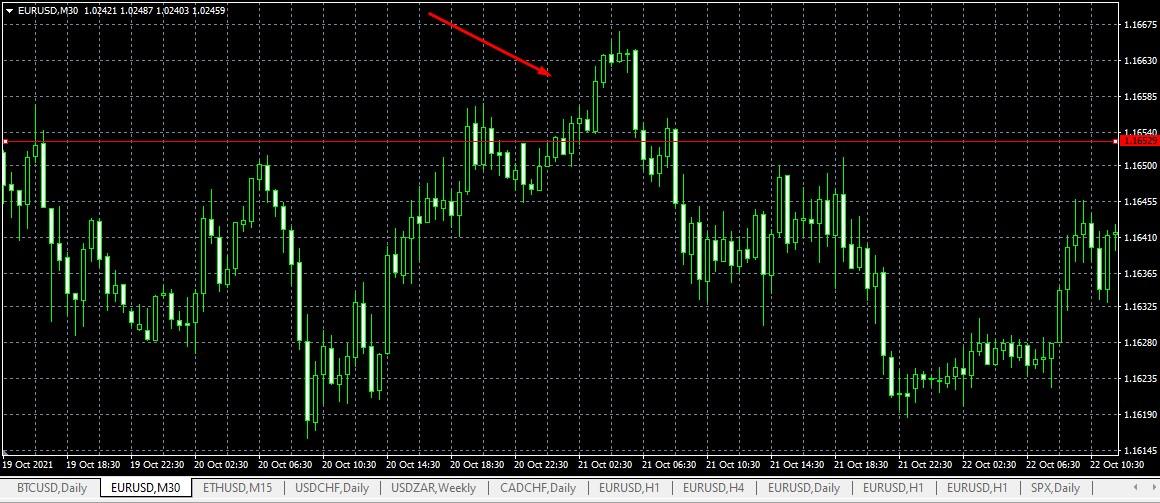
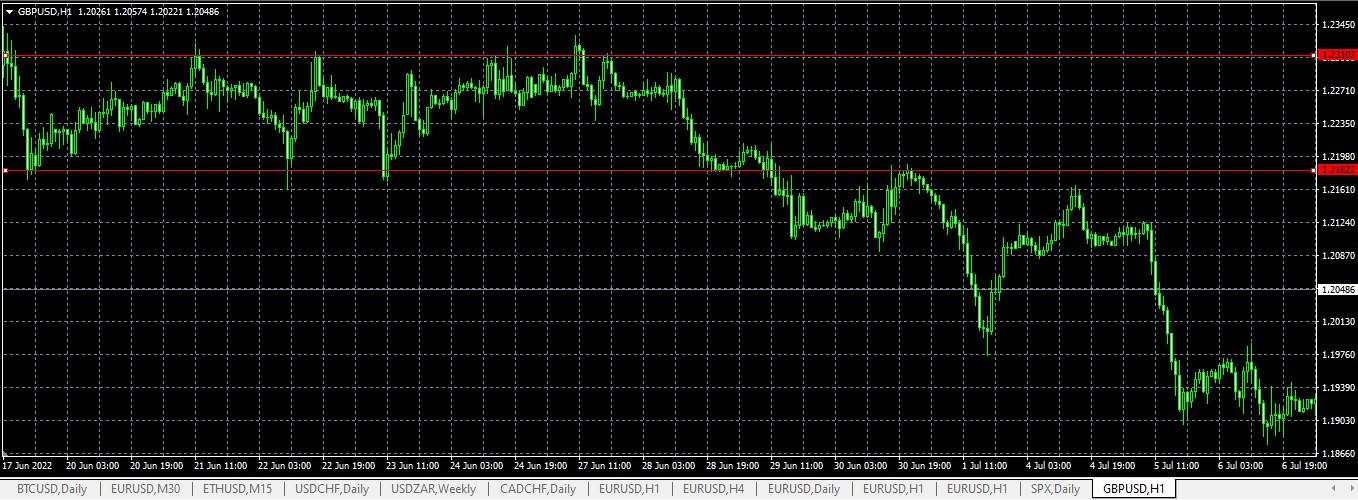
The opening and closing levels of the day
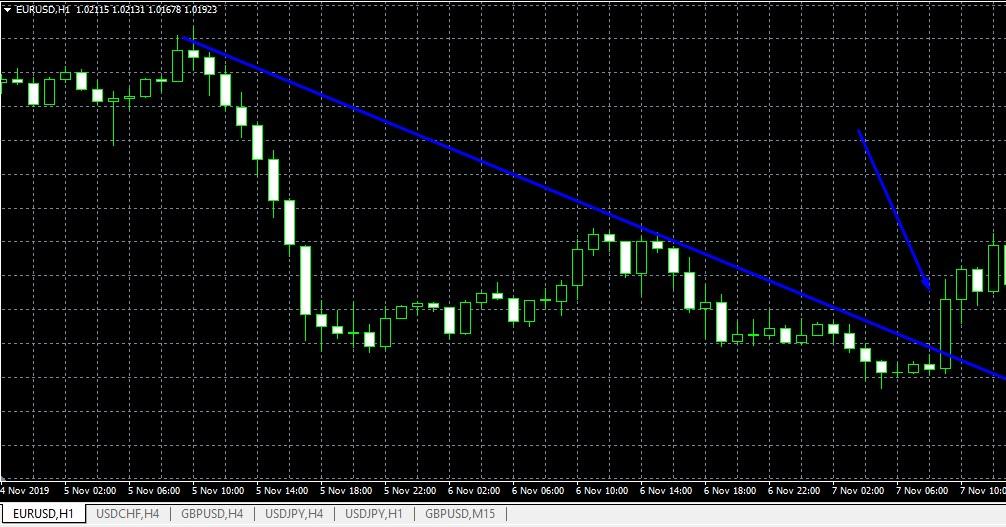
On the H1 timeframe of EUR/USD pair, the trend line is drawn on the two extremes on a large scale. Its breakout upward with a candle of a relatively large body means the start of a strong upward movement. In order to set the Take Profit, you need to scale down and search for a strong resistance level.
An example of using a trend line
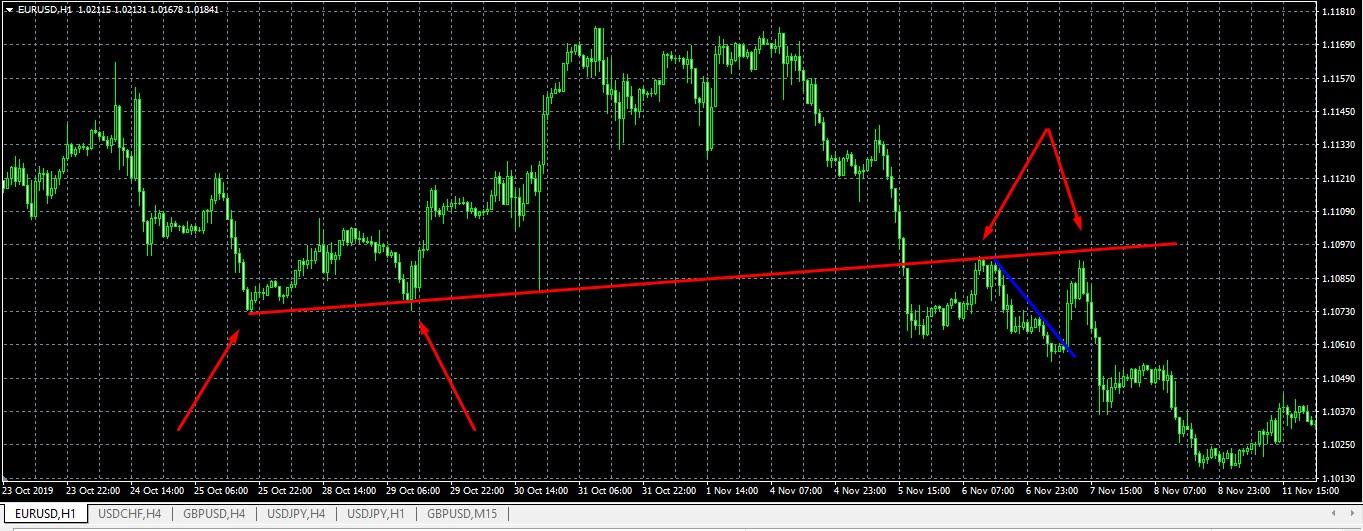
The support level is drawn on the first two extremes (the long down shadow supports it). For the previous upward movement, it serves as a strong resistance level, which the price does not completely reach, returning to the downward movement. Therefore, the smaller the scale of the chart, the stronger the levels you can find and catch a lengthier price movement.
How to Trade Support and Resistance
Not all support and resistance levels are strong. The “strength” of the level means the accuracy of its signal: breakout means continuation of a strong trend and reversal indicates a new reverse movement. The so-called false breakouts are often observed in the market. In order to rule them out, follow these recommendations.
Step 1. Look at Time Frame
Look for extremes on daily and longer timeframes. If they coincide with extremes on smaller intervals at least partially, they can be considered strong. Market makers often operate on the M5-M15 intervals. You can determine the approximate zone of accumulation of stop orders based on the Market Depth and the logic of private traders. Market makers pull the price up to the desired zone with large bids, triggering stop orders and getting an asset at the best price.
Step 2. Consider Number of Touches
The more there are accurate level touches the better. Note that a level should be built based on accurate touches without “pulling of the desired to the actual situation”.
Example of a wrong level building:
Example of a wrong level building
The attempt to build a resistance level here turned out to be unsuccessful. The mistake is that there is no second extreme on the line of the first one on the chart. After touching the line, the price first does not reach the resistance and then breaks it out with a strong upward candle. The second breakout seems to denote a continuation of an upward trend: the price breaks the level and pushes away from it with a candle with a big body. The breakout, however, turns out to be false, because there is no clear resistance level on the chart and the price can stop at any place in the supply zone.
Example of correct level building:
Example of correct level building
If you zoom out the chart you can clearly see an almost ideal flat channel, where the support is built on 4 points, slightly going beyond the level at the 3rd low. Its breakout and then transformation from support into resistance indicates the beginning of a downward trend.
Step 3. Look at Confirmation by different sources
Combine several instruments. For example, coincidence of signals on horizontal levels and trendlines indicates a strong signal. Watch for patterns. Open trades at the moment of exit from the flat range or at the moment of trend change.
Best Trading Platforms
In this section, we will provide a short review of platforms that offer the best instruments for trading using all types of analysis, including chart analysis. They have several common features:
Reliability tested by time. These platforms are available practically in all countries around the world.
Universality. Their instruments are suitable both for active traders and long-term investors.
Security. Oversight by regulatory authorities and external audit means total protection of investor interests.
We recommend these trading platforms for novice traders and investors!
eToro – Best for Free US Stocks Trading

eToro is a broker developing two areas at once. It is one of few brokers that combines instruments for trading CFDs and opens access to the real stock market. It is also the largest social trading platform in the world that allows you to earn passive income by copying signals, or earn a commission for providing signals to other investors.
Benefits of the broker:
License of one of the most reputable regulators in the world – FCA (UK).
Zero fees on a number of stock assets. Narrow spread on CFD assets (easy to check using a script for MT4).
A unique model of rating traders (signal providers) that allows investors to assess the risks.
The broker supports all types of technical analysis and trading strategies, including scalping and hedging.
Binance – Best for Crypto Trading

Binance is a centralized cryptocurrency exchange that is the largest in the world in terms of daily trading volume, coin listing, functionality and structure of the ecosystem. The Binance ecosystem includes a cryptocurrency exchange, a P2P platform for direct exchange of cryptocurrencies among private traders from anywhere, a platform for launching tokens, blockchain project incubator, etc.
Benefits of Binance for traders and investors:
A fully functional platform for active trading. There are over 600 cryptocurrencies listed at the exchange. Binance offers analytical instruments, chart analysis tools and many other features.
Low fees. Transaction fee at less than 0.1% with an average market fee at 0.2%.
Instruments for passive investing: staking, interest on deposits, NFTs, instant lending. There are over 10 instruments that allow you to earn a profit on any altcoin and token at up to 100 APY.
Binance offers some of the best conditions for implementing any trading strategy. The platform offers step-by-step instructions for novice traders with descriptions of everything from registration to managing wallets and using features of your Personal Account. Professional traders have access to technical and analytical instruments for specific strategies: scalping, arbitration, etc.
Summary
Support and resistance levels are an instrument of chart analysis that allows for predicting the most likely price reversal points, building trading ranges, finding zones of stable trend movement or a flat. The levels combine well with patterns and confirming indicators of technical analysis. Once you learn the principles of applying the levels, you will be able to not only improve your trading strategy, but also understand the market better and evaluate its prospects.
FAQs
How accurate are the signals of support and resistance levels?
No indicator, including chart analysis tools, provides a signal with 100% accuracy. There are inertial movements, price noise, actions of market makers in the market. A visible level increases the probability of a price reversal happening near its area. However, accurate and false breakouts, early reversal before the level line, and other situations cannot be ruled out.
What are the tools for determining levels?
Possible options:
Drawing of levels “by eye” based on visible extremes.
Using indicators, for example ZigZag, Rabbit и Rabbit TT, Trend Arrows, Trendline, etc.
Using the figures of chart analysis, such as flag, pennant, parallelogram, etc.
Pivot points, the reverse levels calculated mathematically.
Another option is psychological levels, where traders are likely to set pending orders.
What are the strategies for trading using support and resistance levels?
Strategy options:
Opening a position at the moment when the price bounces off the level of resistance, support or trend line.
Opening a position in the direction of breakout of the level with an expected movement towards the next level.
Swing trading based on Fibonacci levels. Opening a position at the bottom of the correction indicated by the Fibo level.
Trading inside the range indicated by horizontal and dynamic levels.
Trend trading. Opening a position at the start of a new trend indicated as a level breakout after a flat.
The levels can serve as a key instrument of a trading strategy combined with patterns. Also, they can be used as a support tool that confirms the signals or an analysis instrument.
How to set pending orders based on support and resistance levels?
Stop Loss is set several points further from the level, while Take Profit is set several points before the level. For example, for an upward trend, a Take Profit order is set slightly below the resistance level, and Stop Loss – a bit lower than Support level.
Glossary for novice traders
-
1
Cryptocurrency
Cryptocurrency is a type of digital or virtual currency that relies on cryptography for security. Unlike traditional currencies issued by governments (fiat currencies), cryptocurrencies operate on decentralized networks, typically based on blockchain technology.
-
2
Forex indicators
Forex indicators are tools used by traders to analyze market data, often based on technical and/or fundamental factors, to make informed trading decisions.
-
3
Day trading
Day trading involves buying and selling financial assets within the same trading day, with the goal of profiting from short-term price fluctuations, and positions are typically not held overnight.
-
4
Supply and Demand Zones
In trading, a supply and demand zone refers to specific price levels on a chart where there is an imbalance between buyers (demand) and sellers (supply). A demand zone represents a price area where buying interest is strong, potentially leading to price increases, while a supply zone indicates an area where selling interest is significant, possibly resulting in price declines.
-
5
Private Trader
A private trader is an individual who doesn’t represent any institution and trades using their own capital.
Related Articles


Team that worked on the article

Andrey Mastykin is an experienced author, editor, and content strategist who has been with Traders Union since 2020. As an editor, he is meticulous about fact-checking and ensuring the accuracy of all information published on the Traders Union platform. Andrey focuses on educating readers about the potential rewards and risks involved in trading financial markets.
He firmly believes that passive investing is a more suitable strategy for most individuals. Andrey's conservative approach and focus on risk management resonate with many readers, making him a trusted source of financial information.
Also, Andrey is a member of the National Union of Journalists of Ukraine (membership card No. 4574, international certificate UKR4492).

Olga Shendetskaya has been a part of the Traders Union team as an author, editor and proofreader since 2017. Since 2020, Shendetskaya has been the assistant chief editor of the website of Traders Union, an international association of traders. She has over 10 years of experience of working with economic and financial texts. In the period of 2017-2020, Olga has worked as a journalist and editor of laftNews news agency, economic and financial news sections. At the moment, Olga is a part of the team of top industry experts involved in creation of educational articles in finance and investment, overseeing their writing and publication on the Traders Union website.
