In finance, volatility refers to the degree of variation in an asset's price over time. It helps investors and traders assess how much and how quickly prices may fluctuate within a given period. Market volatility is one of the most important factors to consider when trading or investing, as it can influence both potential returns and the level of risk associated with a particular asset.
Understanding volatility is essential for developing an effective investment strategy and managing risk. This article explains what volatility is, why it matters, and how it is calculated.
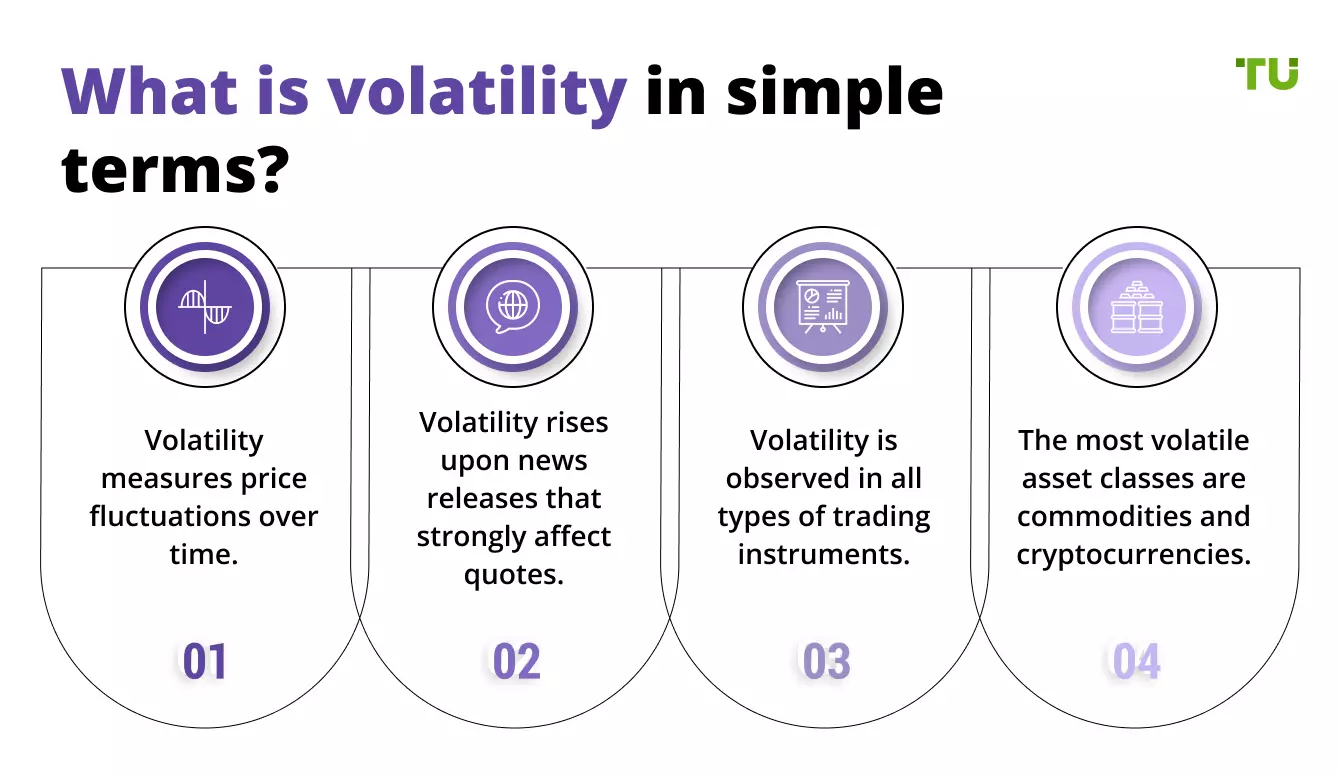
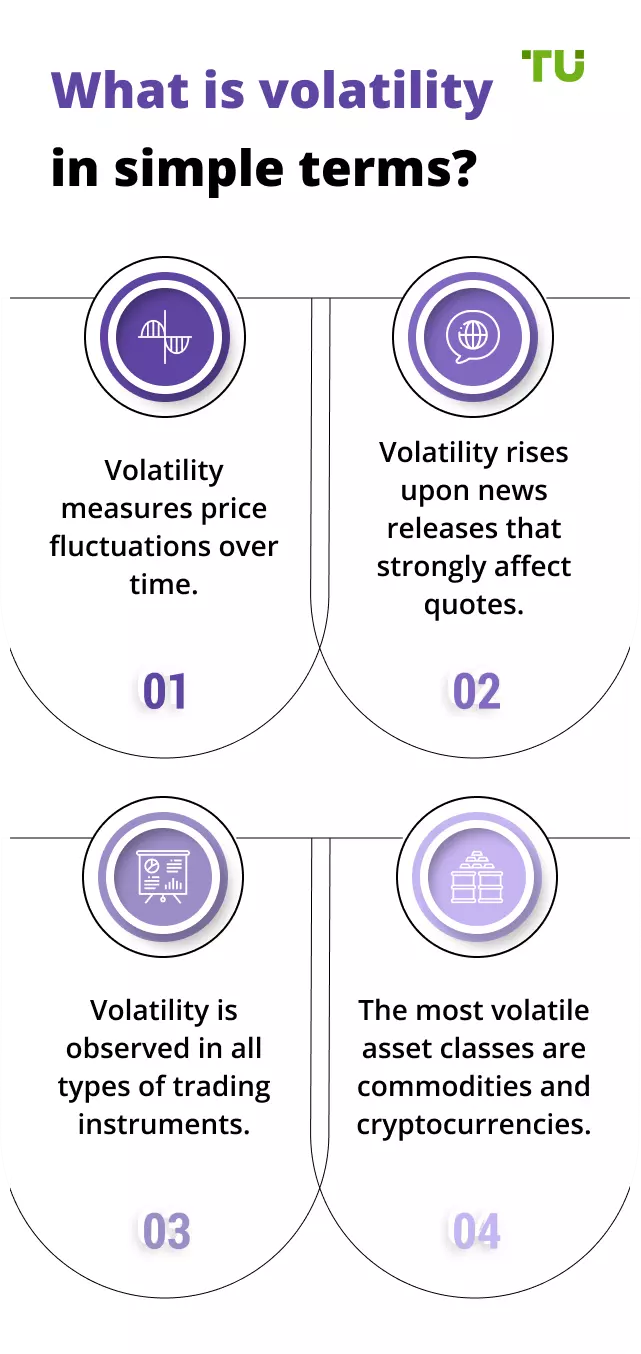
What Is Volatility? Definition
Volatility is defined as the dispersion measurement around the mean or average return of a particular security. In simple words, it's a speed at which the price of certain security changes or a rate at which the security price decreases or increases within a short period of time. Generally, the higher the volatility, the higher the price fluctuation and the associated risk. On the other hand, securities with low volatility don't change their prices frequently. For example, the stock volatility will be high, and the market will be called volatile if it falls and rises over 1 percent within a sustained time period. Volatility is calculated by measuring the standard deviation caused in the market’s yearly returns in a specified time. The measure of volatility indicates the rate at which the security or market price will decrease or increase. Learn about tools for determining volatility in Forex in the Traders Union article.
Why Does Market Volatility Matter?
For example, if the volatility index is lower, then you'll need to wait for a little longer to have profitable trades. On the other hand, if the market is highly volatile, then you'll have more opportunities to earn profit. But at the same time, it's important to bear in mind that the risk will also be higher in high volatility conditions. Therefore, it's safe to say that the market risk and earning opportunities depend on the market volatility.
The Opportunities of Volatility
A market that is highly volatile brings many opportunities for investors and traders. For example, instruments with high volatility tend to be under or overpriced. Another important factor in why market volatility matters is that you can better understand the historical, current, and future market states. For example, the price of a new asset or instrument is usually more volatile right after its introduction to the market. Later on, the fluctuations in price typically become less frequent as the market starts to mature. Being an investor, you can focus on such assets to earn more profit in such conditions.
The concept of volatility allows you to understand the stability of the market against the asset under consideration. It also helps you to determine the risk level of the asset that you want to trade. This way, not only does it help you to build a more diverse and suitable portfolio, but it also allows you to achieve your financial objectives and growth goals in the shortest possible time.
The Risks of Volatility
Stocks and instruments with high volatility are considered to be riskier. For example, if you invest in a highly volatile stock and the price movement goes in an unfavorable direction, then you'll lose your investment.
Bear in mind that some instruments are more volatile as compared to others by default, and their price changes more frequently even after the market gets mature.
How to Calculate Volatility
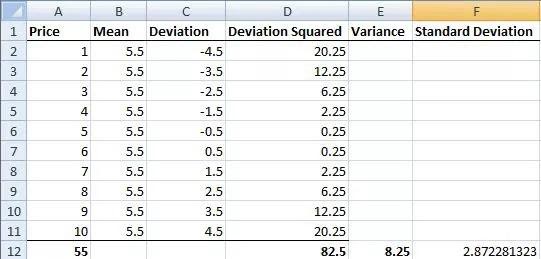
There are multiple ways to calculate volatility, but most commonly, it's calculated by using standard division and variance. In order to understand the concept of volatility, let's take an example. Let's suppose the monthly closing price of a stock is 1 US dollar in the first month, 2 US dollars in the second month, and so on up to 10 months. Remember that standard deviation is calculated by taking the variance square root. So, you’ll need to follow the following steps to calculate volatility.
First, we’ll calculate the mean of the assumed data set that we have by using the means formula, which will be:
(1+2+3+4+5+6+7+8+9+10)/10 = 5.5
In order to calculate the deviation, you’ll need to subtract the calculated mean value from each data value.
Now in order to calculate the variance, you’ll need to divide the sum of the squared deviations by the data value number.
Variance = 82.5/10 = 8.25
At this step, the only thing that’s left to calculate is standard deviation which is, as mentioned earlier, calculated by taking the variance's square root.
Standard deviation = square root of (8.25) = 2.87
This value provides you with an idea about risk and the possible extent of price deviation from the mean or average.
How to Calculate Volatility
There are several indicators that investors and traders use to calculate volatility. The following are some of the most common ones, and you can use any of these according to your current situation and requirements.
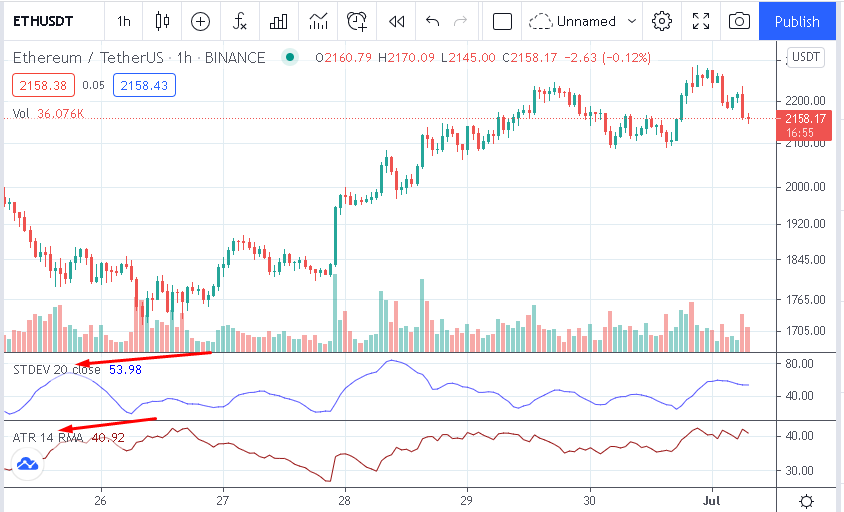
Standard Deviation
The most common indicator used by analysts and traders as a measure of volatility is the standard deviation. It shows the stock price average that deviated from the means with time. You can calculate it by establishing a certain period of time and the mean price of the security within that period. Then you’ll need to subtract the calculated value from every price and add them up after squaring each answer. Next, taking the average of all the values will give you the variance. It’s important to note that the variance that you calculate can be used because it won’t be an original measure unit. Therefore, you’ll need to calculate the standard deviation by square rooting the variance value.
In order to analyze and examine the standard deviation, investors use another indicator known as Bollinger Bands. This indicator is also discussed below, but the point here to note is that the width of this indicator shows the standard deviation. It means, the more the width of Bollinger Bands, the more volatile the security will be.
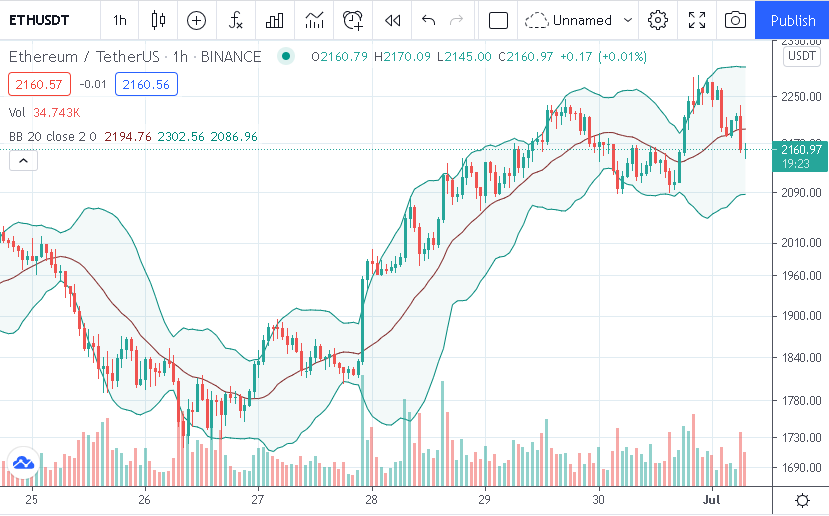
Bollinger Bands
Bollinger bands, as mentioned, are another common indicator used by chartists and analysts to calculate volatility. It basically uses the current market price of a security and builds a price channel around it. In order to determine the next possible price movement, you’ll need to observe the price channel in relation to the current market price. The price channel that Bollinger Bands create consists of three different lines.
The middle line is known as the moving average, and its typical value is 20 periods. However, you can also use any other value if desired, but "20" works the best for most investors. If the market is below the middle moving average line, then it's considered the resistance line or the upper line. On the other hand, if the market is above the moving average line, then it's considered a support line or the lower line.
Bollinger bands
ATR (Average True Range)
ATR or the Average True Range is known to be the most accurate indicator. It allows you to understand the past behavior of the security and how far the average period has moved. The biggest benefit of using ATR is that not only does it recognize the gaps that other momentum indicators ignore, but it also incorporates them into the calculations.
Average True Range measures the true range of each period and provides you with the moving range, which is extremely smoothed. You can analyze the results to find out the true average range of all the past periods.
For instance, if the Average True Range value is 0.2, then it’ll indicate that an average period in the past has 0.2 US dollars. You can also use this value to calculate (predict) the movement range of the future market. So, the key points are:
If the value of ATR against particular security has dropped from 0.2 to 0.1 US dollar, it simply means that the market is going down.
If the value has increased from 0.2 US dollars to 0.3 or more, then you can understand that the market is going up.
The market can go in either direction, and you need to change your trading strategy accordingly. ATR allows you to achieve that most efficiently and effectively.
Standard Deviation and ATR Indicators
Volatile Asset Example
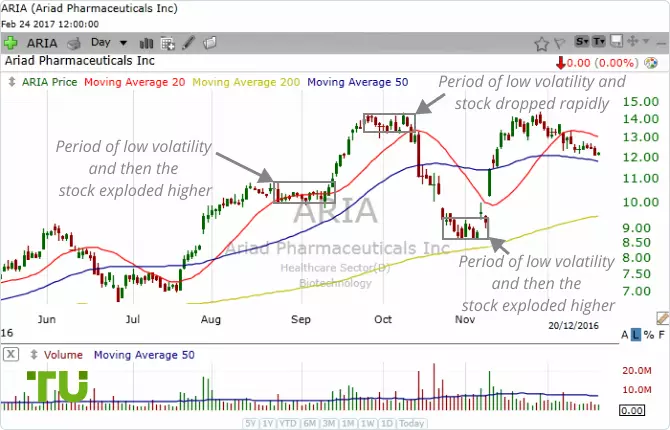
Volatility provides you with opportunities to make money by trading in a short period of time. Let's take an example of ARIA, which is shown in the image below.
Volatile Asset Example
In the image above, you can see that the market is going towards high volatility from low volatility. From the period of late August to the start of September, the stock showed very little volatility as it moved sideways in that period. Then the stock all of a sudden broke above the range and attracted more investors to further increase the volatility.
Being a smart trader, you already had put alerts in place and bought the stocks right at the moment when it broke out. At the start of October, the stock reached its highest value, as the chart shows, and again started trading sideways (decrease in volatility). Then in the mid of October, the ARIA stock broke down, and the volatility of the market again increased dramatically but in the opposite direction. In early November, you can again see the same behavior. In simple words, the ARIA stock offered a very good opportunity a couple of times to earn profit within a short period for smart traders.
Factors Influencing Market Volatility
There are multiple factors, such as trade order imbalance in a single direction, that influence the market volatility. The following are some of the most common reasons that cause market volatility.
Economic Crisis
One of the most influential factors that affect the financial market is the current economic situation. The market volatility and economic crisis are inversely proportional. It means that the worse the economic crisis, the more volatile the market will be.
National Economic Policy Change
The change in your national economic policy affects the market you’re trading in. For example, the abrupt change in Federal Reserve System policy, even in the short term, can cause big market movement. When the monetary policies are eased, the market mostly goes up and vice versa.
Volatility Overseas
As you'd already know that we live in a global village, which means that the economy now is connected globally. So, the big events such as revolutions, regime changes, wars, etcetera in the global financial sector can also affect your local market.
Public Relations
Another factor that can influence the market volatility that many people usually ignore is public relations. It means that the market volatility also depends upon the perception of the public regarding companies. The public view can alter the performance of any stock.
Economic Indicators
In order to analyze a particular company, most investors use economic indicators. If the company isn't meeting its forecasted obligations and targets, the market reacts negatively, and the opposite is also true. That's why the economic data and reports serve as a window or volatility indicator that greatly affects the traders' decisions.
Political Situations
Politics is yet another critical factor that impacts the performance of financial markets. The government decisions regarding federal spending, tariffs, taxes, and trade agreements play a vital role in causing market volatility.
Skills to Help You Thrive in Volatile Markets
As a trader, you need to have a particular set of skills if you want to thrive in a volatile market. As mentioned earlier, a volatile market comes with a lot of opportunities to earn profit in a short time. But at the same time, it also increases the associated risk. Only the right trading strategy will allow you to manage risk and perform professionally in a volatile market.
Following the Trend
In order to deal with the high-risk factor, the best approach is to look for an asset that has been performing well and trading higher. It’s also critical to ensure that the stock still hasn’t hastened its progress. Moreover, if you want to go short, then you'll need to find a declining stock except for the one that already has experienced a waterfall decline or collapse. In simple words, you need to follow the trend and analyze the market carefully. It’ll allow you to choose the stock or any other security in a volatile market with the capability to make a profit. To know more you can read about swing trading strategies.
Position Sizing
Position Sizing is very important when it comes to trading in a volatile market. It’s a trading term that defines the investment size in your portfolio. In other words, it’s a technique that helps you determine the appropriate amount of funds to allocate per trade. Not only does it allow you to manage risk, but it also helps you to improve your purchasing power. A good approach is to go for smaller positions on highly volatile instruments and take larger positions on securities with lower volatility. Therefore, each position that you'll open will have a similar impact theoretically. It's a pivotal process that allows you to grow your portfolio in the long term.
Cut Your Losses
Cutting or limiting your losses is also very important because it allows you to stay in the market. This concept states that you should exit any open position which is losing or going down before the situation gets even worse. It’s the best way to limit the amount of money that you can lose if the market goes in the opposite direction of your prediction.
Stop Overtrading
You can lose all your investment capital because of overtrading, especially in a volatile market. You must have a proper risk management strategy and a well-defined trading plan to avoid overtrading. You can follow the points listed below as well:
There is a distinct line between emotional and rational trading decisions. Every trading decision that you make must be based on a clear market analysis.
It’s important not to put all your eggs in a single basket. It’s advisable to open multiple positions to achieve portfolio diversification.
Never trade any security using the capital that you’re unable to afford. Make sure that you only use what you have in place after carefully identifying the amount of money that you can easily risk.
The Most Volatile Markets Rating
It’s a highly debatable topic that which market for trading is more volatile than others. Some experts suggest that Forex and cryptocurrency are the most volatile markets and others say that the highest volatility level is found in commodities. However, according to the S&P Global research, the following are the most volatile markets with their percentages during the 2010s.
Energy
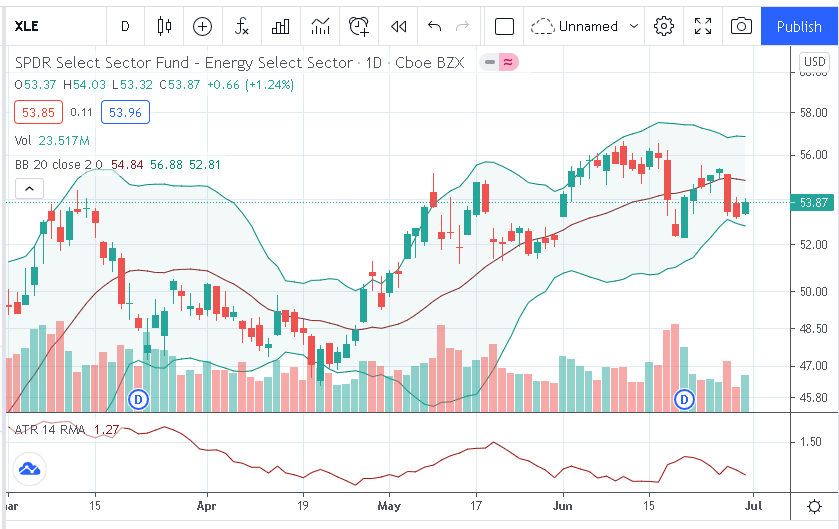
The energy sector includes the industries such as coal, gas, and oil. It also includes technologies of renewable energies such as wind energies, solar, ocean energy, hydroelectric power, hydrogen, geothermal, and biomass. The energy sector showed the highest level of standard deviation that was more than 20 percent which was based on the returns from XLE (Energy Select Sector Index).
XLE Chart with Bollinger Bands and ATR Indicators
Commodities
During the 2010s, the sector with the second-highest volatility was commodities. Its level of standard deviation was 18.6 percent, and this sector includes products such as agricultural goods and precious metals.
Financial
Commodity exchanges, security exchanges, financial planners, credit card issuers, insurance companies, financial services, and brokerages form the financial sector. The standard deviation of this sector was 16.8 percent making it the third-highest.
Technology
Technology was the fourth-highest volatile sector of the 2010s period, with a standard deviation of 14.8 percent. It includes household appliances, televisions, mobile phones, computers, and similar products. It also includes software systems such as logistics software and cloud-based computing systems for companies like Microsoft, Google, Amazon, and Apple.
Utilities
Other than these, S&P Global also mentioned some other sectors such as consumer discretionary, communication services, and healthcare. But one of the most important ones is utilities’ sectors with a standard deviation of 11.8 percent. This sector includes natural gas, dams, electricity, sewage, and water services. Usually, it’s considered to be less volatile and used by long-term investors to achieve overall stability.
Where to Trade
Now that you understand what volatility is and how it can affect your trading experience, it's time to explore the best brokers with Volatility Index (VIX) that you can use for trading. Choosing the right broker involves more than simply finding access to volatility-related instruments. It's also important to evaluate factors such as trading costs, platform features, available markets, and regulatory oversight. To help narrow your search, we've selected several online brokers that offer access to volatility trading, along with competitive trading conditions, robust platforms, and a wide range of analytical tools.
If you want to perform Forex trading, then FxPro is one of the best options available in the market. Not only does this broker offer a low-risk trading environment, but it also offers all the important features and tools that you need to make educated and informed decisions. Moreover, this broker is also fully regulated by renowned financial authorities.
Why is FxPro a Great Option?
Allow you to access Forex and CFD markets
Offers easy and seamless account opening process
Exceptional customer services
Only 100 US dollars is required as a minimum deposit
If you're interested in US stocks, then Webull can be your best option. It’s also a highly regulated and low-cost online trading platform that offers great research and educational material. It’s a great platform for all types of traders and investors interested in stocks, especially beginners.
If you're interested in cryptocurrency, then there's no better option for you than Binance. It's one of the most commonly used crypto exchanges that supports all the major cryptocurrencies. In terms of trade volume, Binance has become the largest and highly reliable crypto exchange in the whole world. Moreover, you can create your account on this platform instantly and start your crypto trading journey seamlessly.
Why is Binance a Great Option?
Supports more than 150 different cryptocurrencies
Available in over 180 countries
Allows you to buy crypto with fiat currency
You can trade crypto 24/7/365
Zero trading fees (Binance P2P)
Offers escrow service for the users’ safety
Summary
Volatility can affect your investments greatly in any direction. If you make wrong decisions at the wrong time, then you can lose all your investment capital within no time. That's why it's one of the critical concepts that every trader must understand comprehensively. We hope that this guide will help you not only to understand what volatility is but also allow you to calculate it to grow your trading account. Make sure that you keep in mind everything that we discussed here to achieve your financial goals in the shortest possible time.
FAQs
Is market volatility bad or good?
In order to make money by trading, there must be a price movement. Because of volatility, the price movement becomes drastic that brings opportunities to make more profit in less time. But at the same time, it also increases the risk factor.
How to effectively deal with market volatility?
The best way to deal with market volatility is to follow the trend and perform position sizing. You would also want to cut your losses and stop overtrading. A detailed trading strategy powered by a risk management strategy will help you to deal with volatility effectively.
How to figure out whether a security is highly volatile or not?
The best way to find out whether a security is highly volatile or not is to look for the security’s previous trading session. You need to find out whether it had big percentage losses or gains.
What is the best volatility indicator?
The best and most accurate volatility indicator is ATR (Average True Range) because it recognizes and incorporates the gaps to calculate the volatility.
Bollinger Bands (BBands) are a technical analysis tool that consists of three lines: a middle moving average and two outer bands that are typically set at a standard deviation away from the moving average. These bands help traders visualize potential price volatility and identify overbought or oversold conditions in the market.
An investor is an individual, who invests money in an asset with the expectation that its value would appreciate in the future. The asset can be anything, including a bond, debenture, mutual fund, equity, gold, silver, exchange-traded funds (ETFs), and real-estate property.
Forex indicators are tools used by traders to analyze market data, often based on technical and/or fundamental factors, to make informed trading decisions.
CFD is a contract between an investor/trader and seller that demonstrates that the trader will need to pay the price difference between the current value of the asset and its value at the time of contract to the seller.
ATR (Average True Range) is a volatility indicator that helps traders assess the potential price range or volatility of a financial instrument. It calculates the average of true price ranges over a specified period, providing insight into the level of price fluctuations within that timeframe.
Bruce Powers is an expert trader and technical analyst with over 20 years of experience in Forex, commodities, ETFs, cryptocurrencies and other assets. He is an active trader, technical and fundamental analyst, media commentator, educator and a writer. As an author for Traders Union, he contributes his deep analytical skills, expertise and understanding of the global economy and financial markets to provide market analysis and insights. Powers is also a frequent guest on business TV news shows.
Dr. BJ Johnson is a PhD in English Language and an editor with over 15 years of experience. He earned his degree in English Language in the U.S and the UK. In 2020, Dr. Johnson joined the Traders Union team. Since then, he has created over 100 exclusive articles and edited over 300 articles of other authors.
Mirjan Hipolito is a journalist and news editor at Traders Union. She is an expert crypto writer with five years of experience in the financial markets. Her specialties are daily market news, price predictions, and Initial Coin Offerings (ICO).