Forex Indicators for Traders - Download for Free


Editorial Note: While we adhere to strict Editorial Integrity, this post may contain references to products from our partners. Here's an explanation for How We Make Money. None of the data and information on this webpage constitutes investment advice according to our Disclaimer.
Popular Forex indicators with free download:
Moving Averages - Common trend-following indicators
Parabolic SAR - Indicates probable trend changes
ADX - Measures strength of trends
Bollinger bands - Widen or narrow with market volatility
Stochastic Oscillator - Compares prices to range over time
If you're a forex trader, then you already know that trading the forex market is a very challenging task. Setting clear trading goals, understanding the forex market, and previous experience are undoubtedly some important factors to help you make informed decisions. But the most important factor that can make or break your entire trading experience is using forex indicators. Not only does using indicators enable you to implement successful forex trading strategies, it also helps you to make profitable returns consistently.
What are Forex Indicators?
Forex indicators are mathematical calculations based on open interest, volume, exchange rate, etcetera, of a certain currency pair. Most of the forex indicators are calculated from the exchange rate of a currency pair. In order to analyze a currency pair, a forex indicator provides you with easy-to-understand graphs, charts, and bars.
Forex indicators are very helpful, but it's imperative that you understand their functionalities and basic principles. Not only do you obtain a detailed and comprehensive picture of the forex market, but the probability of earning more profit also increases. But just like any other trading technique and style, using forex indicators also has some shortcomings. Consider reading the following pros and cons to make the best out of your experience with forex indicators.
- Pros
- Cons
- Ease of use
- Simplify the process and save both energy and time
- Offer clear and concise visuals
- Can be customized for more optimized results
- You can use forex indicators to trade all the currency pairs
- Can be used to create new and useful trading strategies
- Sometimes two or more forex indicators can be contradictory and cause confusion
- Can give lagging or premature indications of future price movement
- Depending solely on indicators can be dangerous
- How do indicators help you trade better?
Many forex traders, even professionals, use trading indicators as an essential part of their technical forex market analysis. It enables them to make far more objective trading decisions. Bear in mind that there are multiple factors that you need to consider when it comes to determining the value of a currency pair. Using forex indicators is a simplified way to analyze different charts that you can opt for. For example, you’ll notice a couple of common market environments while looking at the charts. These environments can be:
- Ranging markets with powerful support and resistance levels
- Trending markets with price steadily moving lower or higher
- The floor or the ceiling where the price is not breaking through
If you perform the technical analysis yourself to recognize trending environments or range-bound markets, you may be able to pinpoint favorable trade entry and exit points with a higher of being right, based on the readings. By using forex indicators, then the process will be as simple as putting the data on a price chart.
- Is it obligatory to use indicators in trading?
Forex indicators have become an important part of forex trading. That's why it's important and useful to utilize the power of forex indicators for improved trading. However, they're not mandatory, and you can perform forex trading without using them, especially if you're using different strategies, such as a price action strategy. But if you're not a seasoned trader, or inexperienced, then it can be very helpful to use forex indicators to identify favorable trade entry or exit points with high probability.
Best Forex Indicators: Free Download
ADX

ATR
Bollinger Bands
EW1
Gentor CCI
MA Channels FIBO
Momentum
Roc
Snake
William New
Alligator
Awesome Oscillator
Bulls Power
Fibo Pivots
Heiken ashi
MACD
Moving Averages
RSI
Stochastic Oscillator
ZigZag
AMA & AMA sig
Bears Power
DeMarker
Fx Analizer
Ichimoku Kinko Hyo
MACDdtLSMA
Multi Symbol
Scalper Signal
Trendband
Parabolic SAR
If you don’t already know, MT4 (MetaTrader 4) is the most widely used online trading platform. Because of its set of tools and user-friendly interface, many traders choose it, especially for forex trading. Below you can find a range of forex indicators available for free for use with the MetaTrader 4 platform. It’s important to note that some of these forex indicators provide users with signals that require individual interpretation.
Where to look for Best Forex Indicators?
When it comes to locating quality Forex indicators, you have some other solid options to choose from beyond the Traders Union website. To start, the two most popular trading platforms, MetaTrader 4 and MetaTrader 5, come with a wide selection of indicators pre-installed - so you have plenty to experiment with right off the bat.
Broker websites are also a good place to search, as many offer additional indicators you can easily download. Just be sure to use a broker you trust.
Forex resource sites are quite useful in this regard too. Personally, I really like Forex Factory - their indicator sections allow you to browse what's available and see reviews from other users on functionality. Some are free while others have a small fee.
Trading communities can often provide great leads. Sites like Forex forums and subreddits often have active threads where experienced traders share indicators they've built themselves or customized over time. Just exercise normal caution with downloads from strangers.
For a set of indicators vetted by industry experts, the official MT4 and MT5 websites host massive libraries of add-ons ready for direct download, compatible straight out of the box. This ensures quality and avoids compatibility issues.
However you proceed, testing multiple options and reading others' experiences will serve you well.
Main Types of Forex Indicators
There are several types of forex indicators. They differ in their principles of operation, as well as in their purpose. As mentioned, these indicators use mathematical formulas. The calculations and algorithms used to create these indicators range from basic algebra concepts to higher mathematics. But the great news about forex indicators is that you don’t need to perform any calculation manually. Here we have mentioned some of the best indicators for forex that you can use regardless of your expertise level. Also we recommend traders to research the best overbought and oversold indicators.
Trend Indicators
Forex trend indicators, as the name suggests, inform you about prevailing market trends. Determining market trends might sound very simple, but there is much more to it.Of course, you can still craft a process to observe and understand trends without using forex indicators.
For example, a couple of higher highs and higher lows can be made a rule for identifying an uptrend. However, it's also possible to say that when the price is above its 100-day average, then there's an uptrend. It's just a matter of your personal preferences.
You can also use indicators to generate trading signals. In order to make indicators more leading instead of lagging, a shorter lookback period can be applied. Although it's very difficult to find the best setting, you can perform a lot of backtesting to get close. Experimenting always brings better results and understanding because sometimes you’ll need to adjust the lookback period, especially if the currency pairs you’re dealing with are more volatile.
Moving Averages
In order to understand the underlying trend or direction of the market, many forex traders use moving averages. There are further subcategories of this indicator type, and you can use one or more to capture trading signals. Here's a list of the four fundamental moving averages' types that are most commonly used in the world of forex trading.
SMA (Simple Moving Averages)
EMA (Exponential Moving Averages)
WMA (Weighted Moving Averages)
SMMA (Smoothed Moving Average)
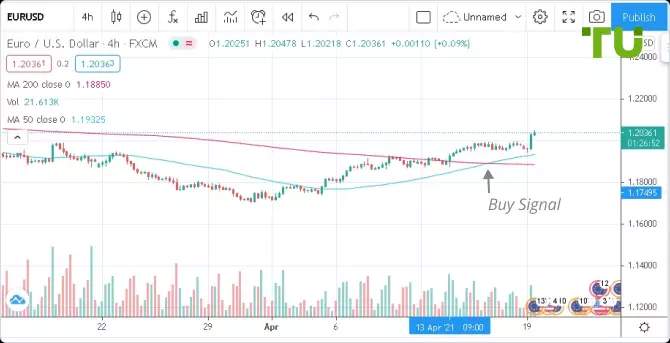
You can apply the averaging process based on low, high, opening, or even closing exchange rates. However, performing an averaging process on the closing exchange rate is the most commonly used one. For example, you can easily calculate the SMA exchange rates over a certain number of time periods. Dividing the sum by the total number of time periods will give you the average. You can use this averaging process to create a line that will indicate the average exchange rate of a specific currency pair. The line (moving average) will tend to send you a bearish signal when it lies above the exchange rate. On the other hand, it’ll be a bullish signal if the moving average lies below the exchange rate.
Parabolic SAR
This is a trend indicator that is widely popular among traders. Its name is an acronym for the phrase “stop-and-reverse” (SAR), and this is the basic principle of its operation. The parabolic SAR is designed to indicate when the trend of a currency pair has a high probability of changing its direction - from an uptrend to a downtrend, or vice versa.

Visually it is displayed as a simple series of points located below or above the price chart.
Parabolic indicator settings are quite simple as well. You must remember that there is no such thing as a perfect indicator and it is not infrequent that, under the influence of temporary, misleading market noise, the parabolic SAR, or any other technical indicator,may generate false trading signals.
If the parabolic SAR points are under the current price as shown on a chart, that indicates an uptrend or bullish market condition.
If the SAR’s points are above the current price, that indicates a downtrend or bearish market condition.
The parabolic SAR indicator is excellent for setting stop-orders, either in conjunction with other indicators, or simply by using the parabolic SAR indicator’s signal alone as the condition for closing or opening trades.
The ADX
The Average Directional Movement Index (the ADX) is an indicator that helps to determine if there is an existing, significant trend in a, and also give an indication of the strength of a trend.
The ADX Indicator consists of three lines: -DI, +DI, and the ADX. The -DI and +DI are called smoothed directional lines, and the ADX stands for the “Average Directional Indicator”.
When there’s an uptrend, the distance between the -DI and the +DI lines is increasing and the ADX is rising. Conversely: the ADX is falling when the market reverses to the downside or becomes a ranging, trendless market.

Trading with the ADX indicator:
That is the situation when the ADX is higher than the other two lines or interacts with them:
If the -DI line is lower than the +DI line, you should buy.
The best buy signal arises when the -DI line is lower than both the +DI and the ADX lines, provided that the ADX is rising.
If the +DI line is lower than the -DI line, you should sell.
The best sell signal arises when the +DI line is lower than both the -DI and the ADX lines, provided that the ADX is rising.
This is the situation when the ADX is falling:
When the ADX is falling, it shows that the trend is weakening and that there may soon be a trend reversal or lack of a trend altogether.
This is the situation when the ADX is lower than the other two lines:
If the ADX is lower than the other two lines, it shows that the market is stagnant and has no trend.
This is the situation when the ADX line is lower than the other two lines for a significantly long period of time:
The longer the ADX line remains lower than than the other two lines, the more powerful the next price movement is likely to be.
If the ADX is rising, but is still lower than the other two lines, it shows that the market stagnation is coming to its end. You should buy, if the +DI line is above the -DI line, and sell if the -DI line is above the +DI line.
Bollinger bands
Bollinger bands are statistically determined bands around a short-term moving average. They are created by calculating a simple moving average, and then a standard moving deviation from that average.

Bollinger bands reflect two standard deviations on each side of a moving average. Bollinger’s theory was based on historical price data showing that two standard deviations contain the vast majority of an asset’s price movement. Bollinger bands expand or contract in reaction to market volatility, becoming sensitive to the most recent market price action. The recommended setting for using Bollinger bands is a 20-period moving average, with the envelope formed by two standard deviations from that average.
Bollinger bands are usually used in conjunction with other technical researches to determine a trend reversal on the securities market. If the prices are close to the lower bound and another research confirms the reverse, therefore, there must be no risk to buy. For instance, the RSI divergence can be used to confirm that there is a trough at the bottom of the envelope.
Bollinger bands are usually used in conjunction with other technical indicators to determine a probable trend reversal.What is quite typical for a Bollinger band is a compression signal that forecasts upcoming higher volatility. Perhaps, the most elegant direct approach to the use of Bollinger bands is the volatility breakout system. This system has many variations and forms. The easiest strategy is to wait for the compression to come up (i.e., to wait for the scene to be set); and then, wait for the first price movement outside of the Bollinger bands. By combining this approach with various other technical indicators, it is possible to significantly improve your market analysis.
Forex Volume Indicators
Forex volume indicators inform you about the enthusiasm of the traders about a specific currency pair. Bear in mind that if you're dealing with the stock market, then the number of shares changing hands will be the volume. If you're dealing with options and futures, then the volume is the number of contracts that are traded.
But with forex, you can’t find the entire market volume data with the help of forex volume indicators. That’s because there is no single or central exchange where all currency trades are recorded - the Volume indicators can help you to confirm market trends, or to identify price breakouts. They typically appear at the bottom of the chart and are commonly used to indicate the relative levels of selling and buying pressures.
Forex Oscillators
Another group of forex indicators are oscillators. An oscillator forex indicator is intended to show the momentum of price movement, the strength of the current trend. Oscillators give indications of when a security is oversold or overbought.
Forex oscillators are most often used to signal probable market trend reversals, or trend exhaustion.They are simply another type of indicator that can be used to help you better understand the current market state and identify advantageous market entry and exit points.
The Stochastic Oscillator
The Stochastic Oscillator is an indicator that compares a security’s extreme high and low closing prices within a given timeframe.

Stochastic parameters. This Oscillator is represented by a couple of curves:
the fast Stochastic (K), is mainline
moving average from K, is the D line
It is built in this way: the moving average is depicted as the dotted line, and the main curve is depicted as the solid thick curve.
The indicator plots overbought/oversold price levels. When the stochastic oscillator reading is 70–80%, that indicates overbought market conditions - when the reading is 20-30%, that indicates oversold conditions. Traders use the oscillator signals to identify probable trend reversal price points at which to enter or exit the market. Generally, you should sell when K is lower than D, but you should buy when the K curve is higher than D.
Relative Strength Index (RSI)
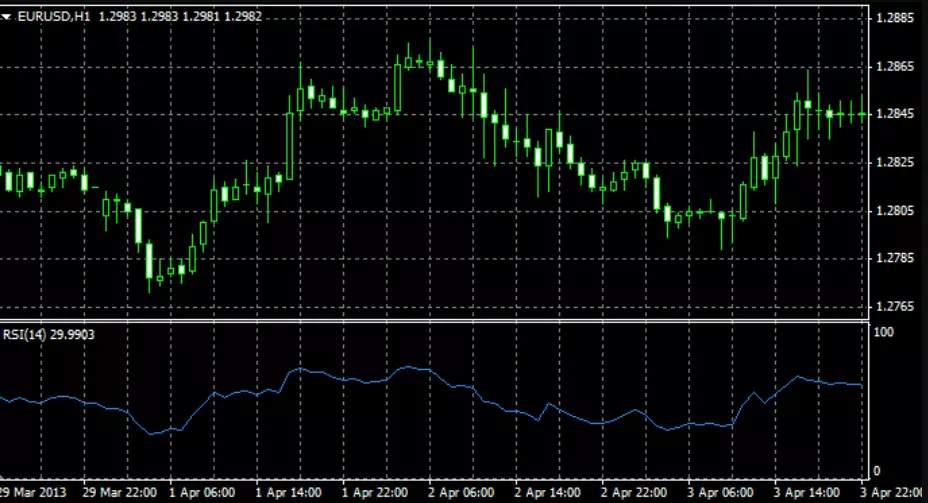
When the average number of positive changes in price is higher than the average number of negative changes in price, the RSI rises. The RSI indicator another momentum indicator that is used to identify trends or a lack of trend, and to indicate trend strength and signal possible upcoming trend changes. The use of the Relative Strength Index alone may lead to a large number of false signals, so it is better used with other technical indicators.
Practical application:
Divergence determination. The RSI is often used to indicate divergence between price movement and market momentum. For example, if price moves to a new high, but the RSI does not move to a new high, that is an indication of price/momentum divergence. When such divergence occurs, it is often an early indication of trend exhaustion and upcoming trend reversal. Thus, a trader might look to sell, anticipating a change from an uptrend to a downtrend.
The Momentum Indicator
The Momentum Indicator is one of the easiest technical indicators to use. Its purpose is to measure the variation value of a financial instrument’s price over a certain period of time.
In most cases, the Momentum indicator becomes a leading indicator forecasting future price movement.
The Momentum indicator in practical application:
A buy signal is generated in the event that the Momentum indicator creates a cavity and then reverses and starts to rise.
The Momentum indicator reverses

A sell signal is generated when the momentum indicator creates a peak and then reverses and starts to fall.
3. The momentum indicator reverses by falling

Extremely high or low values of the momentum indicator imply a strong current trend.
4. The Momentum indicator can be used as a leading indicator.The overshot of the Momentum indicator tends to be a signal that the market is approaching its peak.
Before installing and testing your chosen indicators, it’s worth ensuring that your broker offers fast execution, low spreads, and reliable access to MT4/MT5. Here’s a comparison table of trusted Forex brokers supporting free indicator downloads.
| zForex | OANDA | Trading.com USA | FOREX.com | iBroker | |
|---|---|---|---|---|---|
|
MT4 |
No | Yes | No | Yes | Yes |
|
MT5 |
Yes | Yes | Yes | Yes | Yes |
|
Min. deposit, $ |
10 | No | 50 | 100 | 1 |
|
Max. leverage |
1:1000 | 1:200 | 1:50 | 1:50 | 1:30 |
|
Standard EUR/USD spread |
0.3 | 0.3 | 1.1 | 1.0 | 0.2 |
|
Deposit fee, % |
No | No | No | No | No |
|
Withdrawal fee, % |
No | No | No | No | No |
|
Max. Regulation Level |
Not regulated | Tier-1 | Tier-1 | Tier-1 | Tier-1 |
|
TU overall score |
8.05 | 6.89 | 6.15 | 6.87 | 5.45 |
|
Open an account |
Go to broker Your capital is at risk.
|
Go to broker Your capital is at risk. |
Go to broker Your capital is at risk. |
Study review | Study review |
How to Install the Forex Indicator?
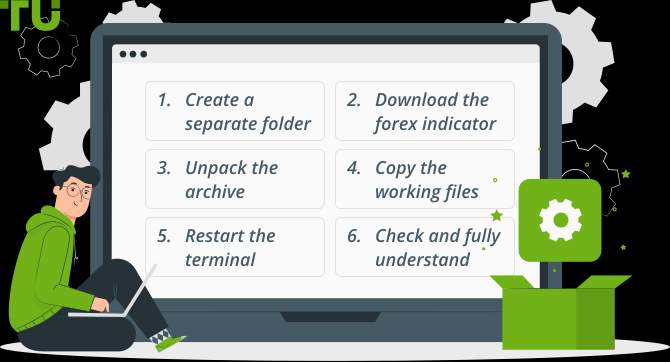
Once you have downloaded the desired forex indicators, the next step is to install them; otherwise, they'll be of no use. Here we have compiled a step-by-step guide that explains how to download and install forex indicators.
- First Step:
The first and the obvious step is to create a separate folder on your computer.
- Second Step:
Open the [web page] to download the forex indicator that you want.
- Third Step:
Unpack the downloaded archive (with RAR or Zip format) file to your desktop and then move it to the folder that you just created.
Tip: Sometimes, a separate text file is also located in the downloaded archive that contains the instructions and steps regarding the installation process. Look for that text file.
- Fourth Step:
Copy the working files of the downloaded indicator to the folder with MetaTrader indicators. Bear in mind that most of the folders will be named indicators, and you'll need to find the right folder. For that, you’ll need to click on the trading terminal’s icon and then proceed to Properties and select the “Find Object” command. After that, go to the "Expert" folder, which is the location of the "Indicators" folder where you need to copy the necessary files.
- Fifth Step:
Restart the trading platform and to reload the indicators directory. Once done, the newly downloaded indicators will appear in the corresponding tab of the program.
- Sixth Step:
It’s necessary to check and fully understand how the newly downloaded and installed indicator works, along with its different parameters and settings before starting to use it.
We recommend you use the newly downloaded indicator on a demo account for a couple of days. That will enable you to understand its operation and use better before you employ it trading a live account with real money.
Top 3 tips for trading with indicators
Use the indicators in combination with other instruments for chart analysis, such as support and resistance lines, trend channels, or patterns. If the indicator signal confirms other trade signals, it improves the credibility of the signal.
Use several indicators simultaneously. For example, moving averages can be used to identify support and resistance levels, and the RSI used as a correction/reversal indicator.
Carefully consider the settings of the indicators for the specific timeframe and trading instrument. Not all settings that work well trading volatile instruments will work well on low-activity markets, and vice versa.
Conclusion
In summary, mastering Forex indicators is essential for any trader aiming for consistent success in the market. By leveraging powerful tools like trend indicators to identify market direction and oscillators such as RSI for spotting overbought or oversold conditions, traders gain a strategic advantage. For example, combining volume indicators with moving averages can enhance trade timing and confidence. Ultimately, the right combination of robust Forex indicators transforms data into actionable insights—empowering traders to make smarter, more profitable decisions.
FAQs
Are there risks associated with relying solely on free forex indicators for trading decisions?
Which timeframes are most effective when using forex indicators for market analysis?
How can traders avoid common mistakes when installing and using downloaded forex indicators?
What role does backtesting play in selecting the right forex indicators?
Editors' Top Picks and Insights

Is Bitcoin right for you? Five traits shared by many cryptocurrency holders

Chasing hits: Why investors are losing interest in Netflix

Tokenized stocks in the spotlight: How do they work and are they worth trading?

Do politicians make the best stock traders?

Crypto test drive: How automakers are exploring digital assets

Lindsey Graham death: U.S. senator’s crypto legacy
Related Articles
Team that worked on the article
Johnathan M. is a U.S.-based writer and investor, a contributor to the Traders Union website.
Dan Blystone began his trading career in 1998 as an arbitrage clerk on the floor of the Chicago Mercantile Exchange (CME). He later traded bond and Eurex futures at proprietary firms such as Altea Trading, gaining valuable experience in high-frequency trading and risk management.
Chinmay Soni is a financial analyst with more than 5 years of experience in working with stocks, Forex, derivatives, and other assets. As a founder of a boutique research firm and an active researcher, he covers various industries and fields, providing insights backed by statistical data.
Index in trading is the measure of the performance of a group of stocks, which can include the assets and securities in it.
Risk management is a risk management model that involves controlling potential losses while maximizing profits. The main risk management tools are stop loss, take profit, calculation of position volume taking into account leverage and pip value.
Forex leverage is a tool enabling traders to control larger positions with a relatively small amount of capital, amplifying potential profits and losses based on the chosen leverage ratio.
Backtesting is the process of testing a trading strategy on historical data. It allows you to evaluate the strategy's performance in the past and identify its potential risks and benefits.
Forex trading, short for foreign exchange trading, is the practice of buying and selling currencies in the global foreign exchange market with the aim of profiting from fluctuations in exchange rates. Traders speculate on whether one currency will rise or fall in value relative to another currency and make trading decisions accordingly. However, beware that trading carries risks, and you can lose your whole capital.

-
 Afghanistan
-
 Albania
-
 Algeria
-
 Angola
-
 Argentina
-
 Armenia
-
 Australia
-
 Austria
-
 Azerbaijan
-
 Bahamas
-
 Bahrain
-
 Bangladesh
-
 Belarus
-
 Belgium
-
 Bolivia
-
 Botswana
-
 Brazil
-
 Brunei
-
 Bulgaria
-
 Cambodia
-
 Cameroon
-
 Canada
-
 Chile
Chile
-
 China
China
-
 Colombia
-
 Congo
Congo
-
 Costa Rica
-
 Cote d'Ivoire
-
 Croatia
-
 Cuba
Cuba
-
 Cyprus
-
 Czechia
-
 DR Congo
-
 Denmark
-
 Dominican Republic
-
 Ecuador
-
 Egypt
Egypt
-
 El Salvador
-
 Estonia
-
 Eswatini
-
 Ethiopia
-
 Finland
-
 France
-
 Georgia
-
 Germany
-
 Ghana
Ghana
-
 Greece
-
 Haiti
Haiti
-
 Hong Kong
-
 Hungary
-
 India
India
-
 Indonesia
-
 Iran, Islamic republic
-
 Iraq
Iraq
-
 Ireland
-
 Israel
-
 Italy
Italy
-
 Jamaica
-
 Japan
Japan
-
 Jordan
-
 Kazakhstan
-
 Kenya
Kenya
-
 Korea
Korea
-
 Kuwait
-
 Kyrgyzstan
-
 Laos
Laos
-
 Latvia
-
 Lebanon
-
 Lesotho
-
 Libya
Libya
-
 Lithuania
-
 Luxembourg
-
 Madagascar
-
 Malaysia
-
 Malta
Malta
-
 Mauritius
-
 Mexico
-
 Moldova
-
 Mongolia
-
 Montenegro
-
 Morocco
-
 Mozambique
-
 Myanmar
-
 Namibia
-
 Nepal
Nepal
-
 Netherlands
-
 New Zealand
-
 Nigeria
-
 North Macedonia
-
 Norway
-
 Oman
Oman
-
 Pakistan
-
 Palestine
-
 Panama
-
 Papua New Guinea
-
 Paraguay
-
 Peru
Peru
-
 Philippines
-
 Poland
-
 Portugal
-
 Puerto Rico
-
 Qatar
Qatar
-
 Reunion
-
 Romania
-
 Rwanda
-
 Saudi Arabia
-
 Serbia
-
 Singapore
-
 Slovakia
-
 Slovenia
-
 Somalia
-
 South Africa
-
 Spain
Spain
-
 Sri Lanka
-
 Sweden
-
 Switzerland
-
 Syria
Syria
-
 Taiwan
-
 Tajikistan
-
 Tanzania
-
 Thailand
-
 Trinidad and Tobago
-
 Tunisia
-
 Turkey
-
 UAE
UAE
-
 Uganda
-
 Ukraine
-
 United Kingdom
-
United States
-
 Uruguay
-
 Uzbekistan
-
 Venezuela
-
 Vietnam
-
 Yemen
Yemen
-
 Zambia
-
 Zimbabwe
- Forex
- Crypto
