Overbought And Oversold Indicators Explained
You can use RSI and Stochastic Oscillator to identify overbought and oversold conditions. For RSI, readings above 70 indicate overbought, and readings below 30 indicate oversold. In the case of the Stochastic Oscillator, values above 80 suggest overbought, while values below 20 suggest oversold.
In the dynamic world of financial markets, the quest for timely and strategic buy and sell decisions is of paramount importance to traders. In this article, the experts at TU will delve into the realm of overbought and oversold Forex indicators, powerful technical analysis tools utilized to pinpoint potential reversal points in asset prices. By thoroughly understanding how these indicators work, traders can gain valuable insights into market sentiment and identify opportune moments to enter or exit positions.
What is overbought?
Overbought levels refer to a situation where the price of an asset has experienced a consistent and significant upward movement, leading to a price that surpasses its actual value. This phenomenon is often associated with various financial instruments, such as stocks, options, Forex, and commodities, and it plays a crucial role in determining market conditions and predicting future trends.
When a stock is deemed overbought, it suggests that market participants have been aggressively buying the asset, causing its price to surge beyond its fundamental worth. However, this steep ascent cannot continue indefinitely, and a point of maturity or extremity is reached where traders perceive the asset as excessively expensive. At this juncture, it is highly likely that a pullback will occur, causing the price to decline to a more reasonable level.
Main features of overbought levels
Significant price increase:
Overbought conditions occur when the price of an asset experiences a sustained and substantial upward movement, resulting in a price that exceeds its actual value
Potential price reversal:
An overbought situation suggests that the asset's price has reached an extreme level, making it prone to a potential pullback or correction in the near future
Market sentiment:
Overbought levels reflect a period of market optimism and strong buying activity, as traders and investors rush to acquire the asset, driving its price higher
What is oversold?
Conversely, oversold levels occur when the price of an asset experiences a significant and sustained decline, leading to a value that is lower than its actual worth. Like overbought conditions, oversold situations are observed across various financial markets, including stocks, options, Forex, and commodities.
An oversold stock indicates that market participants have been heavily selling the asset, causing its price to plummet below its intrinsic value. This scenario implies that the short-term declines are likely to be exhausted soon, creating a potential opportunity for a price rebound or rally.
Main features of oversold levels
Substantial price decrease:
Oversold conditions occur when the price of an asset experiences a sustained and significant downward movement, leading to a price below its actual value
Potential price rebound:
An oversold situation indicates that the asset's short-term declines are likely to be exhausted, potentially creating an opportunity for a price rebound or rally
Market pessimism:
Oversold levels reflect a period of market pessimism and heightened selling activity, as traders and investors offload the asset, causing its price to decline
| Parameter | Overbought | Oversold |
|---|---|---|
Definition |
Assets for copy trading Securities are trading above their fair value |
Regulator Securities are trading below their intrinsic value |
Price Movement |
Assets for copy trading Upward or bullish momentum |
Regulator Downward or bearish momentum |
Caused By |
Assets for copy trading Intense buying of a security |
Regulator Excessive selling of stock |
Major Triggers |
Assets for copy trading Positive news or optimistic buyer sentiments |
Regulator Negative information or pessimistic seller sentiments |
Relative Strength Index (RSI) |
Assets for copy trading RSI reading of 70 or higher |
Regulator RSI reading of 30 or lower |
Stochastic Oscillator |
Assets for copy trading Stochastic Oscillator above 80 points |
Regulator Stochastic Oscillator below 20 points |
Indicates |
Assets for copy trading Potential period of price decline or pullback |
Regulator Potential market rally or price rebound |
How to use the Stochastic Oscillator
The Stochastic Oscillator, developed by George C. Lane in the 1950s, is a momentum metric used by analysts and traders to predict potential reversals. It compares the most recent closing price to the range for a given period, typically 14 days. The Stochastic Oscillator is a valuable tool for traders to assess overbought and oversold conditions in the financial markets. It is a range-bound indicator, meaning its values always fall between 0 and 100.
These boundaries enable traders to identify extreme price conditions in the market, indicating potential overbought or oversold situations. While the Stochastic Oscillator is a reliable tool for spotting overbought and oversold conditions, it is crucial to complement its signals with trend indicators for a more comprehensive analysis. Trend indicators can help confirm the overall market direction, providing a safety net against false signals that may arise from isolated readings of the Stochastic Oscillator.
How to interpret the Stochastic Oscillator on a chart?
Overbought conditions:
When the Stochastic Oscillator reading climbs above 80, it is considered to be in the overbought range. This suggests that the asset's price has experienced a significant and rapid upward movement, potentially making it vulnerable to a pullback or price correction. Traders should be cautious and consider potential selling opportunities in this scenario.
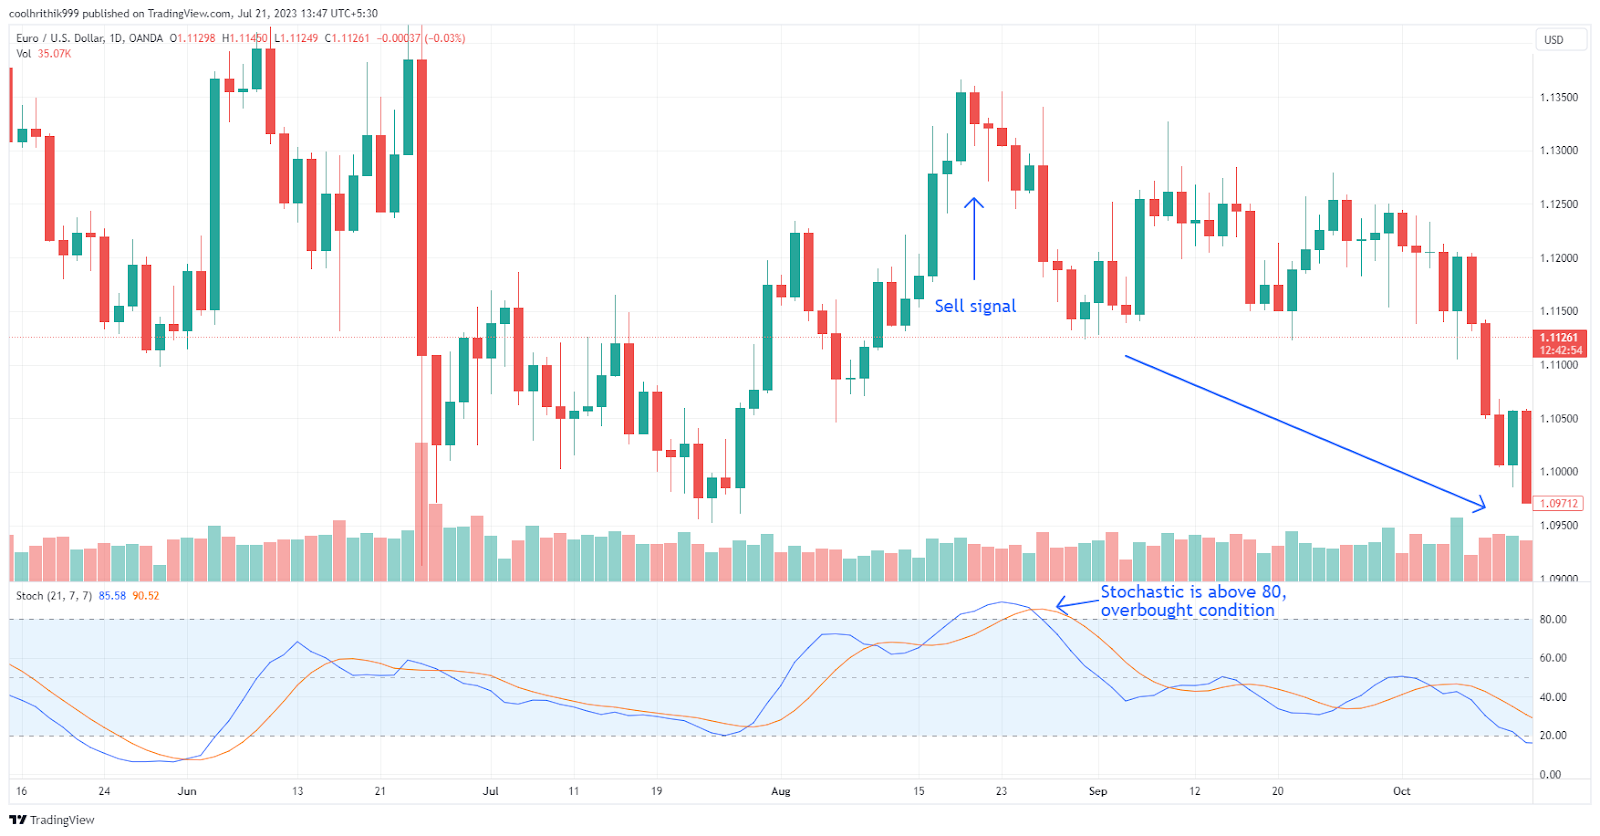
How to interpret the Stochastic Oscillator on a chart
Oversold conditions:
Conversely, when the Stochastic Oscillator reading falls below 20, it indicates an oversold condition. This implies that the asset's price has endured a substantial and swift downward movement, presenting an opportunity for a potential price rebound. Traders may see this as a signal to explore buying opportunities or taking long positions.
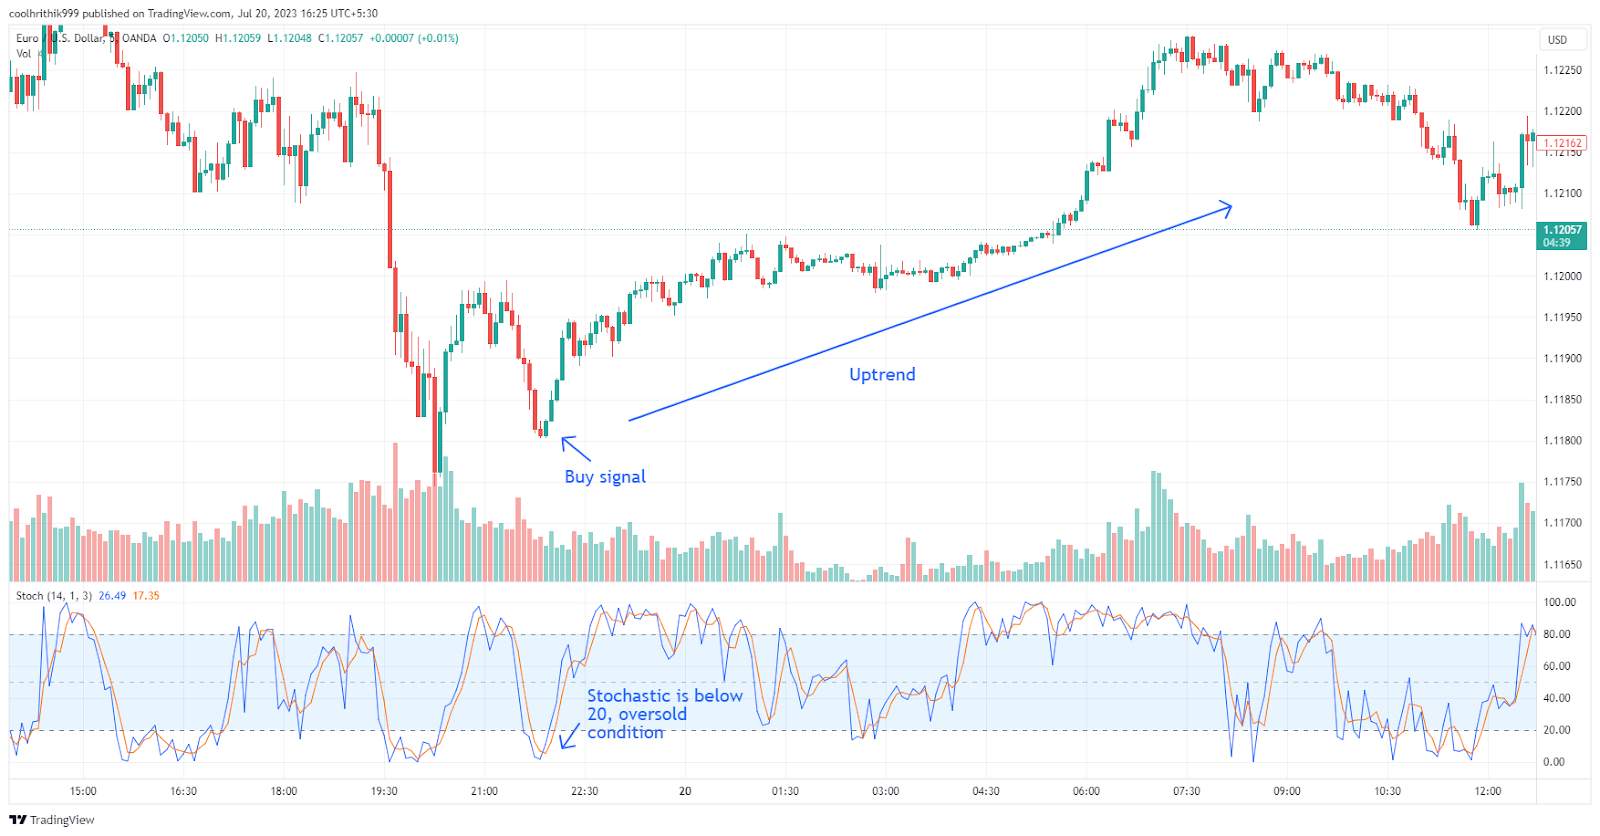
How to interpret the Stochastic Oscillator on a chart
It is important to note that while the Stochastic oscillator gives reasonable insights into overbought and oversold conditions, using it alone may lead to false entry signals. So, experts suggest combining it with other confirmatory tools to take trades. Following is an example of using Stochastic oscillator in confluence with bollinger bands:
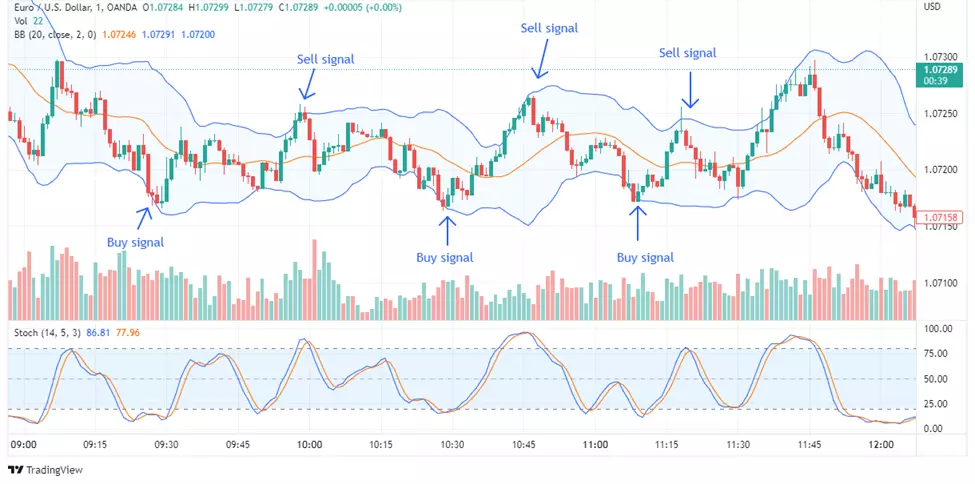
How to interpret the Stochastic Oscillator on a chart
How to use RSI to identify overbought and oversold conditions
The Relative Strength Index (RSI) is a powerful momentum oscillator used to assess overbought and oversold conditions in trading assets. It compares the magnitude of recent gains to losses and presents its findings as a line graph oscillating between 0 and 100. Understanding how RSI divergence works and interpreting its signals correctly can significantly enhance trading strategies.
How is RSI different from Stochastic Oscillator?
RSI and the Stochastic Oscillator are both momentum oscillators, but they differ in their calculation methods and the way they present results. While the Relative Strength Index (RSI) evaluates an asset's recent gains and losses, the Stochastic Oscillator assesses the relationship between an asset's closing price and its price range during a defined period. The RSI scale ranges from 0 to 100, with overbought conditions typically above 70 and oversold conditions below 30. On the other hand, the Stochastic Oscillator uses a scale of 0 to 100, with overbought levels above 80 and oversold levels below 20.
How to interpret RSI on a chart?
Overbought conditions:
When the RSI approaches or surpasses the 70 mark, it indicates that the asset is overbought. This suggests that there has been an excessive buying pressure, potentially leading to a trend reversal or a slowdown in price movement. Traders may consider this a signal to sell or take profits.
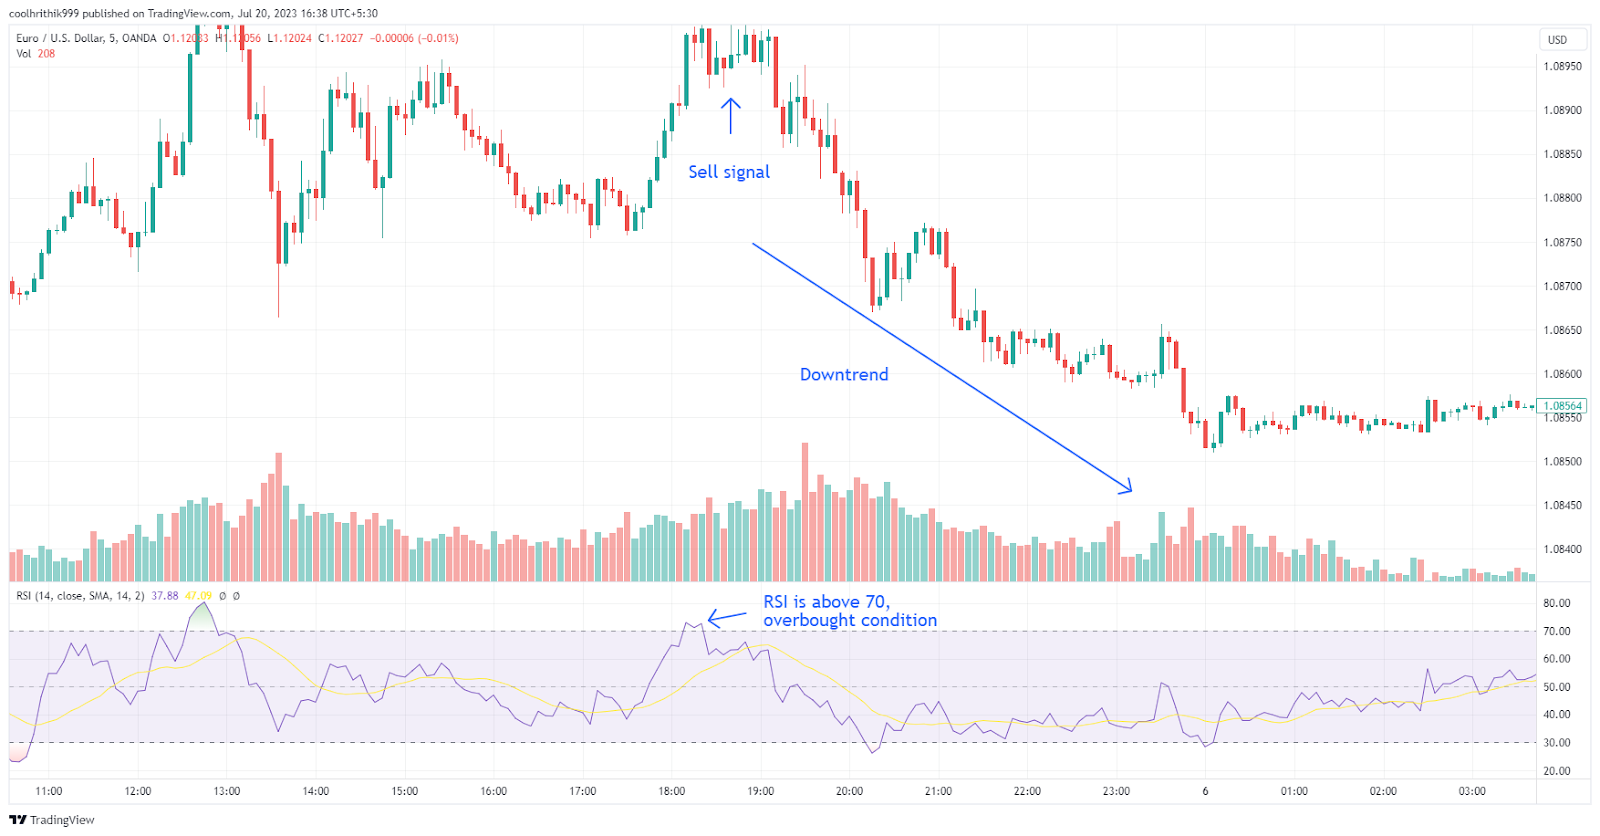
How to interpret RSI on a chart
Oversold conditions:
When the RSI approaches or falls below the 30 mark, it signals that the asset is oversold. This implies an abundance of selling pressure, which could lead to a trend reversal or a slowdown in downward movement. Traders may see this as an opportunity to buy or take long positions.
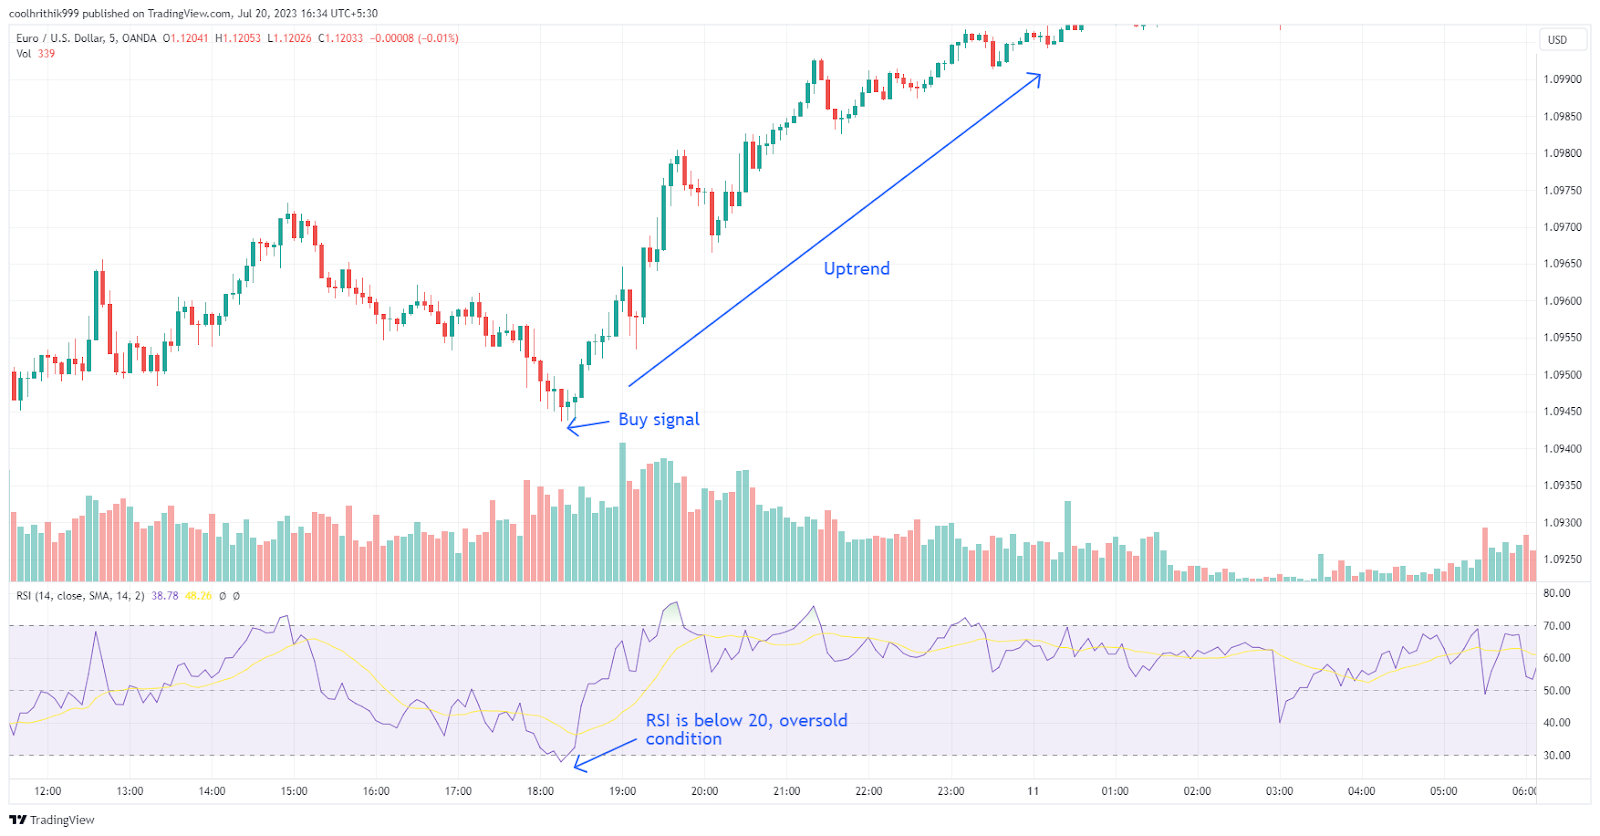
How to interpret RSI on a chart
Stochastic Oscillator vs RSI: When to use
When it comes to effectively using overbought and oversold indicators, understanding the differences between the Stochastic Oscillator and the RSI can be instrumental in making informed trading decisions. Each indicator has unique characteristics that make them more suitable for specific market conditions.
Calculation method
The Stochastic Oscillator calculates its values based on the relationship between the closing price and the high-low range over a specified period. In contrast, the RSI assesses recent gains and losses to present its readings.
Range of values
Both oscillators have a scale ranging from 0 to 100, but their interpretations of overbought and oversold conditions differ. For the Stochastic Oscillator, readings above 80 indicate overbought conditions, while readings below 20 suggest oversold conditions. On the other hand, the RSI considers readings above 70 as overbought and readings below 30 as oversold.
Sensitivity to price movements:
The Stochastic Oscillator is more responsive to short-term price movements, generating more frequent trading signals compared to the RSI, which tends to produce smoother signals and is better suited for assessing longer-term trends.
Signal generation
Both indicators are valuable for identifying overbought and oversold conditions. However, the RSI offers an additional benefit of detecting divergences, signaling potential trend reversals, and confirming signals from other indicators.
Market conditions
The Stochastic Oscillator excels in ranging or sideways markets, making it a favorable choice when traders seek to capitalize on short-term price fluctuations within established trading ranges. On the other hand, the RSI is often preferred in trending markets, as it helps traders spot potential reversals during broader price movements.
| Aspect | Relative Strength Index (RSI) | Stochastic Oscillator |
|---|---|---|
Calculation Method |
Assets for copy trading Compares recent gains against losses |
Regulator Compares current closing price to range |
Range of Values |
Assets for copy trading 0 to 100 |
Regulator 0 to 100 |
Overbought Condition |
Assets for copy trading Readings above 70 |
Regulator Values above 80 |
Oversold Condition |
Assets for copy trading Readings below 30 |
Regulator Values below 20 |
Sensitivity to Price Movements |
Assets for copy trading Smoother signals for longer-term trends |
Regulator More sensitive to short-term fluctuations |
Signal Generation |
Assets for copy trading Crossovers above 70 (overbought) or below 30 (oversold) |
Regulator Crossovers above 80 (overbought) or below 20 (oversold) |
Market Conditions |
Assets for copy trading Suitable for trending markets to spot potential reversals |
Regulator Favorable for ranging markets, identifying short-term price fluctuations |
How to trade overbought and oversold levels
To effectively trade overbought and oversold conditions, follow these steps to improve your trading strategy:
Initiate a live trading account or practice with a risk-free demo account
Before engaging in live trading, consider starting with a risk-free demo account to gain experience and confidence in using the indicators and trading strategies without exposing real capital.
Select a market for trading
Choose the financial market that aligns with your trading objectives and preferences, such as stocks, Forex, commodities, or cryptocurrencies, each with its unique characteristics and price behavior.
Utilize the RSI or Stochastic Oscillator to detect overbought and oversold conditions
Employ technical indicators like the Relative Strength Index (RSI) or Stochastic Oscillator and add indicator to MT4 to identify potential overbought and oversold levels in the market. The RSI compares recent gains and losses, while the Stochastic Oscillator analyzes the closing price's relationship with the high-low range, providing valuable insights into potential market reversals.
Determine whether to go long or short
Based on the identified overbought or oversold conditions, make a decision regarding your trading direction. If an asset is overbought, consider short-selling or closing long positions. Conversely, in oversold conditions, contemplate buying or opening long positions.
Execute your trade, monitor the trend, and close your position
Implement your trade based on your analysis and prevailing market conditions. Stay vigilant and observe the price movement and the indicator's signals. Keep in mind that overbought or oversold conditions may not lead to immediate reversals, requiring patience and confirmation signals.
Implement sound risk management
Practice responsible risk management by setting appropriate stop-loss and take-profit levels. This helps safeguard your capital and ensures that potential losses are controlled. Avoid risking a significant portion of your trading account on a single trade.
Other useful indicators for determining overbought and oversold
Technical indicators play a vital role in identifying overbought and oversold conditions in the market. Traders have several options to choose from, such as the Parabolic Stop and Reverse (SAR), Fibonacci Retracement, Bollinger Bands, and Moving Average Convergence Divergence (MACD).
Parabolic stop and reverse (SAR)
The Parabolic SAR is a versatile indicator that helps traders determine the price direction of an asset and potential entry or exit points. It closely follows the price as the trend evolves, positioning itself below the prices during uptrends and above the prices during downtrends. A change in the SAR's position can indicate a potential trend reversal. Experts recommend using additional indicators for confirmation when using the Parabolic SAR to avoid false signals.
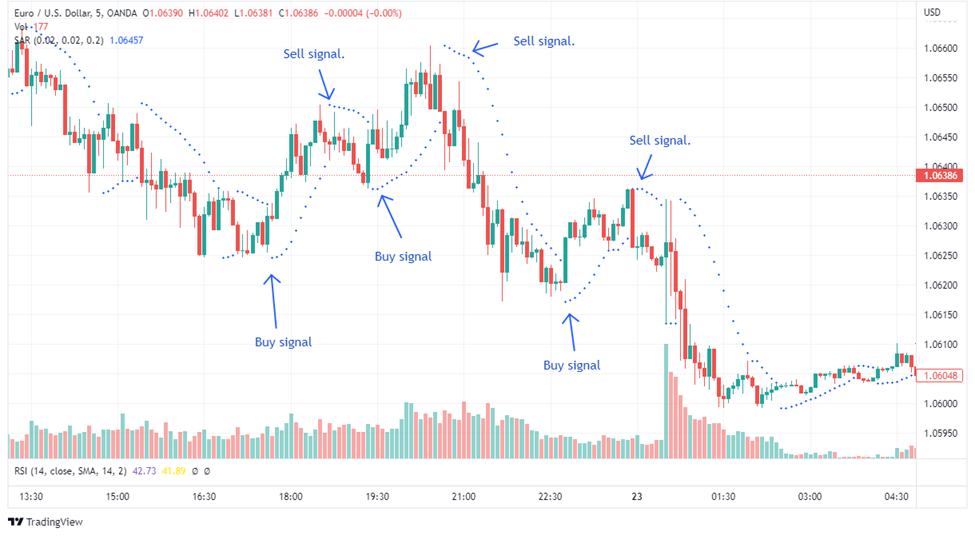
The Parabolic SAR indicator
Fibonacci Retracement
Fibonacci retracement levels are horizontal lines used to identify key support and resistance levels. Traders calculate these levels by taking the vertical distance between an extreme high and low and dividing it by Fibonacci ratios like 23.6%, 38.2%, 50%, 61.8%, and 100%. These levels assist in pinpointing potential reversal points in the price action.
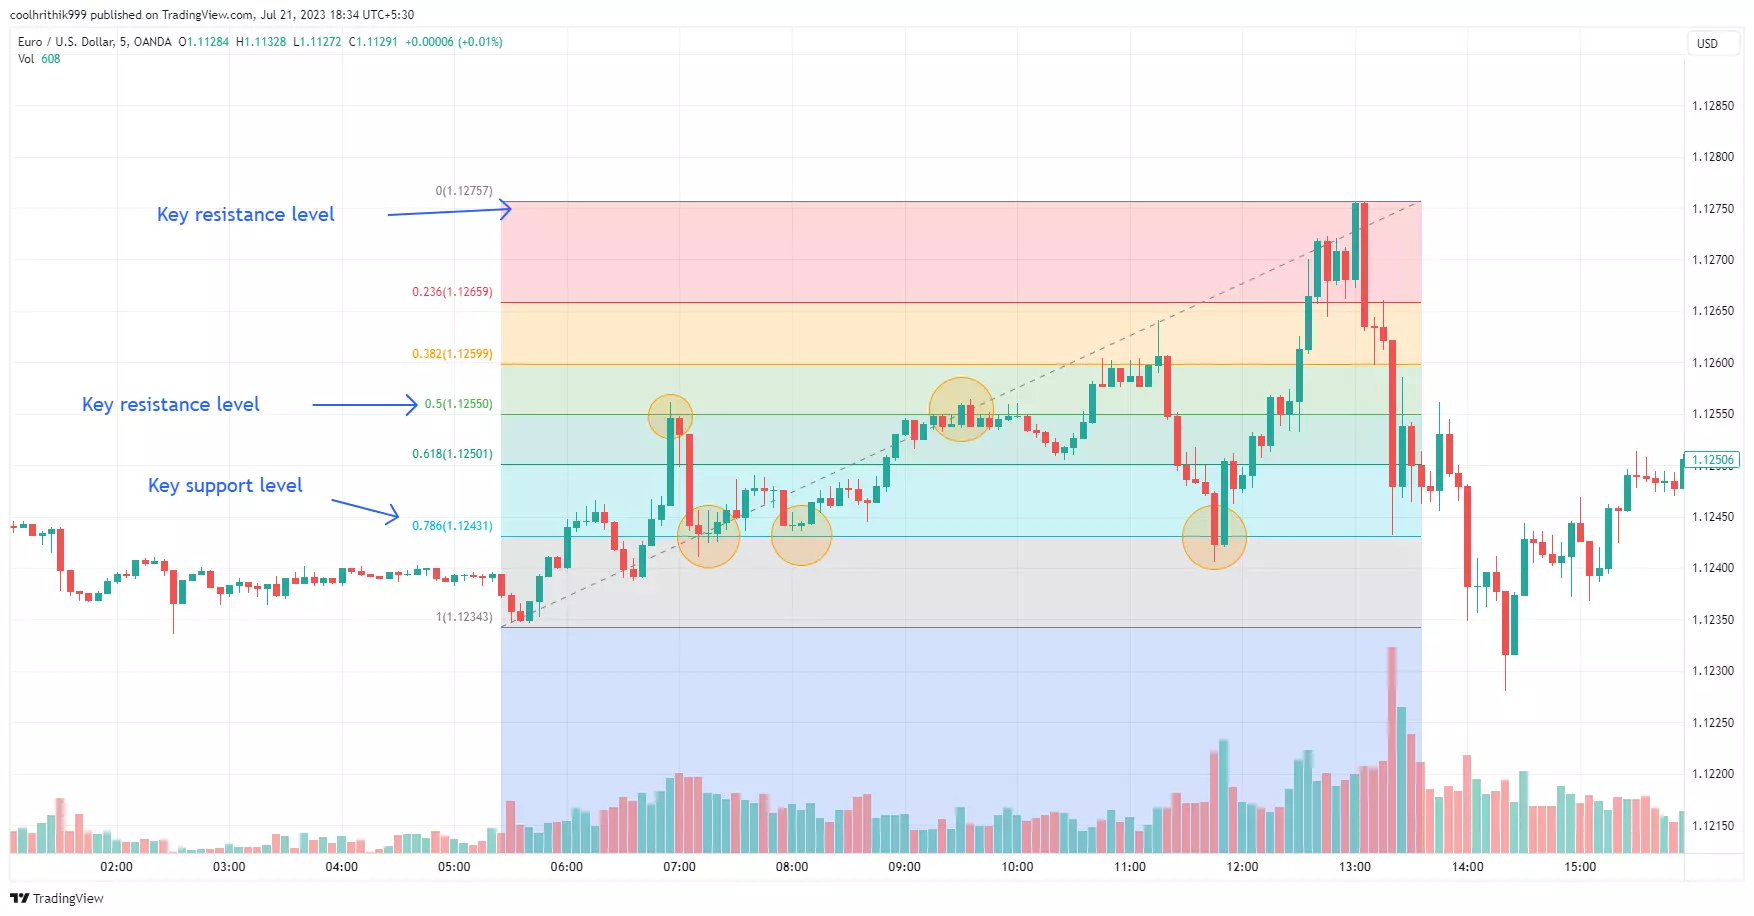
Fibonacci Retracement indicator
Bollinger Bands
Bollinger Bands consist of a middle band, which is a simple moving average (SMA) over an N-period, and upper and lower bands that are K times an N-period standard deviation away from the middle band. When the price moves above the upper band, it indicates an overbought condition, and when it falls below the lower band, it suggests an oversold condition.
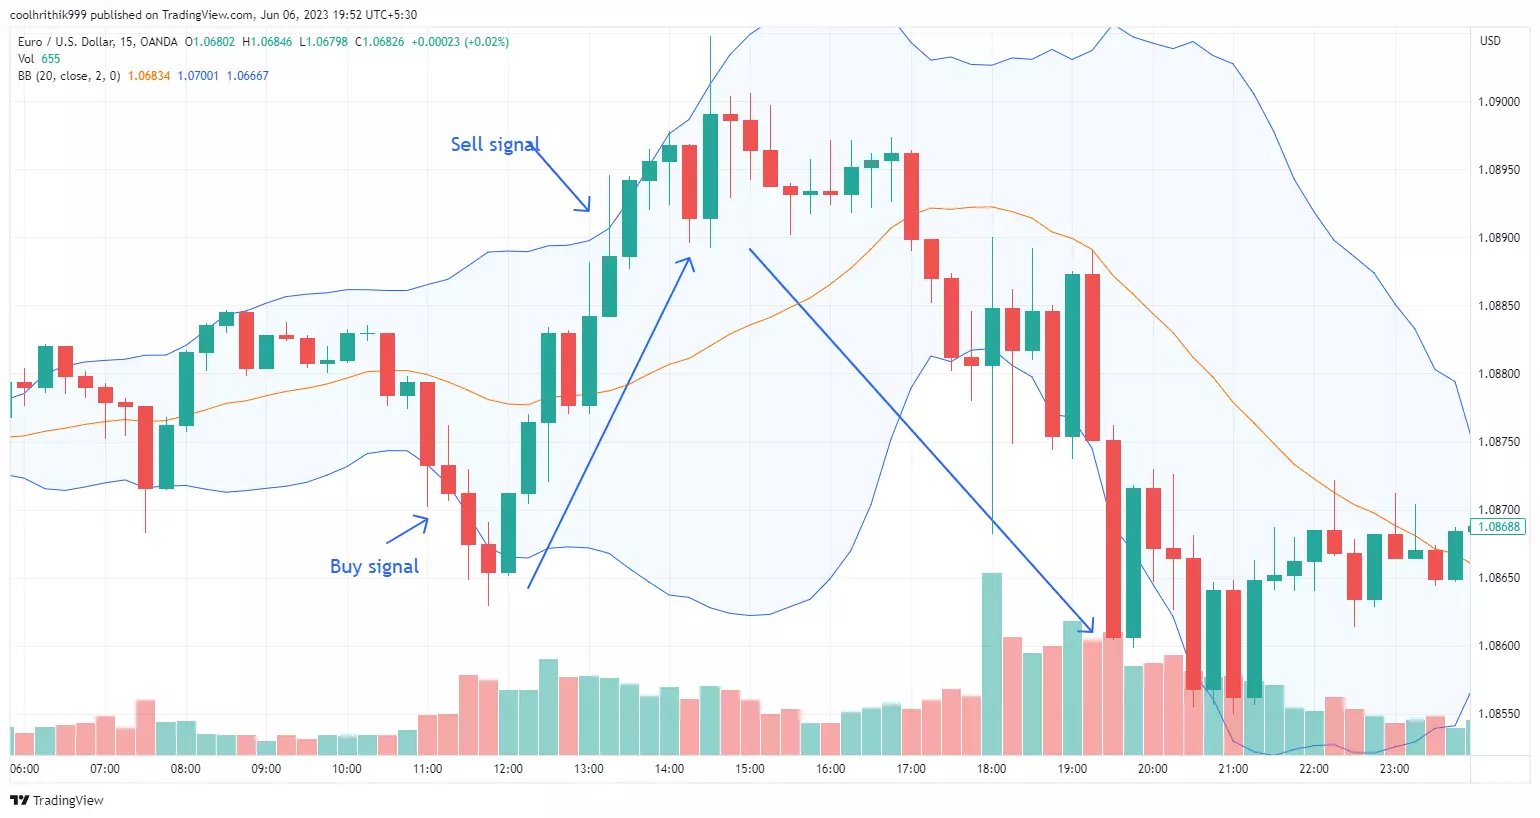
Bollinger Bands indicator
Moving Average Convergence Divergence (MACD)
The MACD trading strategy is a widely used momentum indicator in trading that helps reveal the strength and direction of a trend. It consists of two exponential moving averages, typically a 12-period and a 26-period EMA. The MACD line represents the difference between these two moving averages, while a nine-day EMA, known as the "signal line”, is plotted on top of the MACD line. Traders use the MACD to identify potential trend reversals and generate buy and sell signals based on crossovers between the MACD line and the signal line.
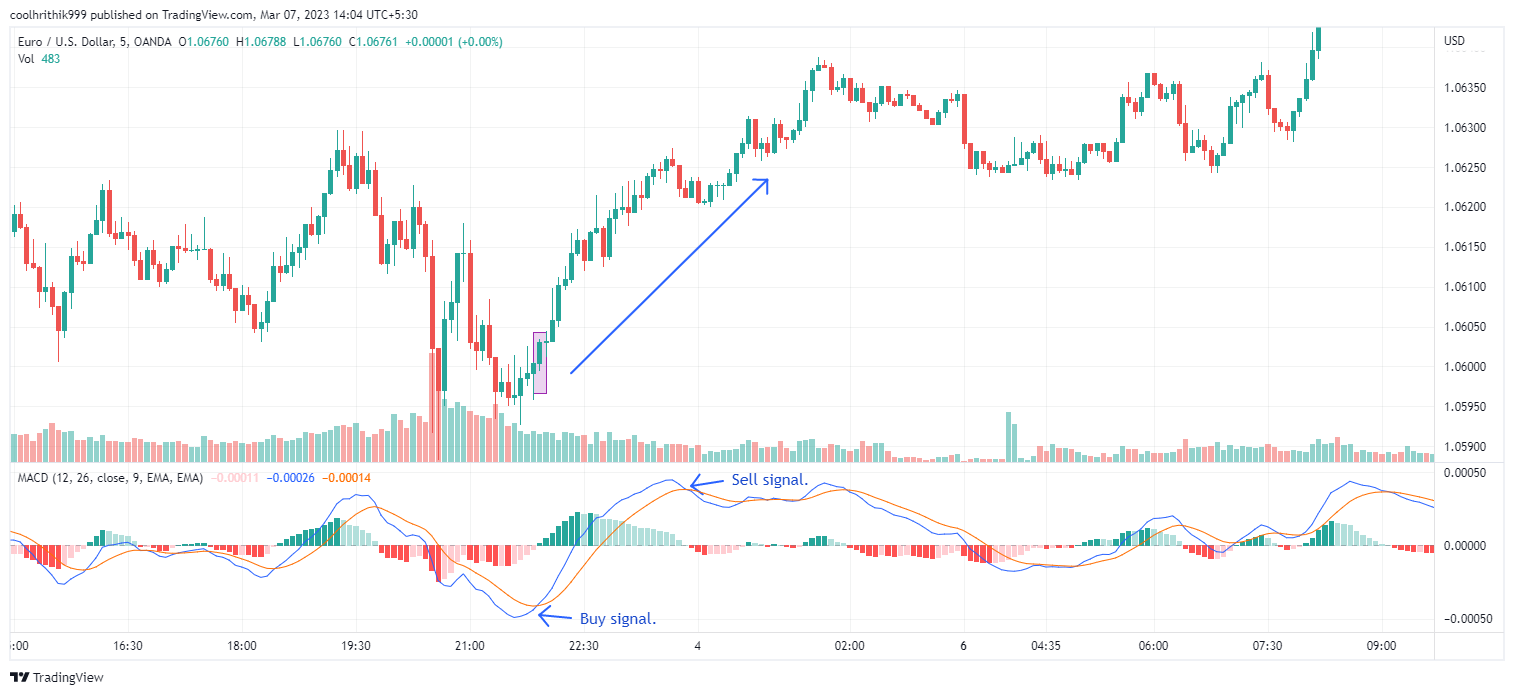
The MACD indicator
Best Forex brokers 2024


FAQs
What is the overbought indicator?
The overbought indicator refers to a technical condition in the financial markets where the price of an asset has risen significantly and is believed to be trading at a level higher than its intrinsic value. This condition often suggests that the asset is overvalued and may experience a price correction or pullback in the near future.
Is overbought a buy or sell?
When an asset is considered overbought, it is generally considered a signal to sell. This is because the overbought condition indicates that the price has reached an extreme level and is likely to reverse or pull back from its current high. Traders and investors often take this as an opportunity to sell their positions and potentially take profits before the price declines.
Is RSI overbought or oversold?
The Relative Strength Index (RSI) can indicate both overbought and oversold conditions. When the RSI reading is above 70, it is considered overbought, suggesting a potential upcoming price reversal or pullback. Conversely, when the RSI reading falls below 30, it is considered oversold, indicating that the asset's price may have declined too much and could potentially experience a price rebound.
What is the best indicator for RSI?
The RSI is already a standalone indicator that measures the momentum and strength of an asset's price movements. However, some traders may use additional technical indicators in conjunction with the RSI to enhance their analysis. Common complementary indicators include moving averages, Bollinger Bands, or MACD, which can provide further insights and confirmation for potential entry and exit points based on the RSI signals. The choice of the best indicator depends on individual trading strategies and preferences.
Team that worked on the article
Chinmay Soni is a financial analyst with more than 5 years of experience in working with stocks, Forex, derivatives, and other assets. As a founder of a boutique research firm and an active researcher, he covers various industries and fields, providing insights backed by statistical data. He is also an educator in the field of finance and technology.
As an author for Traders Union, he contributes his deep analytical insights on various topics, taking into account various aspects.
Dr. BJ Johnson is a PhD in English Language and an editor with over 15 years of experience. He earned his degree in English Language in the U.S and the UK. In 2020, Dr. Johnson joined the Traders Union team. Since then, he has created over 100 exclusive articles and edited over 300 articles of other authors.
Mirjan Hipolito is a journalist and news editor at Traders Union. She is an expert crypto writer with five years of experience in the financial markets. Her specialties are daily market news, price predictions, and Initial Coin Offerings (ICO).


