Trading Divergences: An Ultimate Cheat Sheet


Editorial Note: While we adhere to strict Editorial Integrity, this post may contain references to products from our partners. Here's an explanation for How We Make Money. None of the data and information on this webpage constitutes investment advice according to our Disclaimer.
Different types of divergences that occur in trading are:
Regular divergence - Indicates potential trend reversal
Hidden divergence - Shows continuation of the current trend
Bullish divergence - Signals potential uptrend reversal
Bearish divergence - Suggests potential downtrend reversal
RSI divergence - Measures price momentum discrepancies
MACD divergence - Gauges trend momentum shifts
Ever felt the market is about to shift but the price chart isn't telling the whole story? In such cases, divergence can be your secret weapon. This cheat sheet will equip you to identify these hidden clues, where price action contradicts a technical indicator, potentially signaling a trend reversal or continuation.
What does divergence mean in trading?
In trading, divergence refers to a situation where the movement of an asset's price and a technical indicator shows disagreement. Essentially, it suggests that the current trend may be losing strength and could potentially change direction.
What are the different types of divergence in RSI?
Divergence in technical analysis, including the Relative Strength Index (RSI) and Moving Average Convergence Divergence (MACD), refers to discrepancies between price movements and indicator movements.
Here's an explanation of the types of divergence you've mentioned:
Regular divergence
Bullish regular divergence: This occurs when the price of an asset forms a lower low while the RSI indicator forms a higher low. It suggests that the downtrend may be losing momentum and a potential reversal to the upside could occur.
Bearish regular divergence: This occurs when the price forms a higher high while the RSI indicator forms a lower high. It indicates that the uptrend may be losing strength and a potential reversal to the downside could happen.
Hidden divergence
Bullish hidden divergence: This occurs during an uptrend when the price forms a higher low while the RSI indicator forms a lower low. It suggests that the upward momentum is strong, even though the price may be temporarily retracing.
Bearish hidden divergence: This occurs during a downtrend when the price forms a lower high while the RSI indicator forms a higher high. It indicates that the downward momentum is strong, even though the price may be experiencing a temporary rally.
RSI divergence
RSI divergence refers to situations where the price movement and the RSI indicator show inconsistencies, signalling potential shifts in market direction. Traders use RSI divergences to identify entry and exit points based on the differences between price action and RSI readings.
MACD divergence
MACD divergence is a concept similar to RSI divergence but involves the Moving Average Convergence Divergence (MACD) indicator. It highlights differences between the MACD indicator and price movements, providing insights into potential trend reversals or continuations in the market.
Best Forex brokers
To successfully trade divergence signals, you need a broker that offers reliable charting tools, fast execution, and access to key indicators like RSI and MACD. A well-equipped platform can make it much easier to spot divergences and act on them in real time. The brokers listed below provide the tools and trading conditions needed to support this type of strategy.
| zForex | Plus500 | OANDA | Trading.com USA | FOREX.com | |
|---|---|---|---|---|---|
|
Min. deposit, $ |
10 | 100 | No | 50 | 100 |
|
Tradable assets |
80 | 2800 | 129 | 69 | 5500 |
|
Standard EUR/USD spread |
0.3 | 0.7 | 0.3 | 1.1 | 1.0 |
|
Max. leverage |
1:1000 | 1:300 | 1:200 | 1:50 | 1:50 |
|
Max. Regulation Level |
Not regulated | Tier-1 | Tier-1 | Tier-1 | Tier-1 |
|
TU overall score |
8.05 | 7.57 | 6.89 | 6.15 | 6.87 |
|
Open an account |
Go to broker Your capital is at risk.
|
Go to broker 80% of retail CFD accounts lose money. |
Go to broker Your capital is at risk. |
Go to broker Your capital is at risk. |
Study review |
Divergence cheat sheet
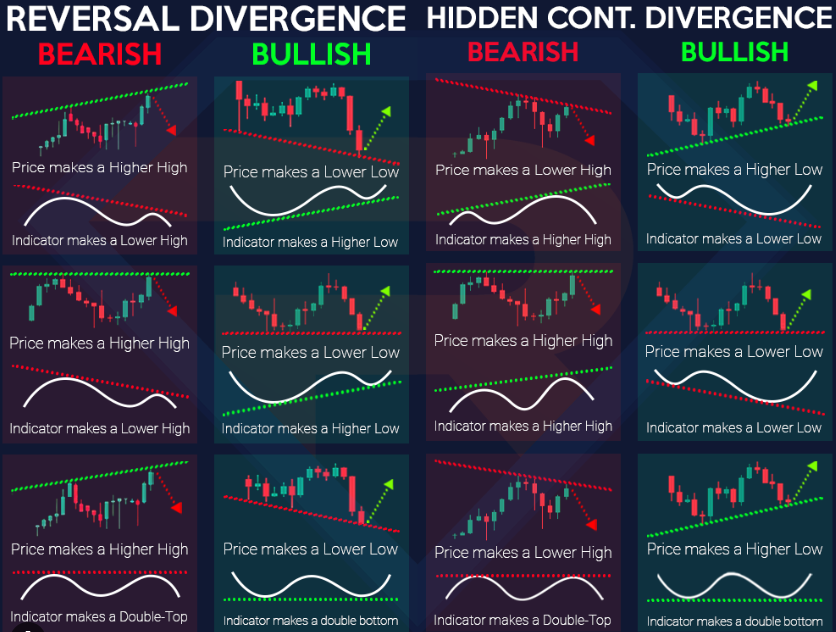
The cheat sheet below shows different visual representations of bullish and bearish divergence for regular and hidden divergence.
Regular bullish divergence: price makes higher highs but the indicator makes lower highs
Regular bearish divergence: price makes lower lows but the indicator makes higher lows
Hidden bullish divergence: price makes lower lows but the indicator makes higher lows
Hidden bearish divergence: price makes higher highs but the indicator makes lower highs
How do you trade divergence correctly?
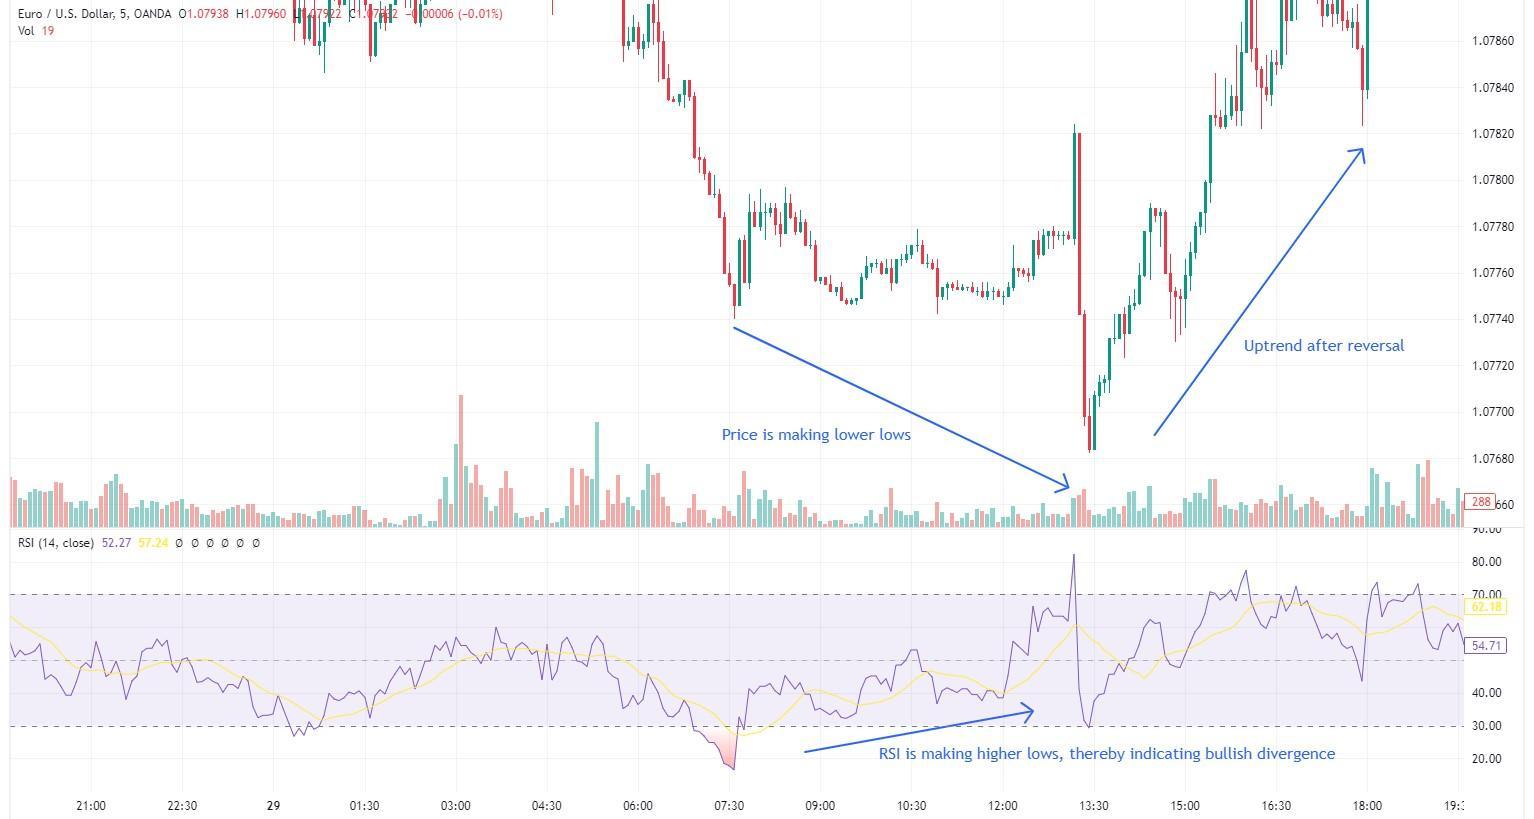
Let’s take the example of RSI divergence. The RSI is a momentum oscillator that measures the speed and strength of price movements. A lower RSI reading typically indicates that the asset is oversold, and a higher RSI reading indicates that the asset is overbought. In the chart, you can see the price of the Euro (EUR) is making lower lows, while the RSI indicator is making higher lows.
In this case, the fact that the RSI is making higher lows even though the price is making lower lows suggests that there is underlying bullish strength in the market. This could be because buyers are starting to step in even though the price is still falling.
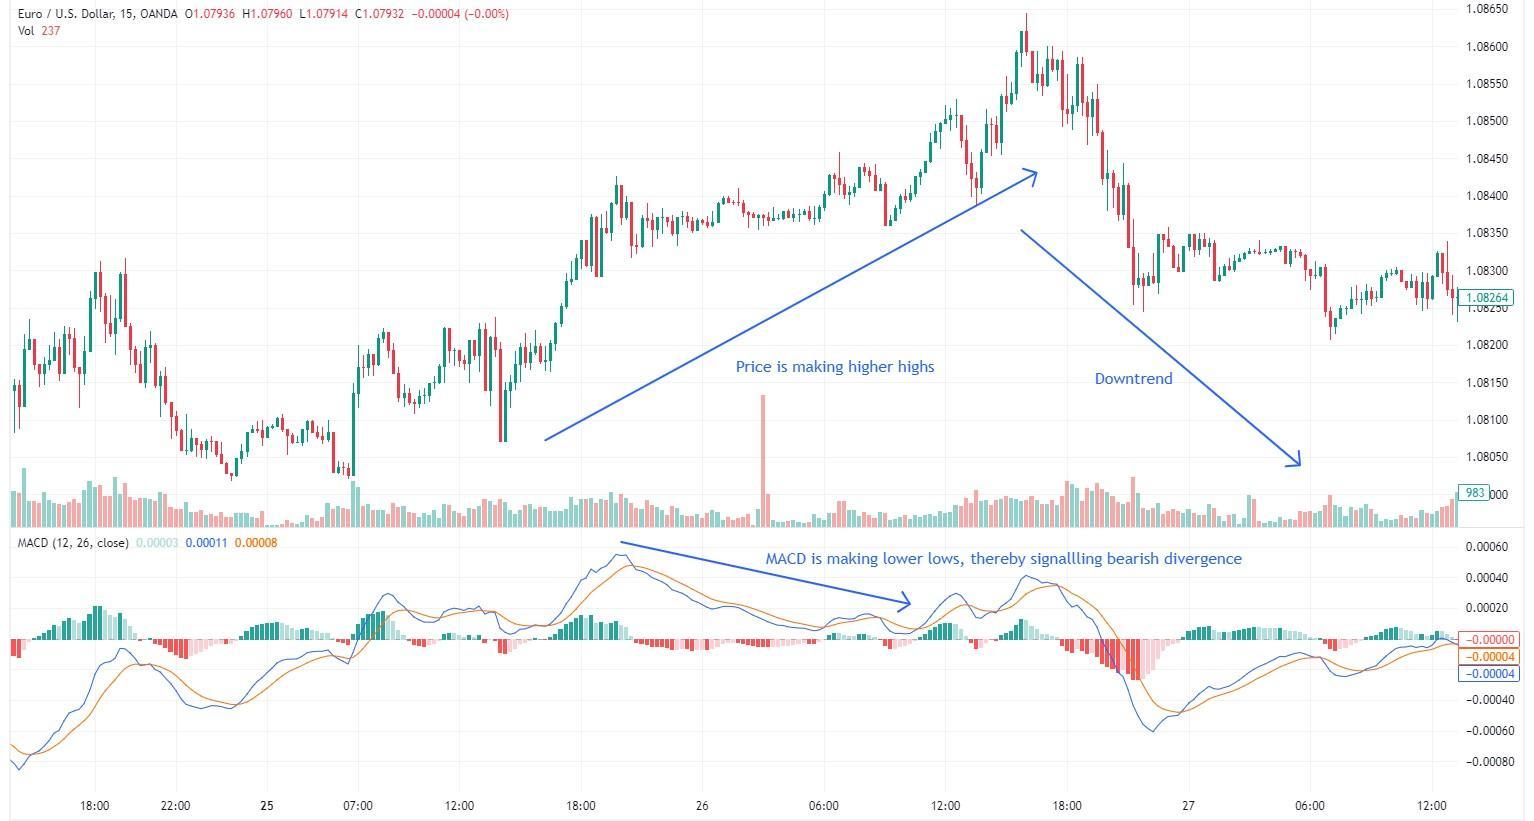
Next, let’s consider MACD divergence. The MACD (Moving Average Convergence Divergence) is a trend-following momentum indicator that measures the difference between two exponential moving averages. A higher MACD reading typically indicates bullish momentum, and a lower MACD reading indicates bearish momentum. In the chart, which shows the price of the Euro (EUR) against the US Dollar (USD), the price is making higher highs, but the MACD indicator is making lower highs.
In this case, the fact that the MACD is making lower highs even though the price is making higher highs suggests that there is underlying bearish weakness in the market. This could be because sellers are starting to step in even though the price is still rising.
Now, it is important to also understand that trading divergence effectively goes beyond merely identifying the discrepancy itself.
Here are some essential considerations:
Confirmation
Divergence serves as a signal of potential weakness or reversal, but it's not foolproof. Seek confirmation from other technical indicators or price action patterns that validate the reversal. This could include factors such as support/resistance levels, trendline breaks, or increased trading volume. These factors strengthen the likelihood of a successful reversal.
Placement
Avoid entering the trade immediately at the point of divergence. Instead, wait for a price pullback (in cases of bullish divergence) or for confirmation through candlestick patterns like a bearish engulfing pattern. This cautious approach enhances the probability of entering the trade at a favorable point.
Risk management
It's imperative to implement proper risk management techniques. Utilize stop-loss orders to mitigate potential losses, as divergences can sometimes result in false signals. This precautionary measure helps safeguard against adverse market movements.
Seek strong divergences
Not all divergences carry the same weight. The strength of a divergence correlates with its extremity. For instance, if the price continues to reach new highs or lows while the indicator forms lower highs or lows, the divergence is considered stronger. Focusing on such robust divergences enhances the reliability of the trading signal.
What is the most accurate divergence indicator?
The most popular and commonly used divergence indicators are:
Moving Average Convergence Divergence (MACD)
This classic indicator compares two exponential moving averages to gauge price momentum. It's reliable for spotting bullish divergence when price forms lower lows while MACD forms higher lows, and conversely for bearish divergence.
Relative Strength Index (RSI)
Acting as an oscillator, RSI measures the speed and change of price movements. When price trends downwards but RSI trends upwards, it signals bullish divergence, and vice versa for bearish divergence.
Awesome Oscillator (AO)
Similar to MACD but with a simpler calculation, AO assists in swiftly identifying divergences.
Additionally, there are some less common but intriguing divergence indicators available on platforms like TradingView:
VWAP Divergence
This indicator contrasts price action with the Volume-Weighted Average Price (VWAP), aiding in filtering out false divergences influenced by volume fluctuations.
YD_Divergence_RSI+CMF
A custom indicator blending RSI and Chaikin Money Flow (CMF) to pinpoint divergence, providing insights into buying and selling pressure alongside momentum shifts.
How do you master divergence in trading?
Confirmation is important
Recognize that divergence alone does not guarantee a reversal signal. Seek confirmation from other technical indicators such as support/resistance levels, trendline breaks, or increased trading volume to reinforce your trading decision.
Strategic trade placement
Refrain from entering trades immediately upon detecting divergence. Instead, wait for a price pullback (in cases of bullish divergence) or for confirmation through candlestick patterns (in cases of bearish divergence) before initiating a trade. This cautious approach enhances the likelihood of entering at favorable market conditions.
Consider the strength of divergence
Understand that not all divergences carry the same significance. Expert Mikhail Vnuchkov says that divergences with more pronounced discrepancies between price movements and indicators tend to yield stronger potential signals. Pay attention to extreme divergences where the price continues to form new highs/lows while the indicator indicates the opposite trend.
Beware of false signals
Acknowledge the possibility of divergences leading to false signals. Implement proper risk management techniques by setting stop-loss orders to mitigate potential losses if the market moves against your anticipated direction.
Engage in paper trading
Utilize paper trading platforms to practice implementing divergence strategies in a risk-free environment. This allows you to refine your skills, experiment with different approaches, and gain confidence before committing real capital.
Develop a comprehensive trading plan
Establish a well-defined trading plan that delineates your entry and exit points, risk management strategies, and how you'll incorporate divergence alongside other technical analysis tools. Having a structured plan enhances consistency and helps you navigate the complexities of trading with divergence effectively.
A few practical remarks
The reliability of the signal depends on the correct oscillator setting
Before a divergence situation, the asset should show stable volatility for at least one trading day
Speculation (news, large option closures, force majeure, etc.) easily breaks divergence and increases the risk of false situations
All direct divergence (divergence) situations are more reliable than convergence options
The higher the interval on which the divergence is clearly visible, the higher the probability of its realization
To assess divergence, you can reduce the period of analysis: if there is a repetition of the situation, you can enter on the signal of a smaller timeframe
Exit from the deal is carried out or at the formation of reverse divergence, according to the manifestation
Setting stops when trading on any divergence schemes is mandatory!
Divergence works best as part of a broader strategy

Divergence is a powerful concept, but it should be treated as an early warning signal rather than a standalone trigger for trades. The most effective traders use divergence alongside trend analysis, support and resistance levels, and volume confirmation to filter out false signals. It’s also important to consider the timeframe, as divergences on higher timeframes tend to be more reliable. In practice, consistent results come from combining divergence with disciplined risk management and patience, rather than reacting to every signal that appears.
Conclusion
Divergence is a vital tool for traders seeking to anticipate market reversals or trend continuations, but its true power lies in integration with other technical signals and disciplined risk management. By understanding key divergences—such as bullish RSI divergence when price forms lower lows but RSI marks higher lows—traders can spot emerging opportunities before they’re obvious on the price chart. Yet, as demonstrated with MACD bearish divergence, waiting for confirmation and considering the strength of the signal can dramatically improve effectiveness. Ultimately, the most successful traders view divergence as an early warning system rather than a standalone strategy, combining it with broader analysis and patience to filter out noise and make high-quality trades. Mastering divergence is as much about restraint and planning as it is about spotting patterns—let the signal guide you, but always trade with care and context.
FAQs
What are common mistakes to avoid when using divergence in trading?
How does the timeframe impact the effectiveness of divergence signals?
How can traders confirm divergence signals before entering a trade?
Why is risk management essential when trading with divergence strategies?
Editors' Top Picks and Insights

Crypto test drive: How automakers are exploring digital assets

Lindsey Graham death: U.S. senator’s crypto legacy

Tether under pressure: USDT in Europe, audit questions, and the fight for trust

Lean Ethereum: Why Buterin wants to rebuild the network

SK Hynix debuts on Nasdaq: Largest U.S. offering by foreign company

SpaceX falls out of orbit: Does anyone still want Musk’s stock?
Related Articles
Team that worked on the article
Parshwa is a content expert and finance professional possessing deep knowledge of stock and options trading, technical and fundamental analysis, and equity research. As a Chartered Accountant Finalist, Parshwa also has expertise in Forex, crypto trading, and personal taxation.
Dr. BJ Johnson is a PhD in English Language and an editor with over 15 years of experience. He earned his degree in English Language in the U.S and the UK.
Mirjan Hipolito is a journalist and news editor at Traders Union. She is an expert crypto writer with five years of experience in the financial markets.
CFD is a contract between an investor/trader and seller that demonstrates that the trader will need to pay the price difference between the current value of the asset and its value at the time of contract to the seller.
Cryptocurrency is a type of digital or virtual currency that relies on cryptography for security. Unlike traditional currencies issued by governments (fiat currencies), cryptocurrencies operate on decentralized networks, typically based on blockchain technology.
Trading divergence in Forex involves identifying when the price of a currency pair and an oscillator (such as RSI, MACD, or Stochastic) move in opposite directions, indicating potential trend reversals or continuations.
Index in trading is the measure of the performance of a group of stocks, which can include the assets and securities in it.
Forex leverage is a tool enabling traders to control larger positions with a relatively small amount of capital, amplifying potential profits and losses based on the chosen leverage ratio.

-
 Afghanistan
-
 Albania
-
 Algeria
-
 Angola
-
 Argentina
-
 Armenia
-
 Australia
-
 Austria
-
 Azerbaijan
-
 Bahamas
-
 Bahrain
-
 Bangladesh
-
 Belarus
-
 Belgium
-
 Bolivia
-
 Botswana
-
 Brazil
-
 Brunei
-
 Bulgaria
-
 Cambodia
-
 Cameroon
-
 Canada
-
 Chile
Chile
-
 China
China
-
 Colombia
-
 Congo
Congo
-
 Costa Rica
-
 Cote d'Ivoire
-
 Croatia
-
 Cuba
Cuba
-
 Cyprus
-
 Czechia
-
 DR Congo
-
 Denmark
-
 Dominican Republic
-
 Ecuador
-
 Egypt
Egypt
-
 El Salvador
-
 Estonia
-
 Eswatini
-
 Ethiopia
-
 Finland
-
 France
-
 Georgia
-
 Germany
-
 Ghana
Ghana
-
 Greece
-
 Haiti
Haiti
-
 Hong Kong
-
 Hungary
-
 India
India
-
 Indonesia
-
 Iran, Islamic republic
-
 Iraq
Iraq
-
 Ireland
-
 Israel
-
 Italy
Italy
-
 Jamaica
-
 Japan
Japan
-
 Jordan
-
 Kazakhstan
-
 Kenya
Kenya
-
 Korea
Korea
-
 Kuwait
-
 Kyrgyzstan
-
 Laos
Laos
-
 Latvia
-
 Lebanon
-
 Lesotho
-
 Libya
Libya
-
 Lithuania
-
 Luxembourg
-
 Madagascar
-
 Malaysia
-
 Malta
Malta
-
 Mauritius
-
 Mexico
-
 Moldova
-
 Mongolia
-
 Montenegro
-
 Morocco
-
 Mozambique
-
 Myanmar
-
 Namibia
-
 Nepal
Nepal
-
 Netherlands
-
 New Zealand
-
 Nigeria
-
 North Macedonia
-
 Norway
-
 Oman
Oman
-
 Pakistan
-
 Palestine
-
 Panama
-
 Papua New Guinea
-
 Paraguay
-
 Peru
Peru
-
 Philippines
-
 Poland
-
 Portugal
-
 Puerto Rico
-
 Qatar
Qatar
-
 Reunion
-
 Romania
-
 Rwanda
-
 Saudi Arabia
-
 Serbia
-
 Singapore
-
 Slovakia
-
 Slovenia
-
 Somalia
-
 South Africa
-
 Spain
Spain
-
 Sri Lanka
-
 Sweden
-
 Switzerland
-
 Syria
Syria
-
 Taiwan
-
 Tajikistan
-
 Tanzania
-
 Thailand
-
 Trinidad and Tobago
-
 Tunisia
-
 Turkey
-
 UAE
UAE
-
 Uganda
-
 Ukraine
-
 United Kingdom
-
United States
-
 Uruguay
-
 Uzbekistan
-
 Venezuela
-
 Vietnam
-
 Yemen
Yemen
-
 Zambia
-
 Zimbabwe
- Forex
- Crypto
