Top 20 Chart Candlestick Patterns


Editorial Note: While we adhere to strict Editorial Integrity, this post may contain references to products from our partners. Here's an explanation for How We Make Money. None of the data and information on this webpage constitutes investment advice according to our Disclaimer.
Top chart candlestick patterns:
- Bullish Reversal Patterns: Hammer, Bullish Engulfing, Morning Star, Piercing Line, Inverted Hammer.
- Bearish Reversal Patterns: Doji, Bearish Engulfing, Evening Star, Dark Cloud Cover, Shooting Star.
- Continuation Patterns: Rising Three Methods, Falling Three Methods, On-Neck Line, Separating Lines, Side-by-Side White Lines.
- Other Patterns: Harami, Spinning Top, Marubozu, Three White Soldiers, Three Black Crows.
Candlestick patterns hold the key to understanding market sentiment and price action, making them an indispensable tool for traders seeking to make informed decisions. By gaining proficiency in reading them, you'll be better equipped to navigate the complex and ever-changing landscape of trading with precision and confidence. In this in-depth guide, the experts at TU will examine the top 20 best candlestick patterns that can significantly elevate your trading performance, covering the full spectrum from bullish and bearish patterns to those that signal reversals.
How do candlestick patterns work?
Understanding candlestick formations
Candlestick formations are visual depictions of price fluctuations that can be observed on stock charts. They provide crucial information about the opening, closing, high, and low prices for a specific period, as well as the general sentiment surrounding a stock. These patterns are easy to identify and can serve as templates for spotting potential trading opportunities.
The history of candlesticks
Candlesticks have been utilized by traders since the 18th century, initially by Japanese traders and later adopted in the Western Hemisphere in 1989. Nowadays, trading platforms generate candlestick charts, making it simpler for traders to examine price movements. Candlesticks can represent various time periods, such as one minute, one day, or one month, displaying the price action for each trading period.
Types of candlestick formations
There are several types of candlestick formations, including bullish, bearish, continuation, and reversal patterns. It's essential to learn how to spot these patterns and understand their significance in the context of trading. Focusing on mastering one pattern at a time can help build a solid foundation for trading.
Bullish candlestick formations
Bullish candlestick formations can indicate a reversal after a bearish trend or a continuation of an established bullish trend. It's important to note that these patterns may include one or more bearish-looking candlesticks.
Bearish candlestick formations
Bearish candlestick formations suggest lower prices ahead and can either confirm an existing trend or signal a reversal after a bullish rally.
Japanese candlestick formations
Japanese candlestick formations are the foundation for all candlestick patterns. They were initially used by Japanese rice traders in the 1700s and introduced to the Western world in the late 1980s. Today, they are the go-to charting method for many traders.
Bullish Reversal Patterns
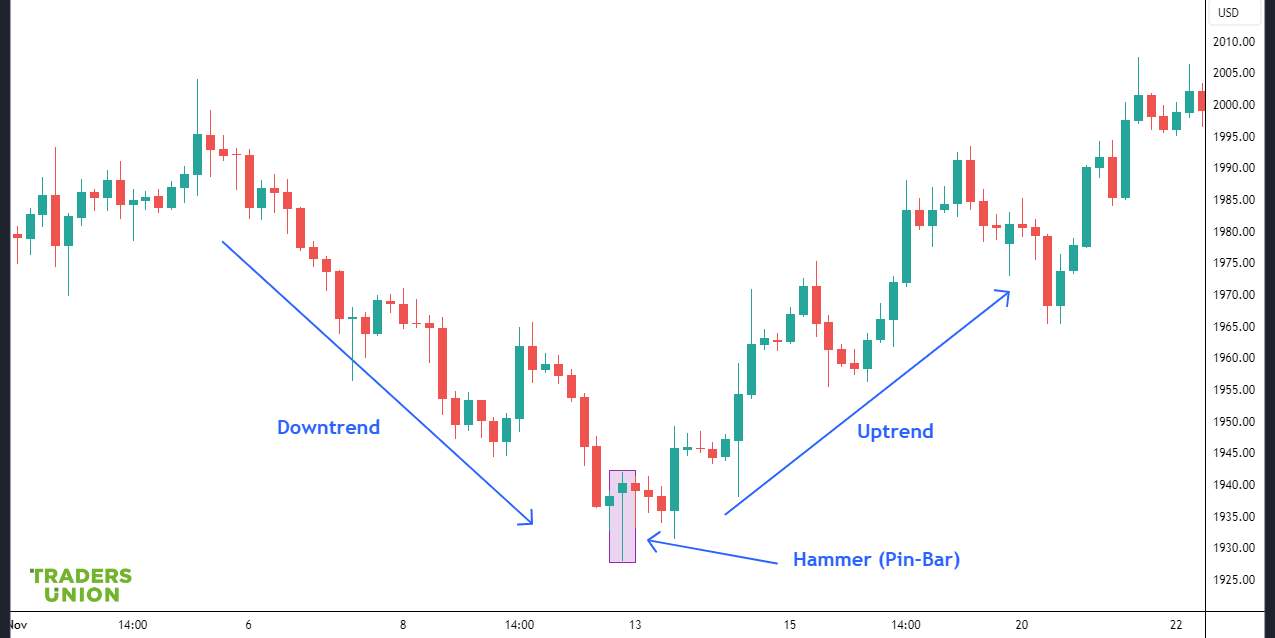
Hammer
A Hammer candlestick pattern is formed when a security's low significantly surpasses its opening price, but the security rallies to close near the opening price. This pattern's long lower shadow indicates that sellers initially pushed the price down, but buyers regained control and pushed the price back up, suggesting a potential bullish reversal.
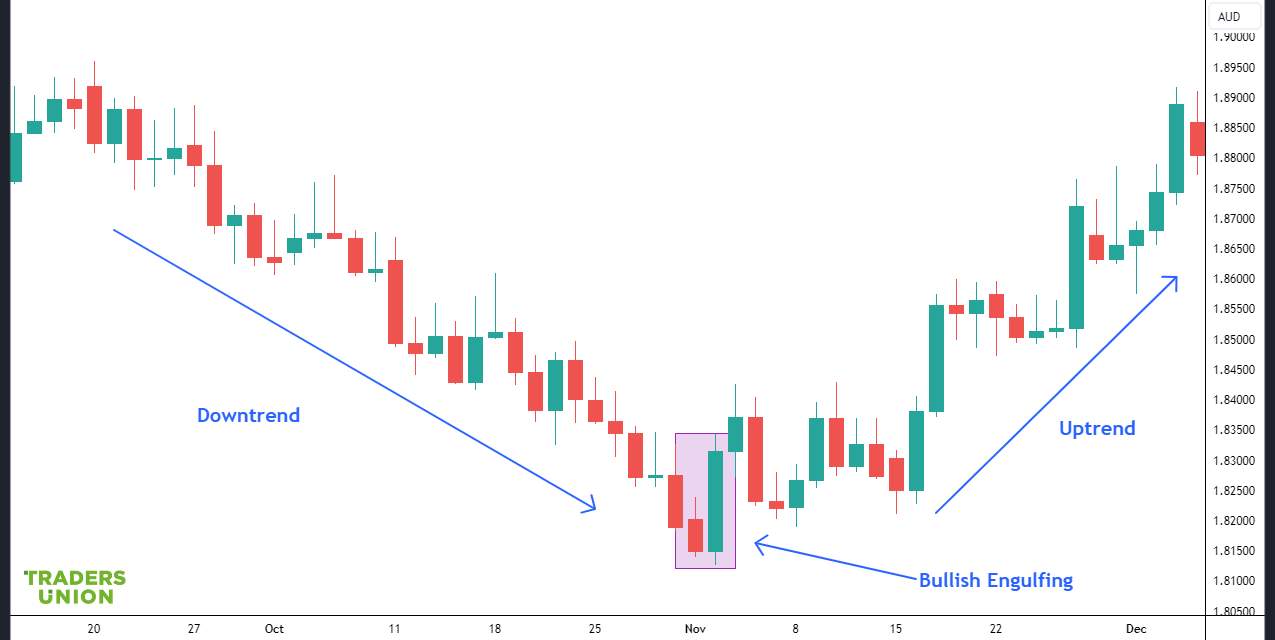
Bullish Engulfing
The Bullish Engulfing pattern emerges when a small red candle is succeeded by a more substantial green candle, which entirely encompasses the candle from the prior day. The pattern suggests that buying pressure has overcome selling pressure, creating a shift in market sentiment that could lead to an upward price trend.
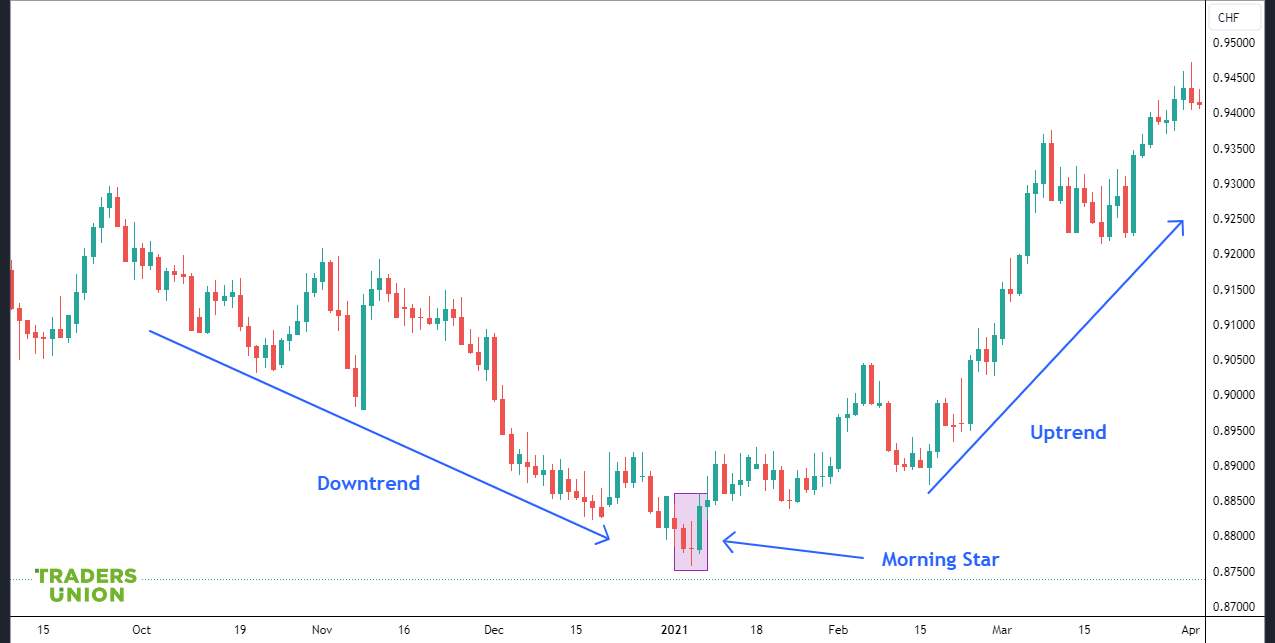
Morning Star
A Morning Star pattern consists of three candlesticks: a long red candle, a small-bodied candle (either red or green) that gaps lower, and a long green candle that closes within the range of the first candle. The pattern indicates a weakening downtrend, as the small-bodied candle represents indecision in the market, followed by a strong green candle that suggests a bullish reversal.
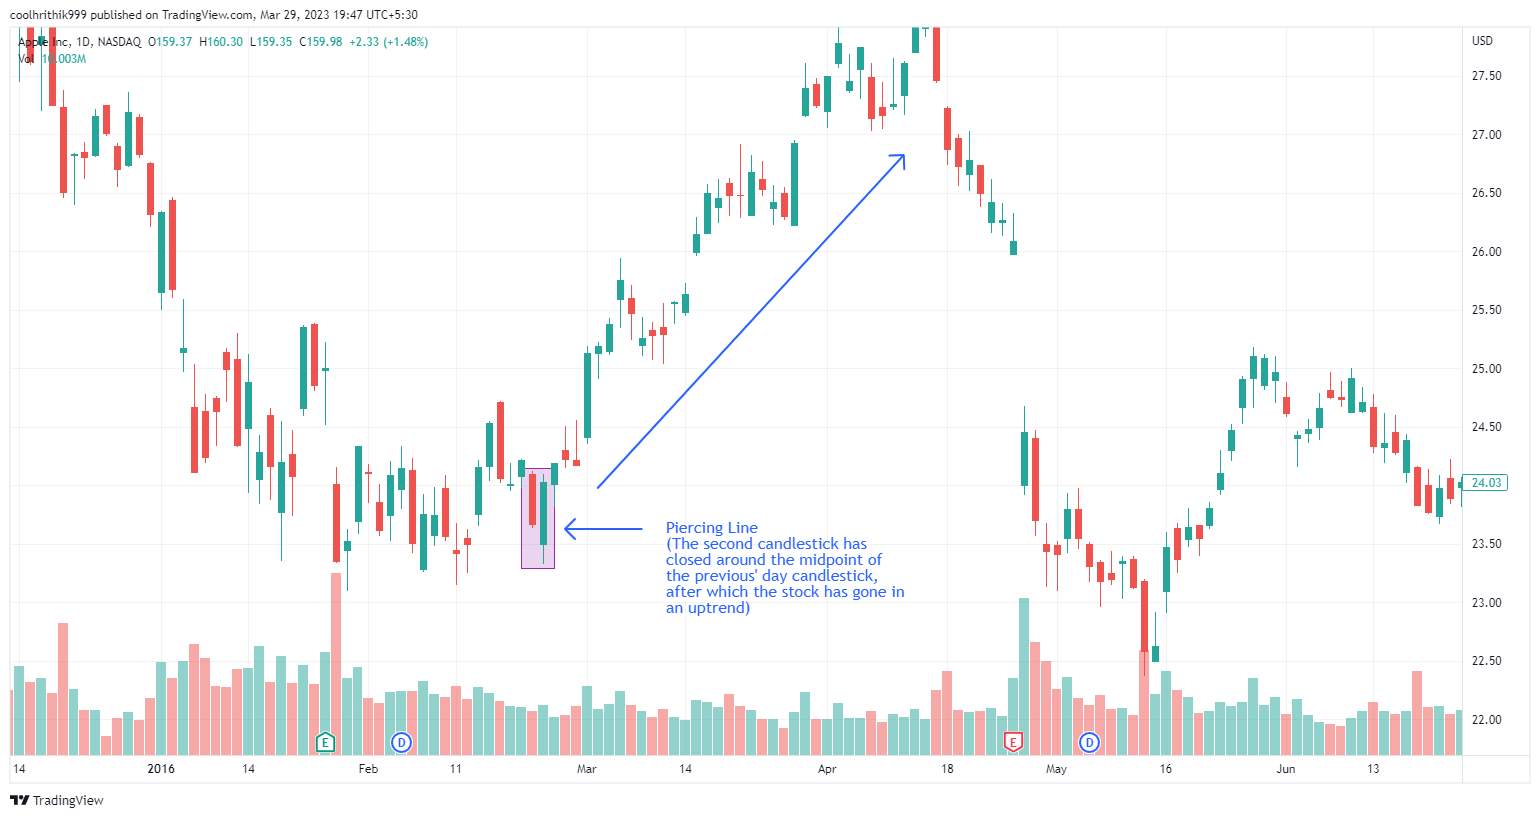
Piercing Line
The Piercing Line pattern is a two-candle pattern with a long red candle followed by a long green candle that opens lower than the previous day's low but closes more than halfway above the midpoint of the first candle. The second candle's strong close indicates a shift in market sentiment and suggests that the bulls are gaining control.
This pattern predominantly appears in stocks due to their potential for overnight gaps, as opposed to currencies or other round-the-clock trading instruments. Nevertheless, this pattern can materialize in any asset class on a weekly chart.
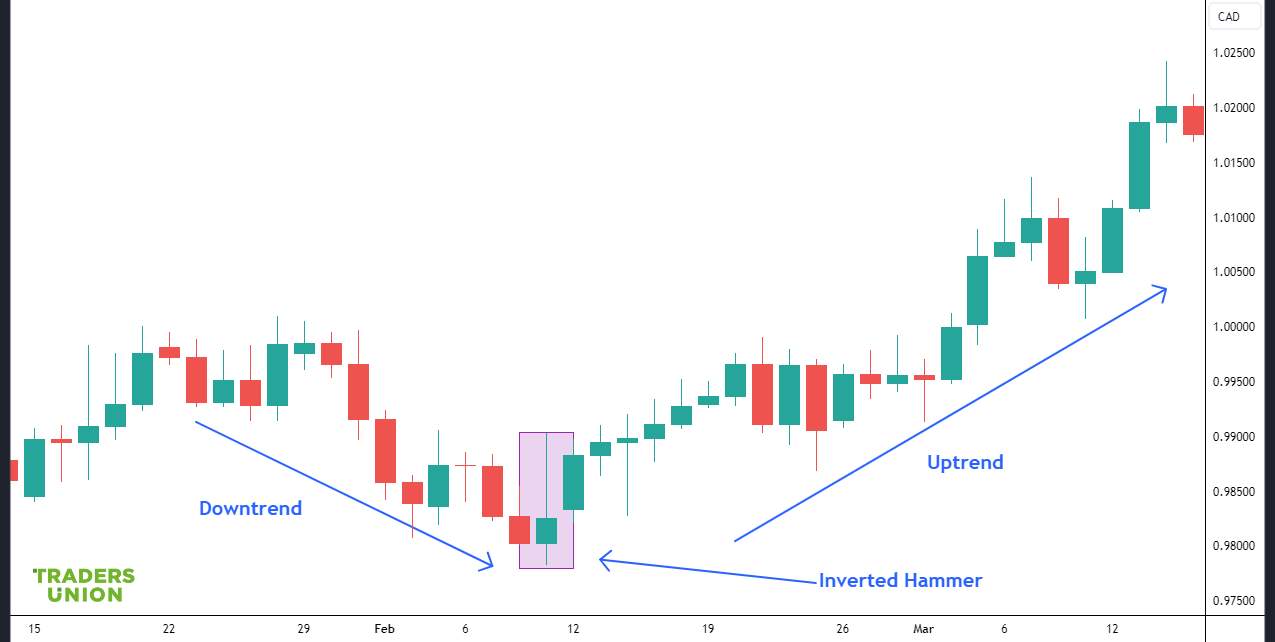
Inverted Hammer
The Inverted Hammer is a single candle pattern with a small body, long upper shadow, and little or no lower shadow. This pattern occurs after a downtrend, and its long upper shadow represents buyers attempting to push the price higher. The small body indicates a potential trend reversal as buying pressure increases.
Bearish Reversal Patterns
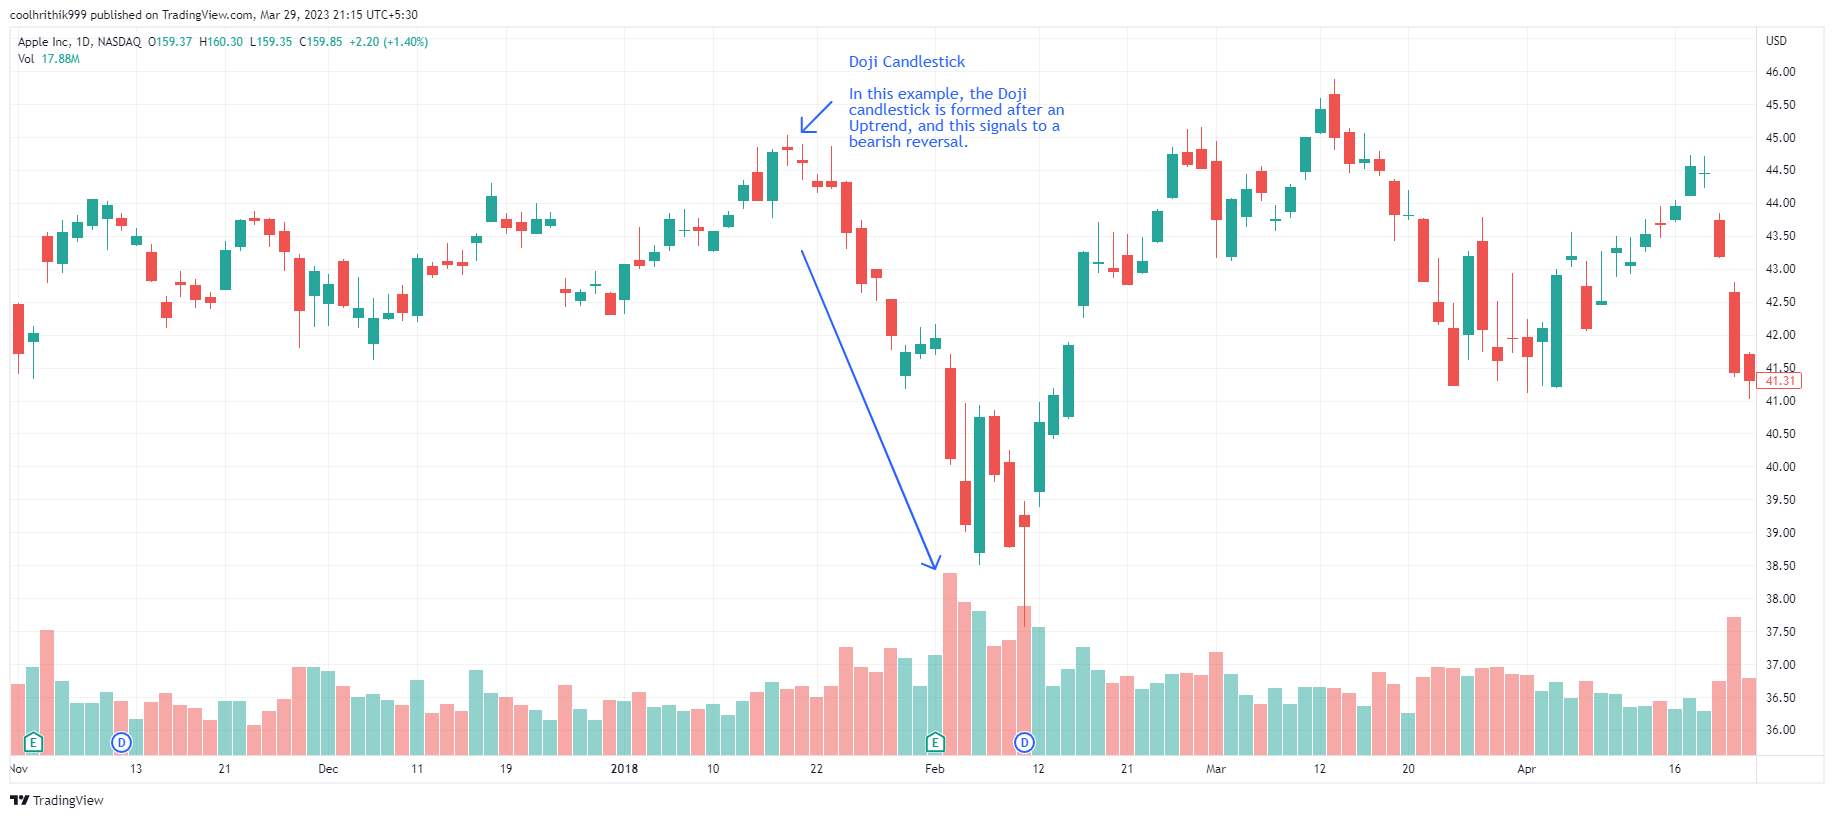
Doji
A Doji candlestick pattern is formed when a security's opening and closing prices are nearly equal, resulting in a candlestick with a small or non-existent body and potentially long shadows. This pattern represents market indecision, as neither buyers nor sellers could gain control, and may signal a potential trend reversal or continuation, depending on the context of the preceding candles and overall market trend.
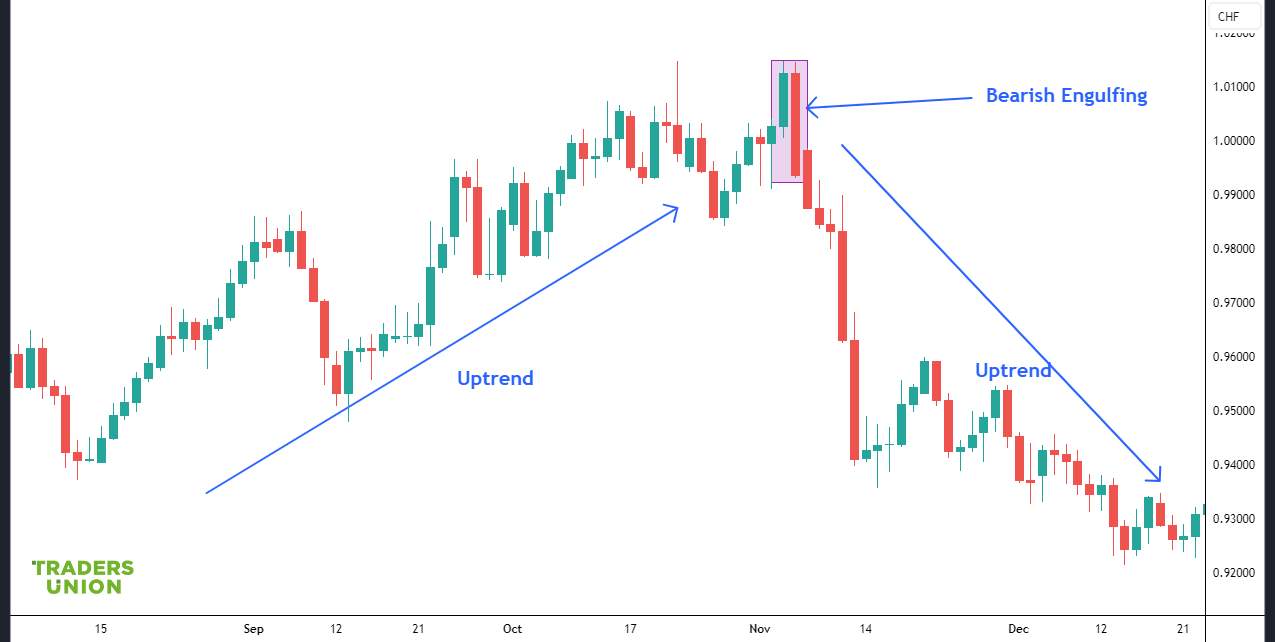
Bearish Engulfing
The Bearish Engulfing pattern occurs when a small green candle is followed by a larger red candle that completely engulfs the previous day's candle. This pattern suggests that selling pressure has increased, and the market sentiment has shifted toward bearishness, potentially leading to a downward price movement.
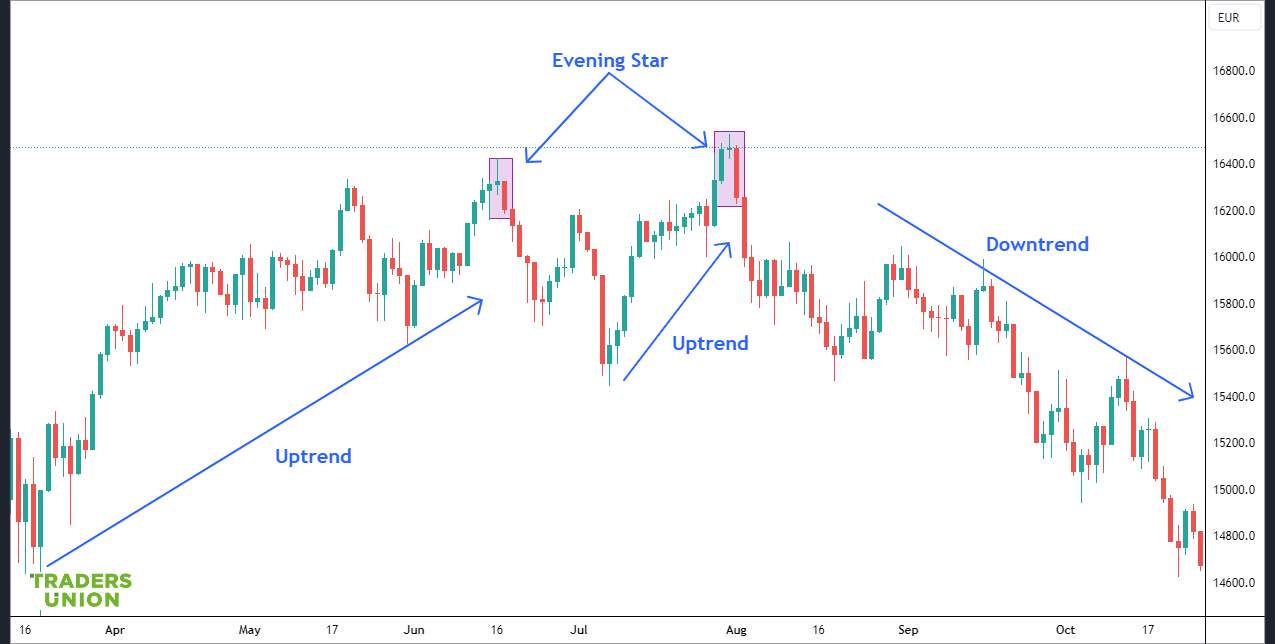
Evening Star
An Evening Star pattern consists of three candlesticks: a long green candle, a small-bodied candle (either green or red) that gaps higher, and a long red candle that closes within the range of the first candle. The pattern indicates a weakening uptrend, with the small-bodied candle representing market indecision, followed by a strong red candle that suggests a bearish reversal.
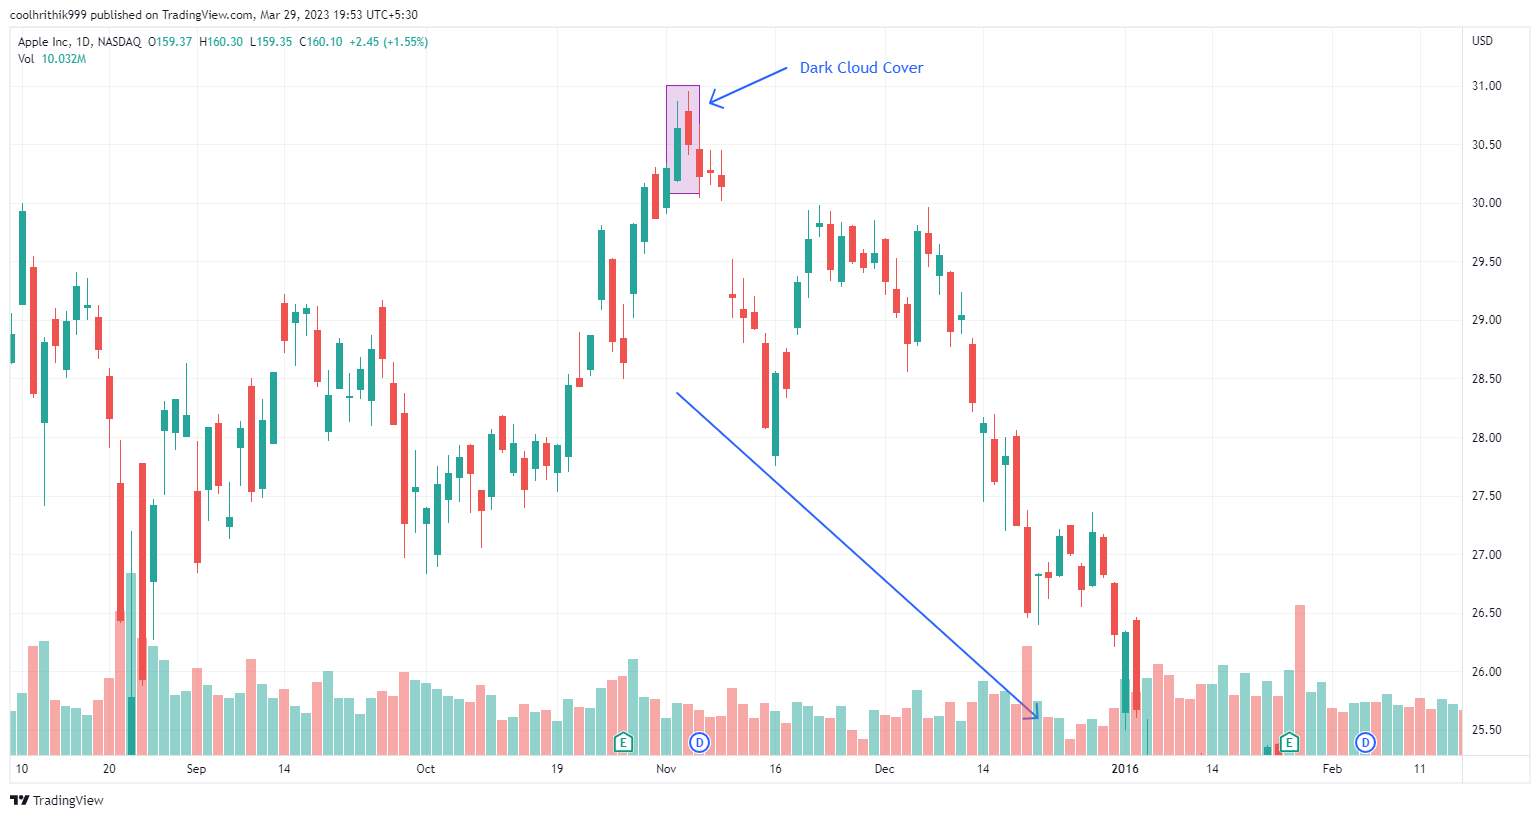
Dark Cloud Cover
The Dark Cloud Cover pattern is a two-candle pattern with a long green candle followed by a long red candle that opens higher than the previous day's high but closes more than halfway below the midpoint of the first candle. The second candle's strong close indicates a shift in market sentiment, suggesting that the bears are gaining control.
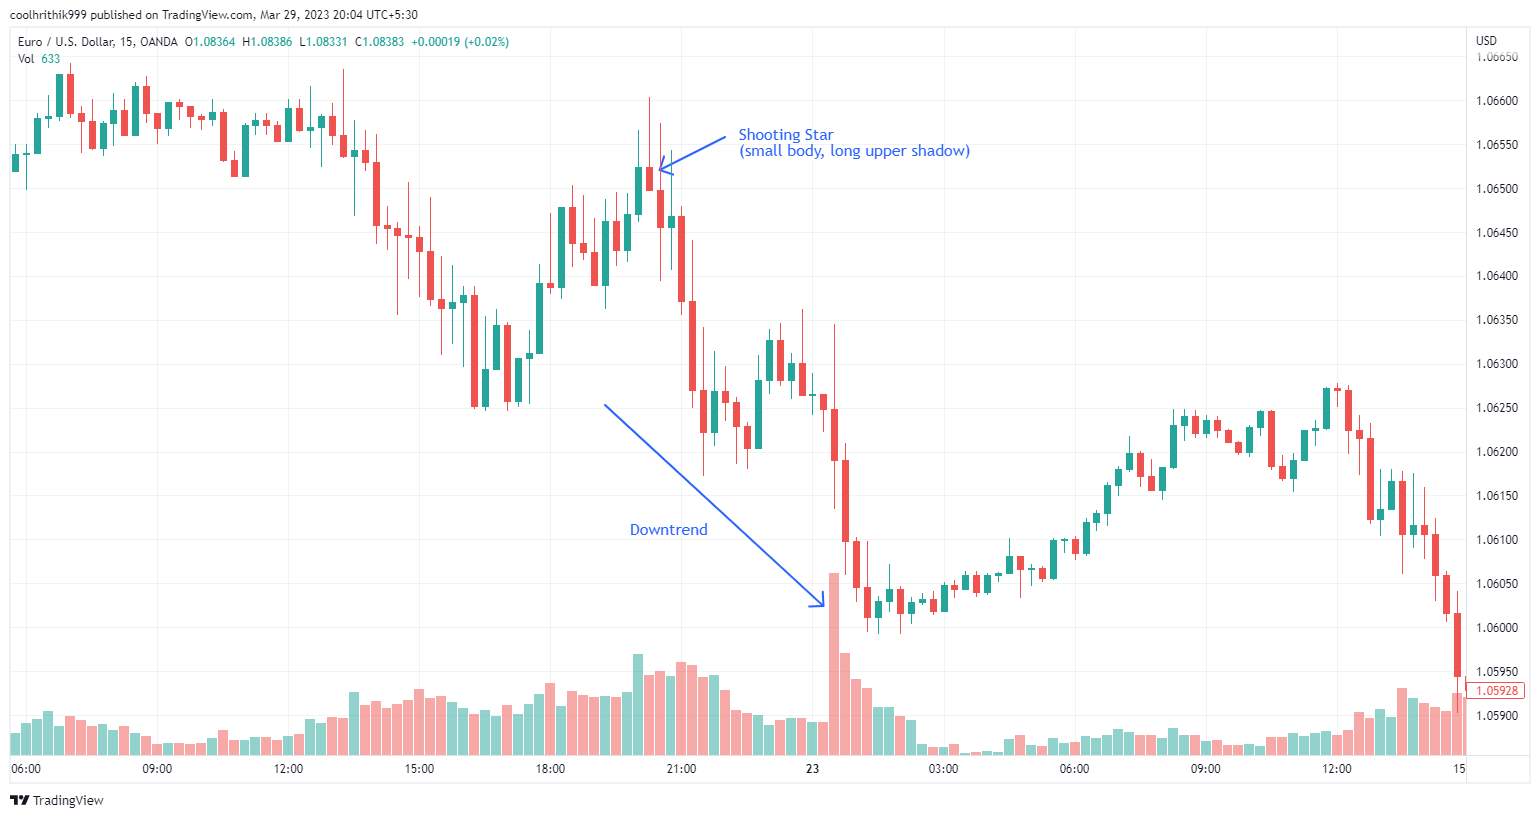
Shooting Star
The Shooting Star is a single candle pattern with a small body, long upper shadow, and little or no lower shadow. This pattern occurs after an uptrend, and its long upper shadow represents sellers attempting to push the price lower. The small body indicates a potential trend reversal as selling pressure increases.
Continuation Candlestick Patterns
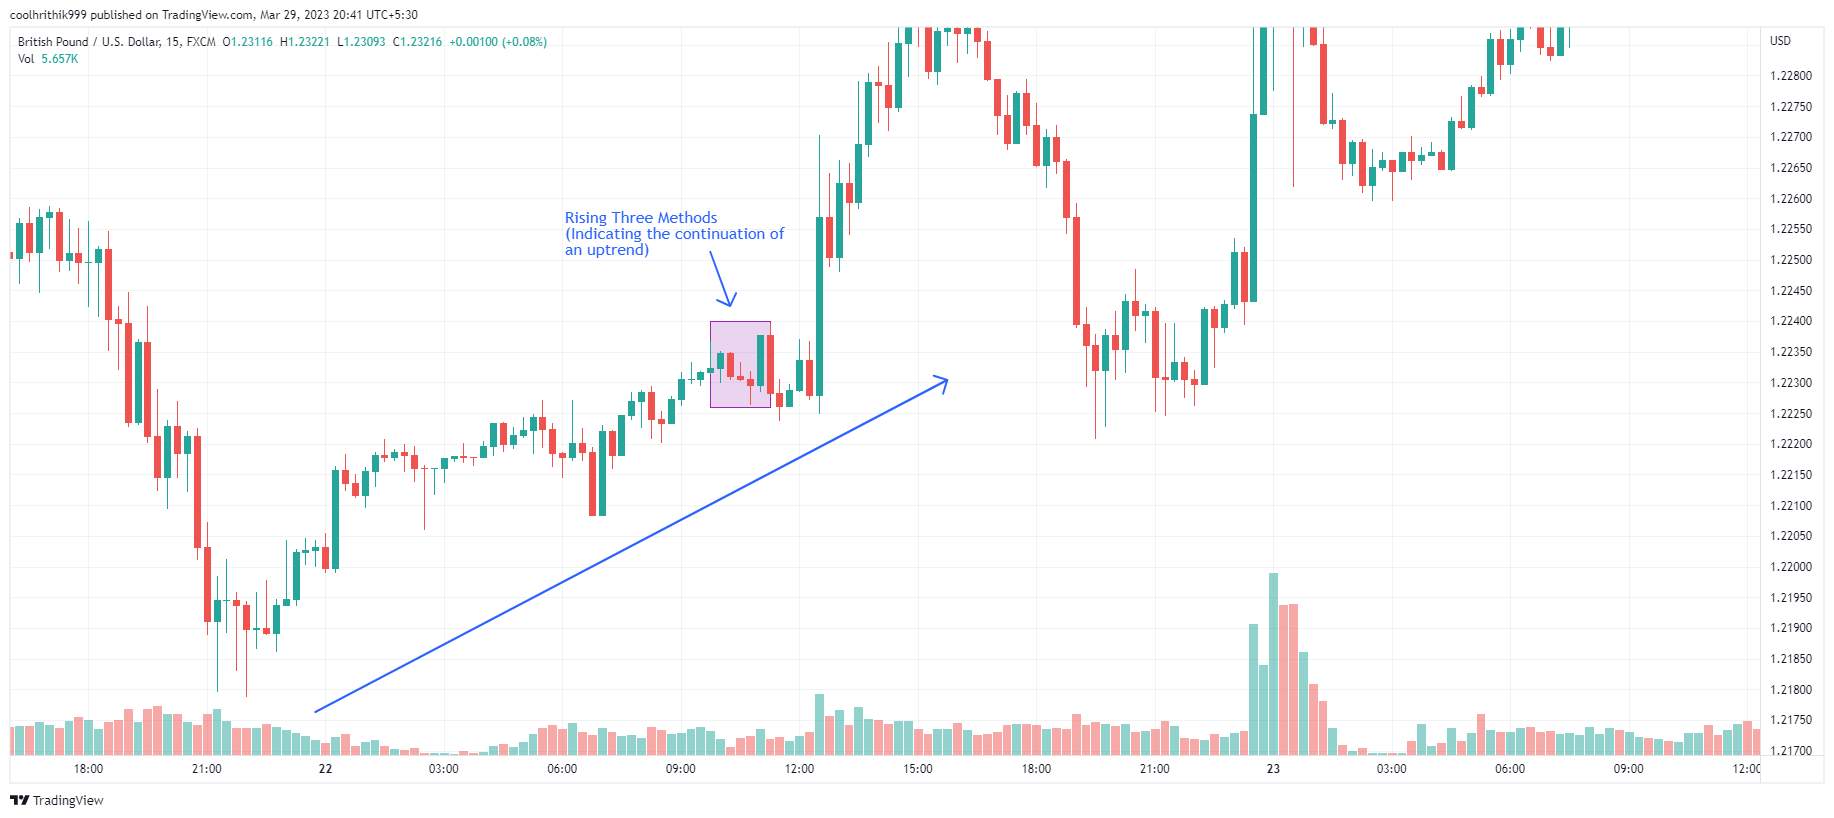
Rising Three Methods
This bullish continuation pattern consists of a long green candle, followed by three small red candles within the range of the first candle, and concludes with a green candle that surpasses the high of the first green candle. This pattern indicates that the uptrend is likely to continue.
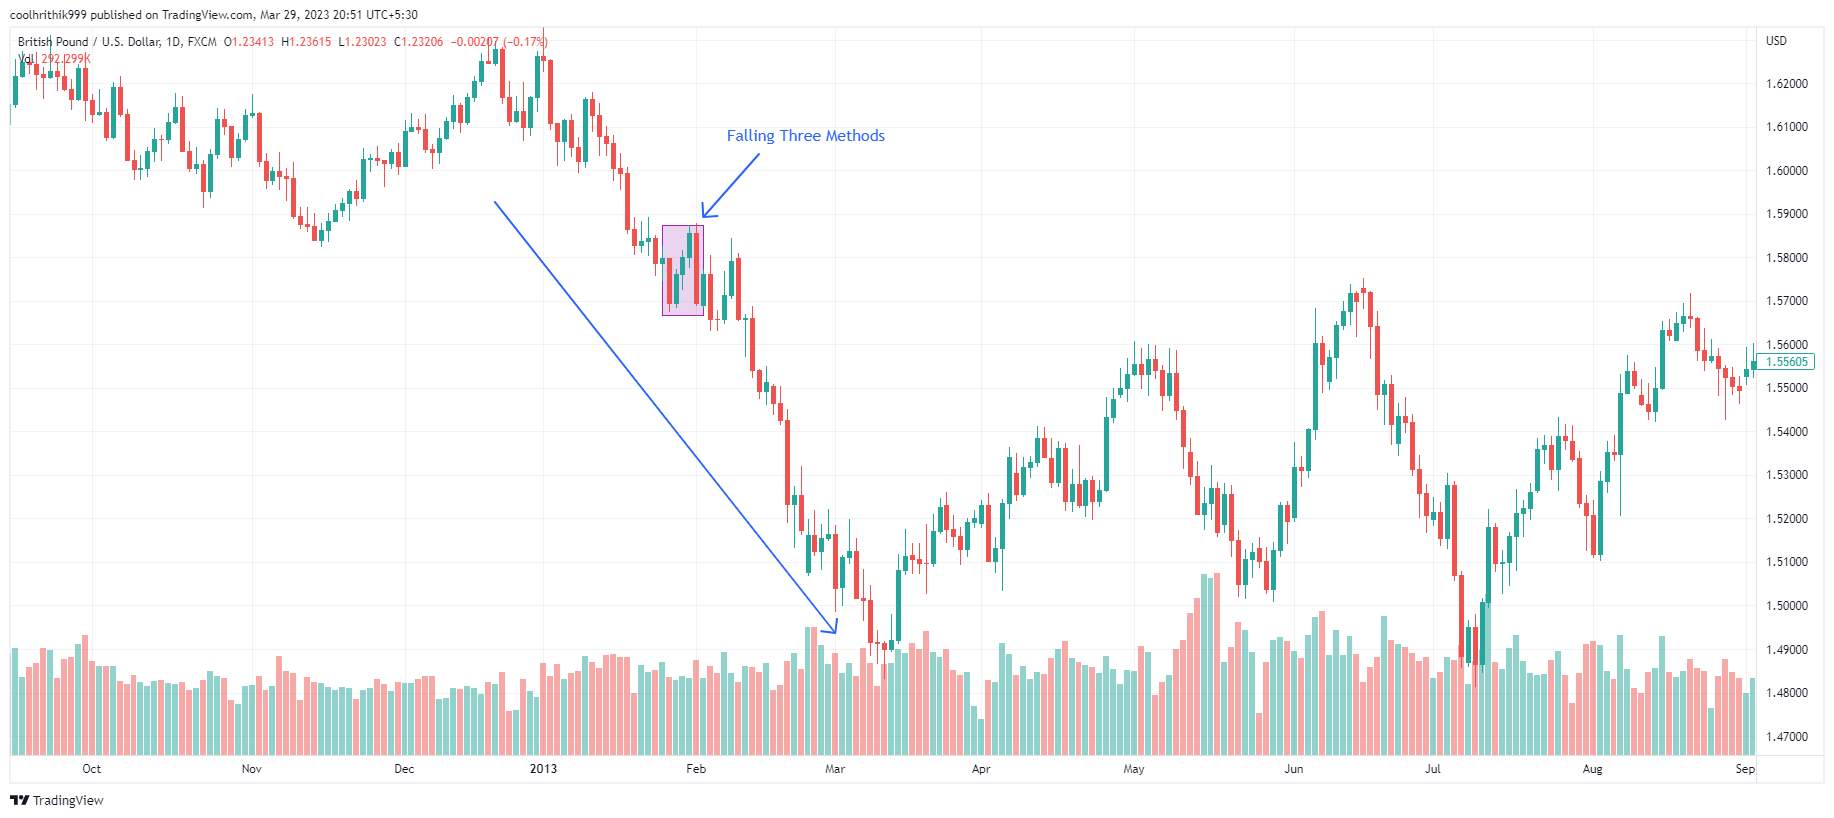
Falling Three Methods
This bearish continuation pattern is the inverse of the Rising Three Methods. It starts with a long red candle, followed by three small green candles within the range of the initial red candle, and ends with a red candle that goes below the low of the first red candle. This pattern suggests that the downtrend will persist.
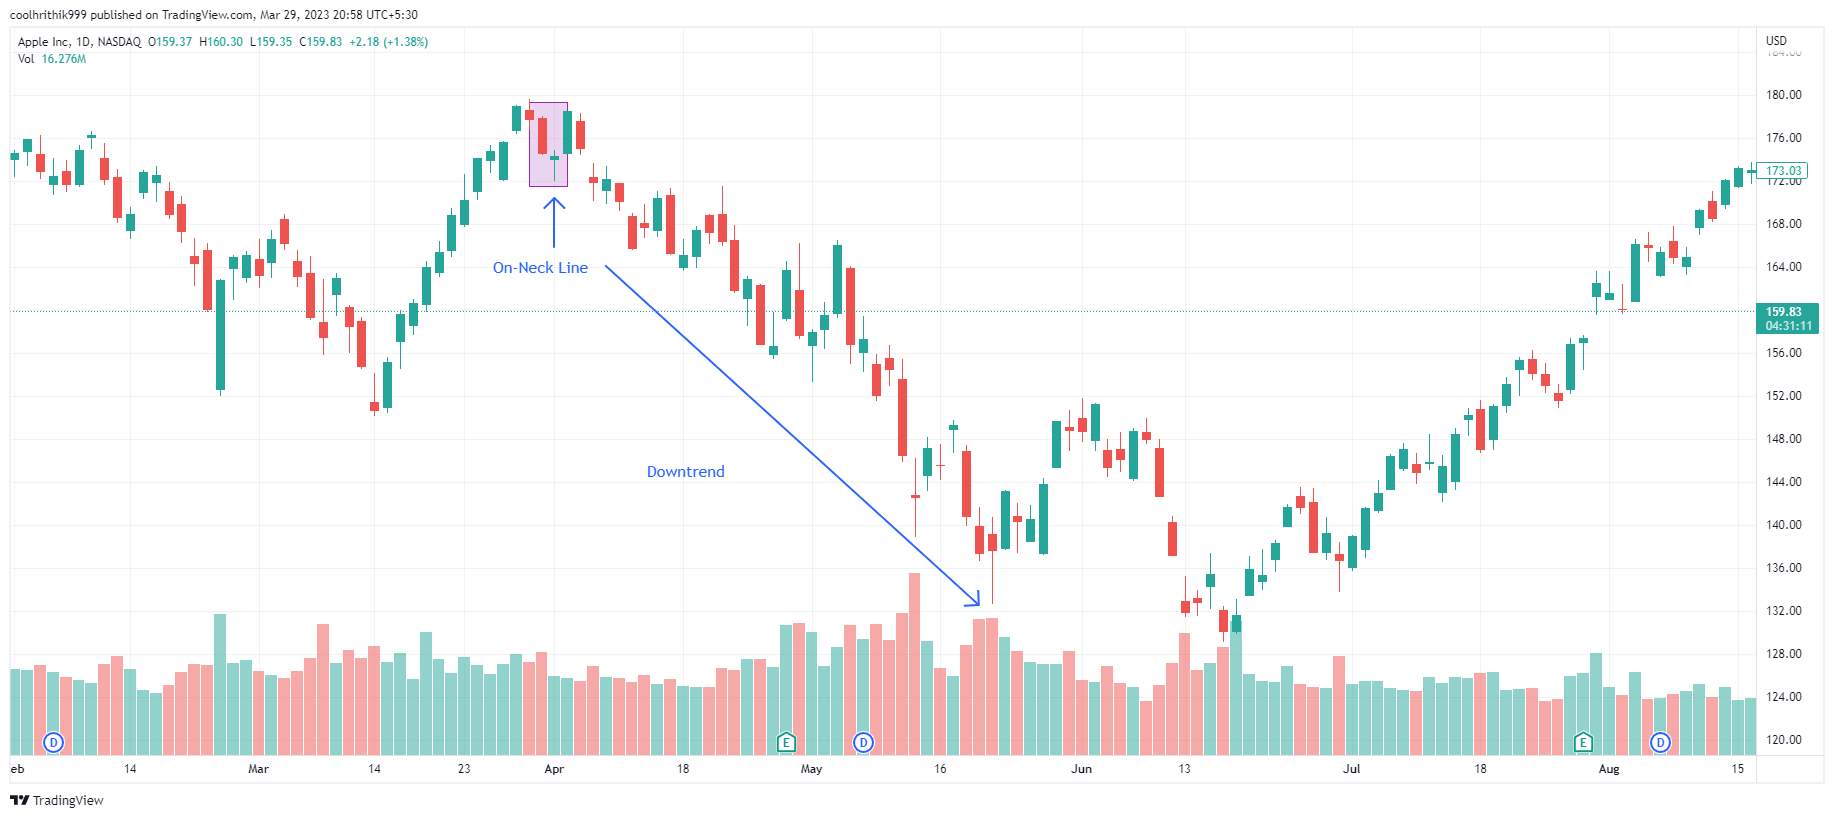
On-Neck Line
This bearish continuation pattern occurs during a downtrend. It consists of a long red candle followed by a green candle that opens lower than the previous candle's close and closes near the low of the previous red candle. This pattern suggests that the downtrend is likely to persist.
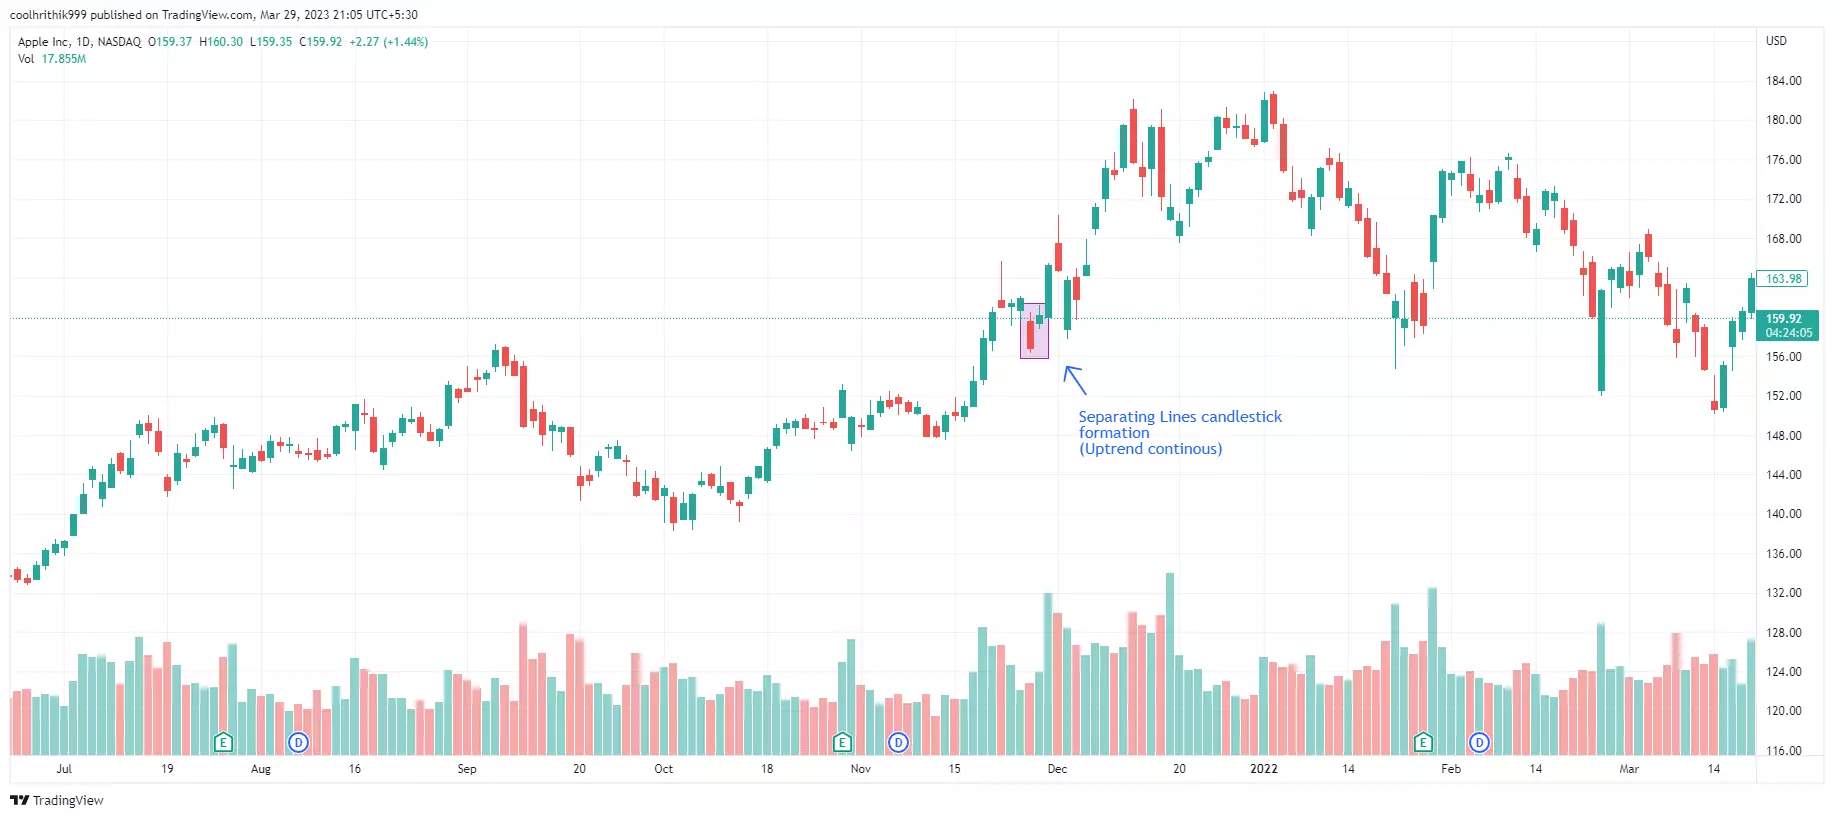
Separating Lines
This continuation pattern can be either bullish or bearish. In a bullish trend, a green candle is followed by a red candle that opens at the same level as the previous green candle's opening. In a bearish trend, a red candle is followed by a green candle that opens at the same level as the previous red candle's opening. The trend is expected to continue in its original direction.
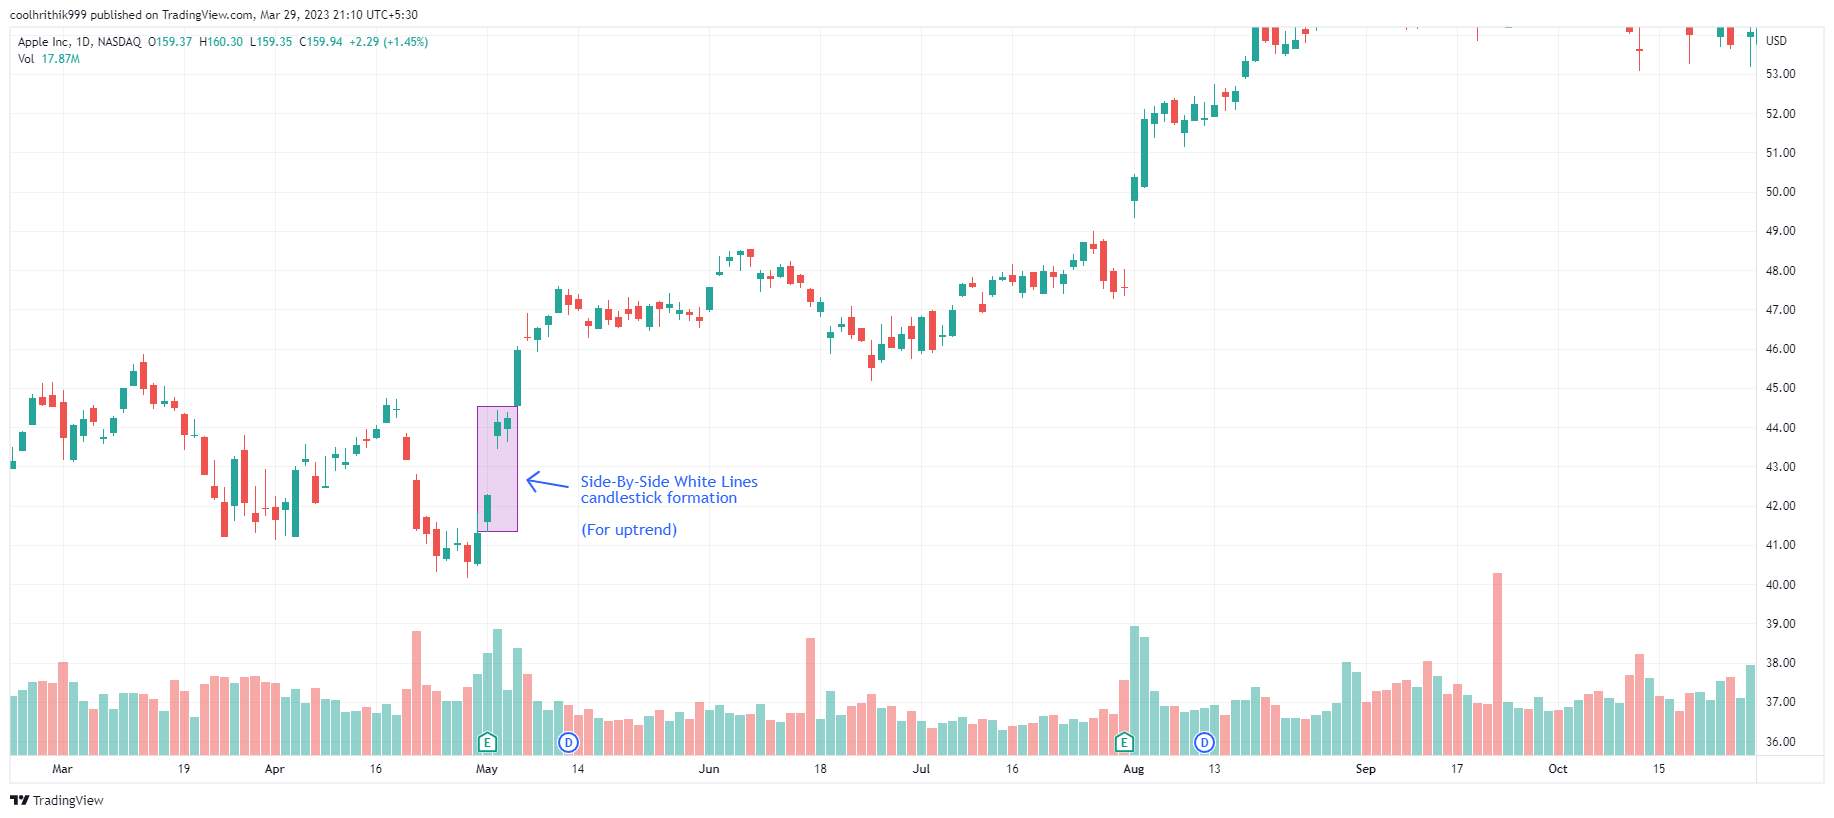
Side-by-Side White Lines
This bullish continuation pattern features two long green candles with similar opening prices. The second green candle should close higher than the first one, indicating that the uptrend will likely continue.
Other Candlestick Patterns
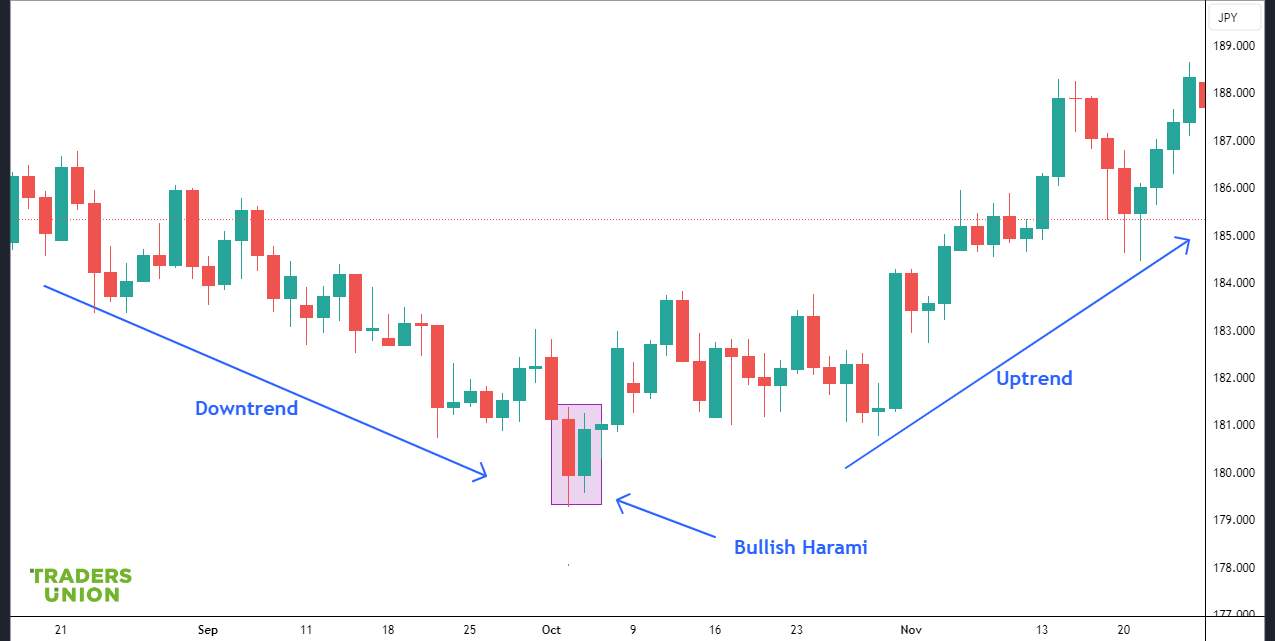
Harami
The Harami pattern consists of a small-bodied candle (either red or green) that is completely contained within the range of the previous day's large-bodied candle. This pattern indicates a potential trend reversal or consolidation, as the small-bodied candle signals a decrease in momentum from the previous day's strong price movement.
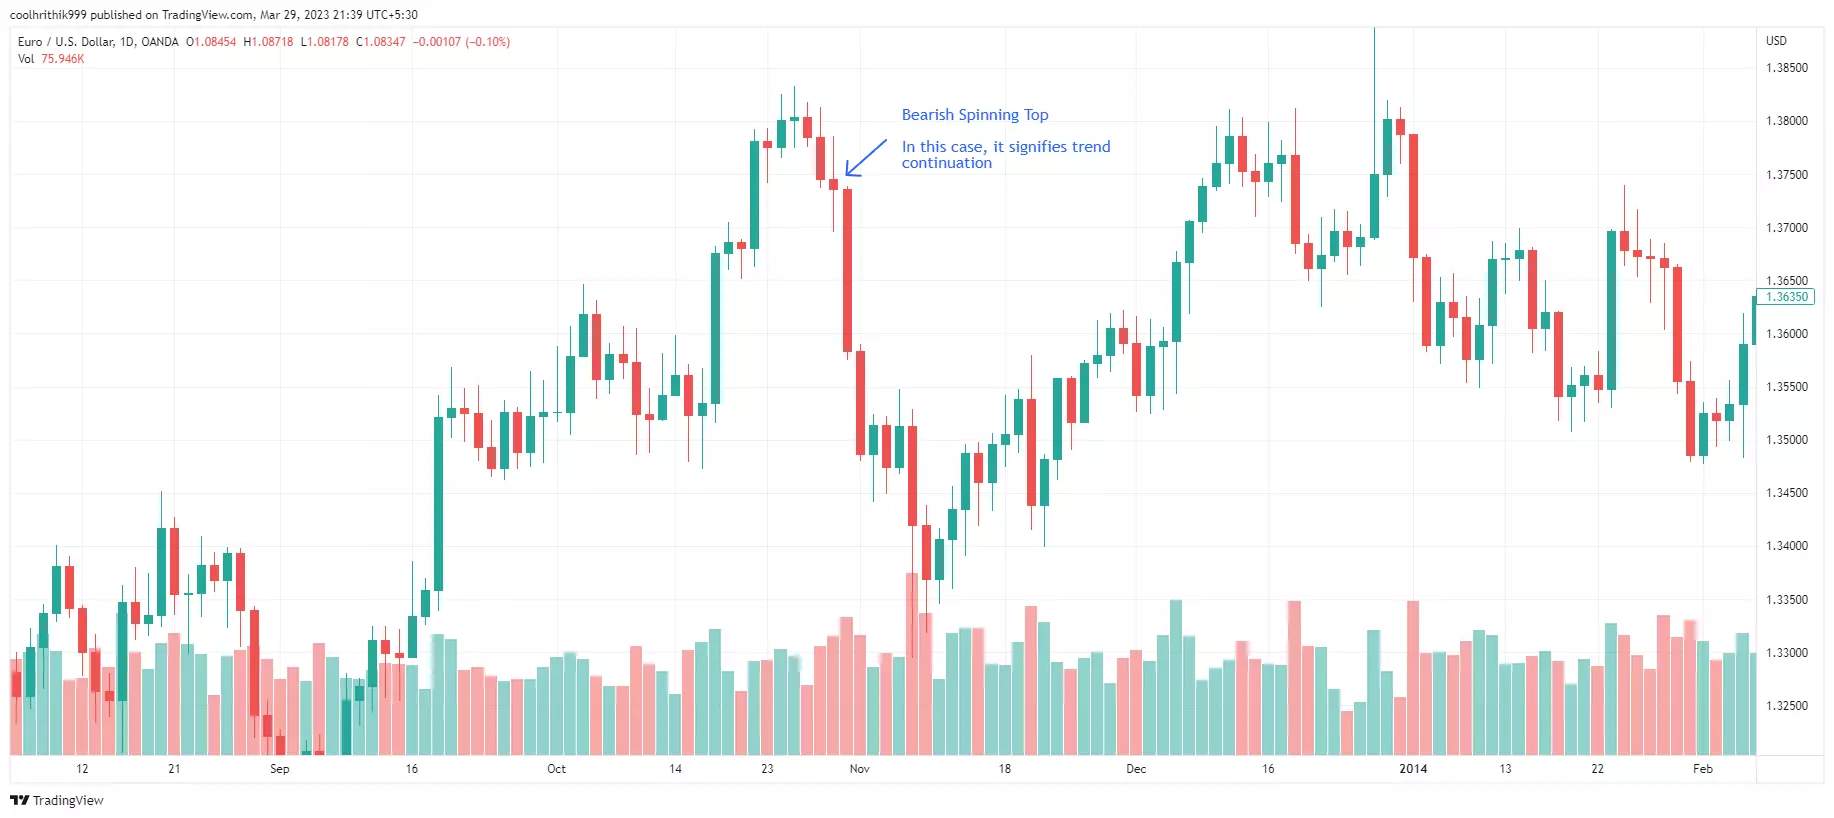
Spinning Top
A Spinning Top is a candlestick pattern with a small body and long upper and lower shadows, indicating a significant price movement during the trading session but a close near the opening price. This pattern represents market indecision and suggests that neither bulls nor bears could maintain control, potentially leading to a trend reversal or continuation, depending on the overall market trend.
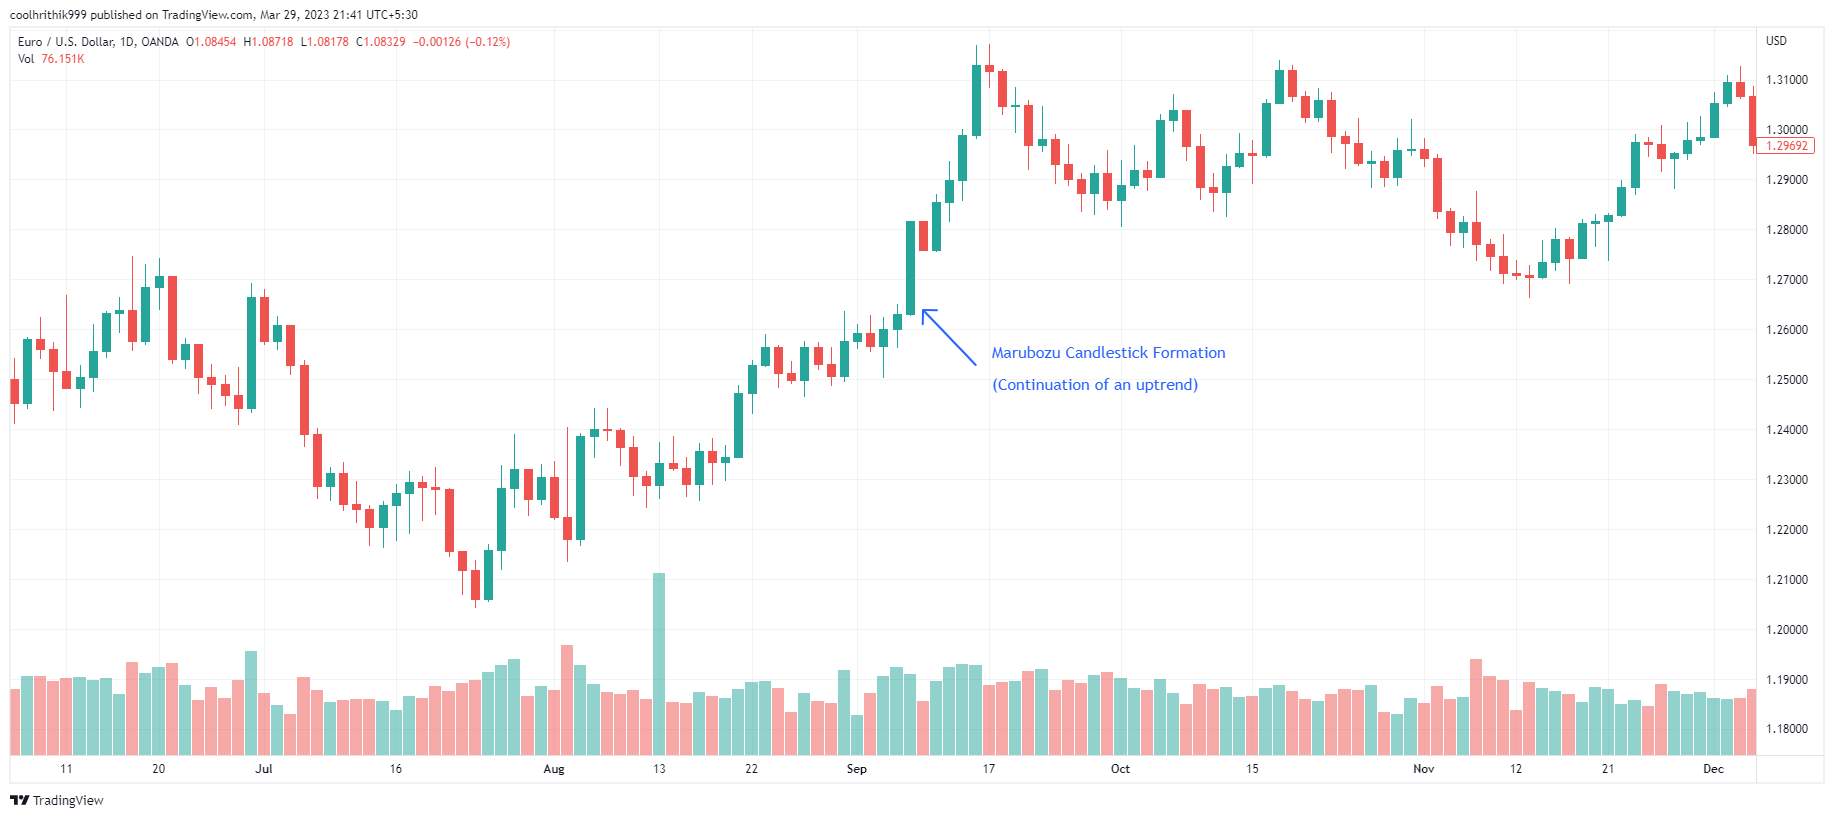
Marubozu
The Marubozu candlestick pattern has a long body with little or no shadows, indicating that the opening price is either the high or low of the session and the closing price is the opposite end. A green Marubozu indicates strong buying pressure, while a red Marubozu suggests strong selling pressure. This pattern can signal a continuation or acceleration of the current trend.
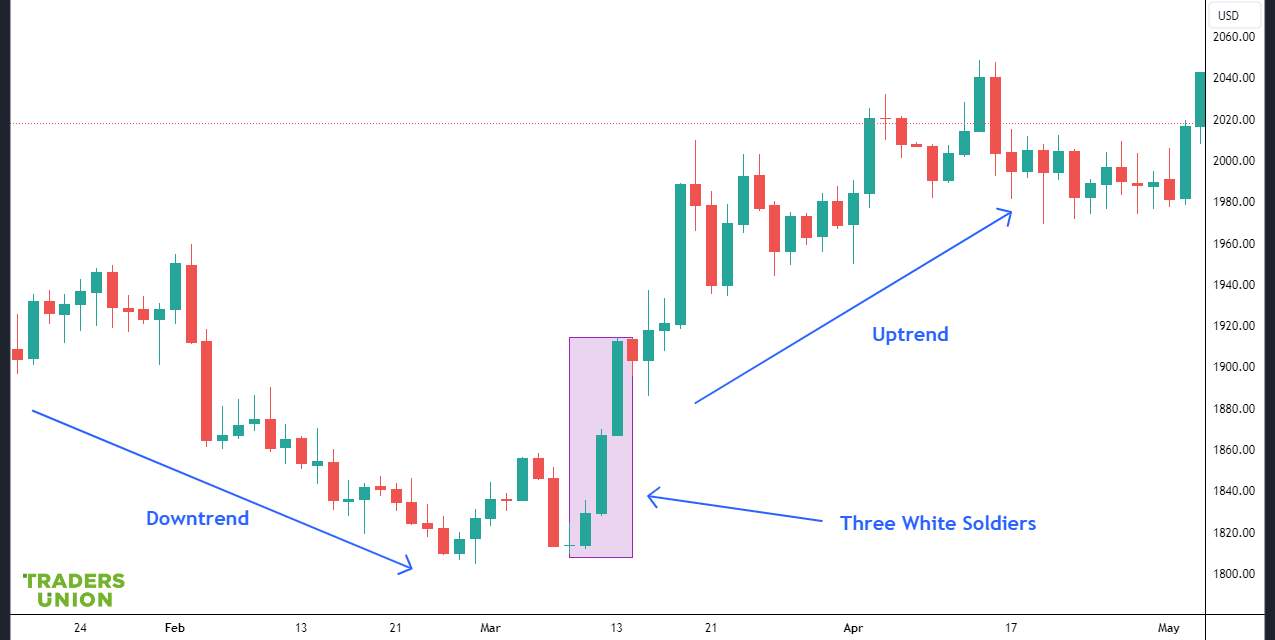
Three White Soldiers
The Three White Soldiers pattern consists of three consecutive long green candles, each with a higher close than the previous candle, and each opening within the body of the previous candle. This pattern indicates strong bullish momentum and may signal a potential trend reversal or continuation of an existing uptrend. Traders often view the Three White Soldiers pattern as a confirmation of a bullish market, and may consider it an opportunity to enter long positions or add to existing long positions.
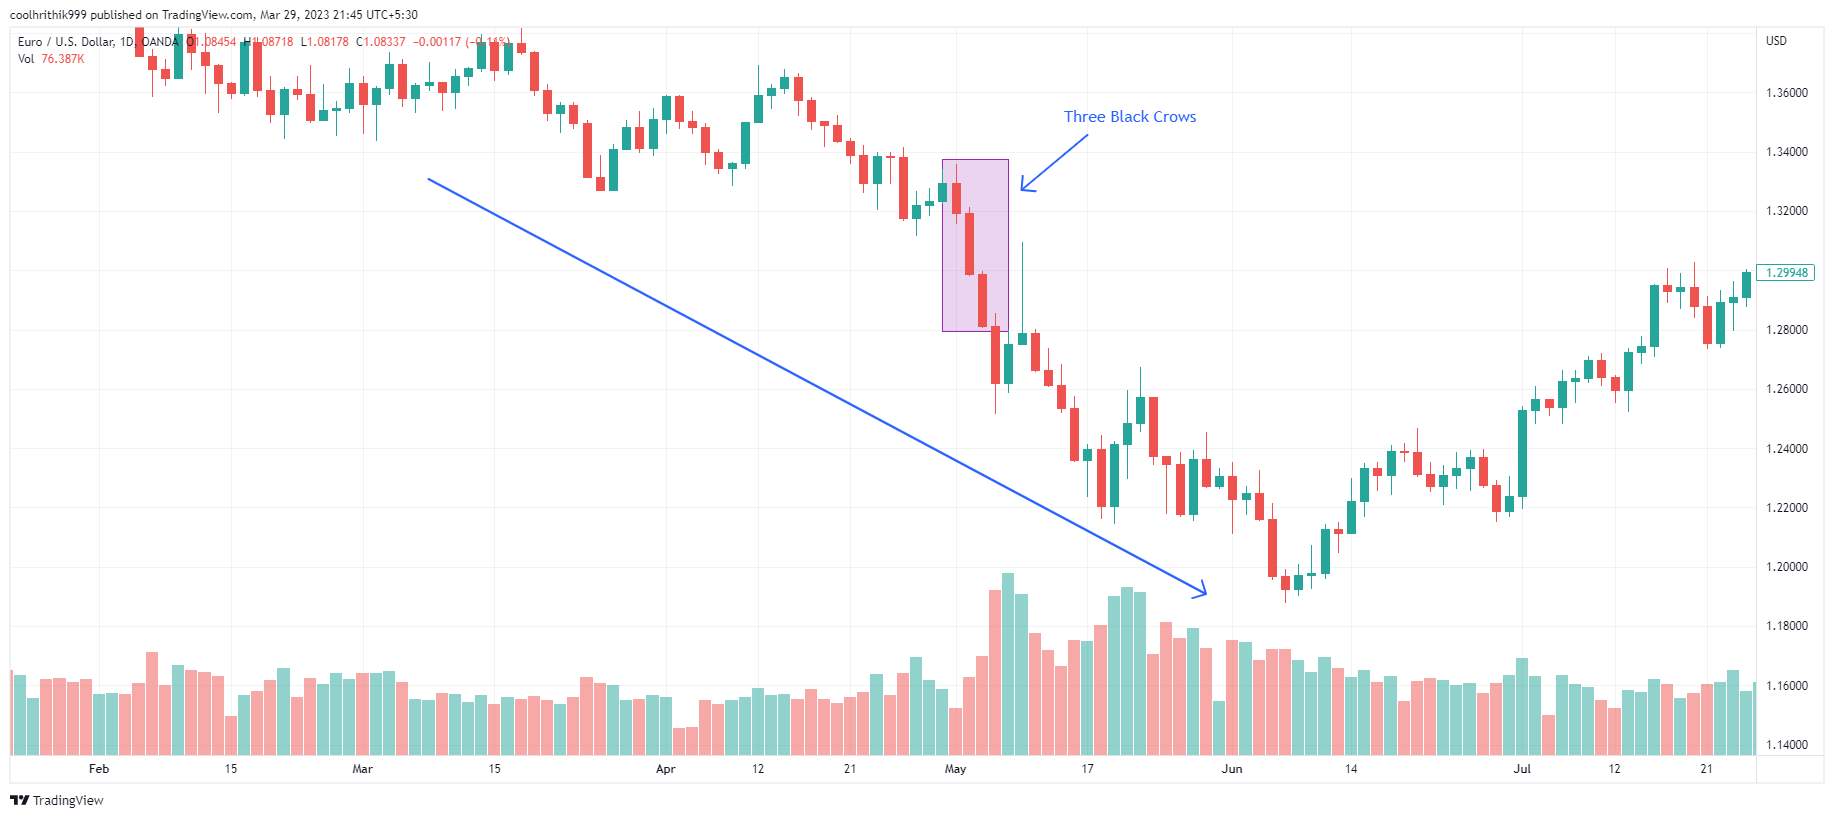
Three Black Crows
The candlestick pattern consists of three consecutive long red candles, each with a lower close than the previous candle, and each opening within the body of the previous candle. This pattern indicates strong bearish momentum and may signal a potential trend reversal or continuation of an existing downtrend. Traders often view the Three Black Crows pattern as a confirmation of a bearish market, and may consider it an opportunity to enter short positions or add to existing short positions.
Are candlestick patterns reliable?
Candlestick patterns are widely used by traders to predict price direction, but their reliability can be influenced by various factors. It is essential to understand that candlestick patterns alone may not always provide accurate insights, and it is crucial to combine them with other trading strategies to increase their effectiveness.
Several factors can impact the reliability of candlestick patterns, and being aware of them can help you trade with greater confidence. These factors include:
Timeframe: Shorter timeframes are typically less reliable than longer ones due to increased volatility. Trader sentiment is more likely to change frequently in the short term, whereas daily or weekly timeframes offer more reliable insights into long-term trends.
Trading instrument: Different trading instruments exhibit unique behaviors, with liquidity being a crucial factor. Some candlestick patterns may be more suitable for Forex trading, while others work better with stocks. In general, the higher the trading volume, the more reliable the candlestick patterns will be.
Key levels: The context in which a candlestick pattern occurs is essential. If support and resistance lines are nearby, the trade has a higher potential for success.
Pattern size: Larger patterns tend to be more reliable, as significant price movements often produce stronger signals.
Candlestick pattern type: The reliability of candlestick patterns varies depending on the specific pattern. In general, patterns with more candles are more reliable, although they may appear less frequently.
It's important to remember that memorizing candlestick formations is not necessary to grasp price movements. This is a common mistake among new traders. Instead, focus on gaining a deeper understanding of how markets work, and you'll be better equipped to use trading tools like candlestick charts effectively.
How to trade candlestick patterns?
Candlestick patterns are an essential tool in any trader's arsenal. They help you understand market sentiment and price action, enabling you to make well-informed trading decisions. To trade candlestick patterns effectively, consider these five expert tips that will elevate your trading skills and empower you to harness the full potential of these powerful patterns.
Context and location
The foundation of successful candlestick trading lies in understanding context and location. Context requires you to always compare the current candlestick to the most recent price action, ensuring you don't place excessive importance on individual candlesticks. Location, on the other hand, emphasizes trading candlesticks only at significant price levels. For example, a pinbar at a previous double top/bottom carries more weight than a random pinbar within your charts.
Size
Candle size provides valuable insights into strength, momentum, and trends. Larger candles often signal a more robust trend, while smaller candles appearing after a long rally may foreshadow a reversal or the end of a trend.
Wicks
Long wicks at critical support/resistance levels often hint at potential reversals. They typically signify rejections and failed attempts to move the price higher or lower. Long rejection-wicks are common around double tops/bottoms and can be a reliable pattern on their own. Conversely, a large candle without wicks usually indicates great strength.
Body
The body represents the distance the price has travelled from the open to the close. Interpreting the body in the context of the wicks and size is crucial. A small body with large wicks indicates indecision, a large body without wicks shows strength, a small body without wicks suggests a lack of interest, and a large body with long wicks demonstrates high volatility and extensive trading activity.
Analyzing candlestick patterns in conjunction with market sentiment
To add depth to your trading strategy, consider examining candlestick patterns in relation to prevailing market sentiment. This approach helps you understand the underlying emotions and psychology driving market participants, enabling you to make more informed decisions based on a comprehensive understanding of market dynamics.
Market sentiment can be assessed through various methods, such as analyzing news events, evaluating market breadth indicators, or observing the behavior of market participants in social media and trading forums. By combining the insights gained from candlestick patterns with an understanding of market sentiment, you can identify potential turning points in the market, gauge the strength of trends, and detect early signs of reversals.
Best way to use candlestick patterns
To make the most of these patterns, consider adopting the following strategies that not only simplify complex concepts but also enhance your trading skills and decision-making capabilities.
Confluence
Combining candlestick patterns with other technical analysis tools is a powerful strategy known as confluence. By identifying areas where multiple technical factors align, you can increase the probability of successful trades. Examples of confluence include support and resistance levels, trend lines, or Fibonacci retracements. These tools can help validate the signals generated by candlestick patterns and provide a more robust trading strategy.
Volume confirmation
Volume plays a crucial role in the reliability of candlestick patterns. By analyzing trade volumes alongside the patterns, you can gauge the strength of market sentiment and determine the likelihood of a trend continuation or reversal. High trading volumes tend to confirm the validity of a candlestick pattern, while low volumes may cast doubt on its significance. Ensure you pay close attention to volume when interpreting candlestick patterns to enhance the accuracy of your predictions.
Incorporating technical indicators
Integrating technical indicators with candlestick patterns is an effective way to strengthen your trading strategy. Indicators such as Moving Averages, Relative Strength Index ( RSI), or Moving Average Convergence Divergence ( MACD) can complement and confirm the signals generated by candlestick patterns. This combination results in a more comprehensive analysis of the market, increasing the likelihood of successful trades.
Time frame analysis
Analyzing candlestick patterns across multiple time frames can provide valuable insights into market dynamics. By examining patterns on shorter and longer time frames, you can identify trends, support and resistance levels, and potential reversals. This approach allows you to develop a more nuanced understanding of the market and make more informed trading decisions.
Patience and discipline
The key to successful trading with candlestick patterns lies in patience and discipline. Resist the urge to act impulsively based on individual patterns. Instead, wait for confirmation from other technical tools and remain disciplined in adhering to your predefined trading plan. By exercising patience and discipline, you can minimize losses and maximize potential gains.
Even the most accurate candlestick setup depends on execution quality. When trading Forex patterns, factors such as spreads, order execution speed, platform stability, and available analytical tools can directly affect the final result. A strong pattern may lose part of its value if the trade is opened with poor pricing, delays, or high transaction costs.
For this reason, traders who use candlestick patterns should also pay attention to the broker’s trading environment. Below is a comparison of Forex brokers that provide access to key currency pairs, technical analysis tools, and trading conditions suitable for price action and candlestick-based strategies:
| zForex | Plus500 | OANDA | Trading.com USA | FOREX.com | |
|---|---|---|---|---|---|
|
Tradable assets |
80 | 2800 | 129 | 69 | 5500 |
|
Min. deposit, $ |
10 | 100 | No | 50 | 100 |
|
Demo |
Yes | Yes | Yes | Yes | Yes |
|
Standard EUR/USD spread |
0.3 | 0.7 | 0.3 | 1.1 | 1.0 |
|
Deposit fee, % |
No | No | No | No | No |
|
Withdrawal fee, % |
No | No | No | No | No |
|
Max. Regulation Level |
Not regulated | Tier-1 | Tier-1 | Tier-1 | Tier-1 |
|
Open an account |
Go to broker Your capital is at risk.
|
Go to broker 80% of retail CFD accounts lose money. |
Go to broker Your capital is at risk. |
Go to broker Your capital is at risk. |
Study review |
Use candlestick patterns as a confirmation tool

I would not treat candlestick patterns as standalone signals. My recommendation is to use them as a confirmation tool rather than a trigger for entry. I focus on where the pattern appears – at key levels, within a trend, or after strong moves – because context matters more than the pattern itself.
In practice, I suggest mastering just a few patterns and combining them with support and resistance, volume, or indicators. This approach reduces noise and helps avoid overtrading. Consistency in how you apply patterns is far more important than trying to use all of them at once.
Conclusion
Mastering candlestick patterns is a transformative skill that empowers traders to decode market sentiment and anticipate price movements with clarity. While individual patterns such as the Hammer or Bearish Engulfing can signal pivotal reversals, their true power lies in context—appearing at key support or resistance levels and confirmed by additional tools like volume or technical indicators. Rather than relying on these patterns in isolation, successful traders integrate them into a broader strategy, using them as confirmation rather than a sole trigger for trades. The ultimate edge comes from disciplined practice, consistent application, and understanding that context and confluence are what turn candlestick signals from simple shapes into actionable opportunities.
FAQs
What factors affect the accuracy of candlestick patterns in different markets?
How can traders combine candlestick patterns with other analysis methods?
Are there drawbacks to relying solely on candlestick patterns for trading decisions?
What common mistakes should new traders avoid when learning candlestick patterns?
Editors' Top Picks and Insights

The privacy paradox: How the crypto mixer market has changed

Is Bitcoin right for you? Five traits shared by many cryptocurrency holders

Chasing hits: Why investors are losing interest in Netflix

Tokenized stocks in the spotlight: How do they work and are they worth trading?

Do politicians make the best stock traders?

Crypto test drive: How automakers are exploring digital assets
Related Articles
Team that worked on the article
Chinmay Soni is a financial analyst with more than 5 years of experience in working with stocks, Forex, derivatives, and other assets. As a founder of a boutique research firm and an active researcher, he covers various industries and fields, providing insights backed by statistical data.
Olga Shendetskaya has been a part of the Traders Union team as an author, editor and proofreader since 2017. Since 2020, Shendetskaya has been the assistant chief editor of the website of Traders Union, an international association of traders.
Mirjan Hipolito is a journalist and news editor at Traders Union. She is an expert crypto writer with five years of experience in the financial markets.
Overtrading is a phenomenon where a trader executes too many transactions in the market, surpassing their strategy and trading more frequently than planned. It's a common mistake that can lead to financial losses.
Forex trading, short for foreign exchange trading, is the practice of buying and selling currencies in the global foreign exchange market with the aim of profiting from fluctuations in exchange rates. Traders speculate on whether one currency will rise or fall in value relative to another currency and make trading decisions accordingly. However, beware that trading carries risks, and you can lose your whole capital.
Forex indicators are tools used by traders to analyze market data, often based on technical and/or fundamental factors, to make informed trading decisions.
Forex leverage is a tool enabling traders to control larger positions with a relatively small amount of capital, amplifying potential profits and losses based on the chosen leverage ratio.
Day trading involves buying and selling financial assets within the same trading day, with the goal of profiting from short-term price fluctuations, and positions are typically not held overnight.

-
 Afghanistan
-
 Albania
-
 Algeria
-
 Angola
-
 Argentina
-
 Armenia
-
 Australia
-
 Austria
-
 Azerbaijan
-
 Bahamas
-
 Bahrain
-
 Bangladesh
-
 Belarus
-
 Belgium
-
 Bolivia
-
 Botswana
-
 Brazil
-
 Brunei
-
 Bulgaria
-
 Cambodia
-
 Cameroon
-
 Canada
-
 Chile
Chile
-
 China
China
-
 Colombia
-
 Congo
Congo
-
 Costa Rica
-
 Cote d'Ivoire
-
 Croatia
-
 Cuba
Cuba
-
 Cyprus
-
 Czechia
-
 DR Congo
-
 Denmark
-
 Dominican Republic
-
 Ecuador
-
 Egypt
Egypt
-
 El Salvador
-
 Estonia
-
 Eswatini
-
 Ethiopia
-
 Finland
-
 France
-
 Georgia
-
 Germany
-
 Ghana
Ghana
-
 Greece
-
 Haiti
Haiti
-
 Hong Kong
-
 Hungary
-
 India
India
-
 Indonesia
-
 Iran, Islamic republic
-
 Iraq
Iraq
-
 Ireland
-
 Israel
-
 Italy
Italy
-
 Jamaica
-
 Japan
Japan
-
 Jordan
-
 Kazakhstan
-
 Kenya
Kenya
-
 Korea
Korea
-
 Kuwait
-
 Kyrgyzstan
-
 Laos
Laos
-
 Latvia
-
 Lebanon
-
 Lesotho
-
 Libya
Libya
-
 Lithuania
-
 Luxembourg
-
 Madagascar
-
 Malaysia
-
 Malta
Malta
-
 Mauritius
-
 Mexico
-
 Moldova
-
 Mongolia
-
 Montenegro
-
 Morocco
-
 Mozambique
-
 Myanmar
-
 Namibia
-
 Nepal
Nepal
-
 Netherlands
-
 New Zealand
-
 Nigeria
-
 North Macedonia
-
 Norway
-
 Oman
Oman
-
 Pakistan
-
 Palestine
-
 Panama
-
 Papua New Guinea
-
 Paraguay
-
 Peru
Peru
-
 Philippines
-
 Poland
-
 Portugal
-
 Puerto Rico
-
 Qatar
Qatar
-
 Reunion
-
 Romania
-
 Rwanda
-
 Saudi Arabia
-
 Serbia
-
 Singapore
-
 Slovakia
-
 Slovenia
-
 Somalia
-
 South Africa
-
 Spain
Spain
-
 Sri Lanka
-
 Sweden
-
 Switzerland
-
 Syria
Syria
-
 Taiwan
-
 Tajikistan
-
 Tanzania
-
 Thailand
-
 Trinidad and Tobago
-
 Tunisia
-
 Turkey
-
 UAE
UAE
-
 Uganda
-
 Ukraine
-
 United Kingdom
-
United States
-
 Uruguay
-
 Uzbekistan
-
 Venezuela
-
 Vietnam
-
 Yemen
Yemen
-
 Zambia
-
 Zimbabwe
- Forex
- Crypto
