How do you indicate support and resistance?
Technical analysis involves evaluating securities through the use of statistical data generated by market activity, such as historical prices and volume. Support and resistance levels are fundamental principles in this method of analysis. There are various techniques for identifying these levels, including trend lines, moving averages, and price patterns. In this article, the experts at TU will explore these methods in detail and discuss how to use them effectively in your trading strategy.
How to set support and resistance levels?
In technical analysis, support and resistance levels are key indicators that can help traders decide when to buy or sell a security. So, the experts at TU will discuss how to set support and resistance levels using various techniques and whether they work. By the end of this article, you will better understand how to use support and resistance levels in your trading strategy effectively. Also learn how to effectively use the support and resistance indicator for accurate trading on MT4 and MT5.
Do support and resistance really work?
Support and resistance are essential concepts in trading and are widely used by traders to help make decisions about entering and exiting trades. The idea behind support and resistance is that prices tend to have difficulty breaking through certain predetermined price levels. These levels are created by market participants' actions, which may be influenced by factors such as economic data, company earnings, or geopolitical events.
Support is where prices tend to find buying interest and bounce higher. This can happen because traders see the price as undervalued and decide to buy or because other traders have set orders to buy at that price level. When the price falls to a support level and bounces higher, it is said to have found support.
Resistance is the opposite of support and is a level where prices tend to find selling pressure and fall. This can happen because traders see the price as being overvalued at that level and decide to sell or because other traders have set orders to sell at that price level. A security is said to have encountered resistance when its price rises to a resistance level and then falls.
Traders often use support and resistance levels to make decisions about when to enter and exit trades. For example, a trader might buy at a support level with the expectation that the price will bounce higher or sell at a resistance level with the expectation that the price will fall. However, it's important to note that support and resistance levels are not always reliable, and prices can sometimes break through these levels.
To adapt your trading decisions to support and resistance levels, consider using other technical analysis tools and techniques, in addition to these levels. For example, look at chart patterns, moving averages, or indicators such as the relative strength index (RSI) to help confirm the presence of support or resistance. It's also a good idea to keep an eye on economic and market news, as this can influence the strength of support and resistance levels.
Support & resistance best strategies
There are three basic strategies for trading based on the support and resistance levels:
1. The reversal
2. The breakout
3. The breakout test
The reversal
This is the most apparent strategy, when the trader needs to sell near the resistance levels and sell near the support levels.
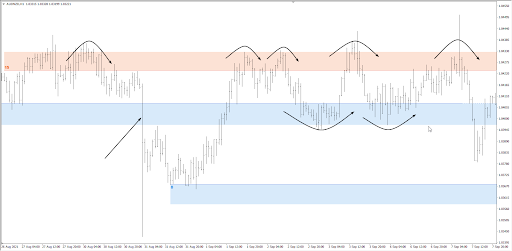
The Reversal Strategy Example
The hazard of this strategy is that it will cause losses during sharp movements. Therefore, you probably should avoid using it during the release of important news (shown by the arrow above).
The Breakout
This strategy implies the sale of the asset once its price breaks the support level and purchase of the asset once the price breaks the resistance level.
The Breakout Strategy Example
It is rational to apply this strategy at the start of active market sessions (European and American), when expecting important news and when the price is within a narrow range for a long time.
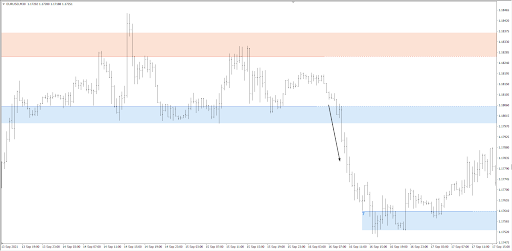
The Breakout Test
This strategy uses the “mirror” level principle, i.e. after the breakout the resistance works as support and the former support becomes resistance.

The Breakout Test Strategy Example
The chart above shows how during the downward trend, the blue support levels, after the breakout, offered resistance to the growing prices, thus providing opportunities for entering a short position.
Which of the 3 strategies should be used?
There is no definitive answer to this question, as strategies listed above cannot be just right or wrong. They all will provide profitable and false signals. Try using each of them on a demo account to see which one suits you the best.
Most importantly, cut the growing losses and evaluate profit growth potential.
Example of how to use resistance level
Resistance levels refer to price levels at which a stock or other security has historically had difficulty breaking through. Traders can use these levels to identify potential selling or shorting opportunities.
Here is an example of how a trader might use resistance levels in their trading:
Identify a security that has a precise resistance level. This can be done by looking at historical price charts and identifying price levels that have consistently acted as a further barrier to the security's price rise.
Set an order to sell or short the security once it reaches the resistance level. This can be done through a trading platform or through a broker.
Monitor the security's price as it approaches the resistance level. If the security's price starts to struggle or falter as it approaches the resistance level, it may be a good time to execute the order to sell or short.
Monitor the trade and consider taking profits or cutting losses if the security's price breaks through the resistance level or if market conditions change.
It's important to note that resistance levels are not a guarantee that the security's price will not break through them, and traders should always be aware of the risks and uncertainties involved in the market. Therefore, it's also important to use resistance levels in conjunction with other technical and fundamental analysis tools and a solid risk management strategy.
What are key support and resistance levels?
Support and Resistance levels are based on the concept of supply and demand, which states that when demand for security is high, and supply is limited, the price will tend to rise. Conversely, when demand is low and there is an excess supply, the price will tend to fall.
Key levels can be identified by analyzing historical price data and identifying price points where the security has had difficulty breaking through, preferably on the longer time-frames. Traders can use these levels to help identify potential entry and exit points for trades and set stop-loss orders.
It is important to note that support and resistance levels are not fixed and can change over time. Factors influencing the strength of support and resistance levels include changes in market conditions, changes in the underlying security, and news or events that can affect the security's price.
How to identify support and resistance level
To determine support and resistance levels, experts suggest using the following techniques:
1. Look for previous price points where the asset has had difficulty breaking through
Look for price points where the asset has had difficulty breaking through in the past. For example, if the asset has consistently faced selling pressure at around $100, that price point could be considered a resistance level. Conversely, if the asset has consistently witnessed buying interest at $100, that price point could be regarded as a support level.
2. Use technical analysis tools such as trend lines and moving averages
Use technical analysis tools such as trend lines and moving averages to help identify potential support and resistance levels. A trend line is a straight line drawn through a series of price points on a chart, which can help identify the overall trend of the asset. A moving average is a calculation that takes the average price of an asset over a specific time period and plots it on a chart. Moving averages can help smooth out short-term price fluctuations and make it easier to identify long-term trends.
3. Monitor key economic events
Keep an eye on key economic events and news announcements that could impact the supply and demand for the asset. These events can cause significant price movements and create new support and resistance levels.
Support and resistance levels, as well as supply and demand zones, are fundamental tools of technical analysis, allowing traders to identify areas of potential price reversals or breakouts. These concepts are based on the analysis of market dynamics and participant behavior, which makes them universal for all financial markets. Correctly identifying and using these zones and levels helps traders develop effective entry and exit strategies.
4. Volume
Pay attention to the volume of trading activity for the asset. High trading volumes can indicate that there is a lot of interest in the asset, which could make it more eventful for prices to break through a particular support or resistance level.
5. Multiple Time Frames
Use multiple time frames when analyzing charts to better understand the asset's price action. For example, a daily chart can give you a different perspective than a 4-hour chart.
6. Continuously monitor and adjust strategy
Remember that support and resistance levels are not fixed and can change over time. Therefore, monitoring these levels and adjusting your trading strategy accordingly is essential.
FAQ
How to identify support/resistance lines?
You can identify the supply-demand zone in three steps:
1. Spot the current price.
2. Find ERCs.
3. Identify the origin of the price movement.
What are support and resistance levels in trading?
Support and resistance refer to levels on a stock chart that act as barriers, preventing the price from moving above or below a certain point. Support refers to a level where the price tends to find increased buying pressure, which can cause the price to bounce higher. Conversely, resistance refers to a level where the price tends to find increased selling pressure, which can cause the price to fall.
How do traders determine support and resistance levels?
Traders can use various technical analysis tools to identify potential support and resistance levels. Some common methods include plotting horizontal lines on a chart at key price levels, using trend lines to connect price highs and lows, and applying moving averages to smooth out price fluctuations. However, it is important to note that these levels are not exact and can change over time.
What are some common uses of support and resistance in trading?
Support and resistance levels can be used in a variety of ways by traders. Some common uses include identifying potential entry and exit points for trades, setting stop-loss orders to minimize potential losses, and using them as a basis for trend analysis.
Can traders use support and resistance in conjunction with other technical analysis tools?
Yes, traders can use support and resistance levels in conjunction with other technical analysis tools, such as oscillators and indicators, to confirm trends and help make more informed trading decisions.
Glossary for novice traders
-
1
Supply and Demand Zones
In trading, a supply and demand zone refers to specific price levels on a chart where there is an imbalance between buyers (demand) and sellers (supply). A demand zone represents a price area where buying interest is strong, potentially leading to price increases, while a supply zone indicates an area where selling interest is significant, possibly resulting in price declines.
-
2
Trend Trading
Trend trading is a trading strategy where traders aim to profit from the directional movements of an asset's price over an extended period.
-
3
Risk Management
Risk management is a risk management model that involves controlling potential losses while maximizing profits. The main risk management tools are stop loss, take profit, calculation of position volume taking into account leverage and pip value.
-
4
Fundamental Analysis
Fundamental analysis is a method or tool that investors use that seeks to determine the intrinsic value of a security by examining economic and financial factors. It considers macroeconomic factors such as the state of the economy and industry conditions.
-
5
Forex Trading
Forex trading, short for foreign exchange trading, is the practice of buying and selling currencies in the global foreign exchange market with the aim of profiting from fluctuations in exchange rates. Traders speculate on whether one currency will rise or fall in value relative to another currency and make trading decisions accordingly. However, beware that trading carries risks, and you can lose your whole capital.
Related Articles


Team that worked on the article

Chinmay Soni is a financial analyst with more than 5 years of experience in working with stocks, Forex, derivatives, and other assets. As a founder of a boutique research firm and an active researcher, he covers various industries and fields, providing insights backed by statistical data. He is also an educator in the field of finance and technology.
As an author for Traders Union, he contributes his deep analytical insights on various topics, taking into account various aspects.

Dr. BJ Johnson is a PhD in English Language and an editor with over 15 years of experience. He earned his degree in English Language in the U.S and the UK. In 2020, Dr. Johnson joined the Traders Union team. Since then, he has created over 100 exclusive articles and edited over 300 articles of other authors.
