What Is The Easiest Indicator For Trading?

The easiest indicators for beginners are the moving averages, RSI, Bollinger Bands, and MACD. These indicators are versatile and easy to understand, aiding traders, especially beginners, to identify and interpret the market conditions and trading opportunities.
It is common knowledge that the financial markets have enormous indicators, each promising to be the key to successful trading. However, the quest to choose the best indicator can be challenging, which may lead to confusion and indecision, especially for beginner traders.
In this article, we highlight an overview of common indicators on most trading platforms and their suitability for beginners. By reviewing the fundamentals of various indicators, we aim to provide clarity and guidance for beginner traders to make informed decisions.
-
What are the basics of indicators?
Technical indicators are mathematical patterns designed to read the price chart based on historical data to display the underlying information of a financial instrument.
-
Is it good to trade using indicators?
Technical indicators are valuable in financial trading; they provide the underlying information of an instrument, enabling better decision-making.
-
How many trading indicators should I use?
There is no fixed number of recommended indicators for trading. So, the number of indicators a trader can use depends on their trading style and preferences.
-
What is the definition of leading vs lagging indicators?
A leading indicator attempts to predict the potential changes in the market trends, while a lagging indicator follows changes in the trends based on historical data of the price.
What are the Best Indicators for Simpler Trading?
Financial trading is quite a competitive venture; it involves competing with banks, hedge funds, and the smartest traders from around the world. Therefore, trading with simple indicators may not provide stable and easy earnings in the long run.
However, if you are a beginner, it is important to understand how indicators work, their signals, and their disadvantages – even negative experiences of using simple indicators can be useful in developing your strategy in the future.
Let’s delve into different types of indicators:
-
Trend Indicators: These are indicators designed to assist traders in identifying the trend direction of the market. Trend indicators include the moving averages, trendlines, the Average Directional Index (ADX), etc.
-
Impulse Indicators: These are indicators that measure the strength and momentum of price movements. In other words, they are indicators that show the rate of trend changes of an instrument. Impulse indicators include the Relative Strength Index (RSI), Moving Average Convergence Divergence (MACD), etc.
-
Volatility Indicators: These are indicators designed to measure the rate and magnitude of price movement in the financial market. The common volatility indicators include the Bollinger Bands, Average True Range (ATR), etc.
-
Volume Indicators: Volatility indicators are designed to analyze the trading volume of a financial instrument over a specific period. These indicators are typically used to confirm the strength of a trend to anticipate a potential trend continuation or reversal.
Moving Averages (MA)
The moving averages are beginner-friendly and versatile indicators that help clarify the trend direction of the market, smooth price fluctuations, determine support and resistance zones, and generate buy or sell signals.
The two most common types are the Simple Moving Average (SMA) and the Exponential Moving Average (EMA). The SMA is calculated by adding the average prices over a trading period, while the EMA gives more weight to recent price data using a smoothing factor. This implies that the EMA is more sensitive to recent price changes than the SMA.
Therefore, using the moving averages can depend on traders’ objectives and trading style. For example, traders can use the moving averages for trend identification when the price crosses above or below it, to smooth out market noises, or for entry/exit signals when two moving averages cross.
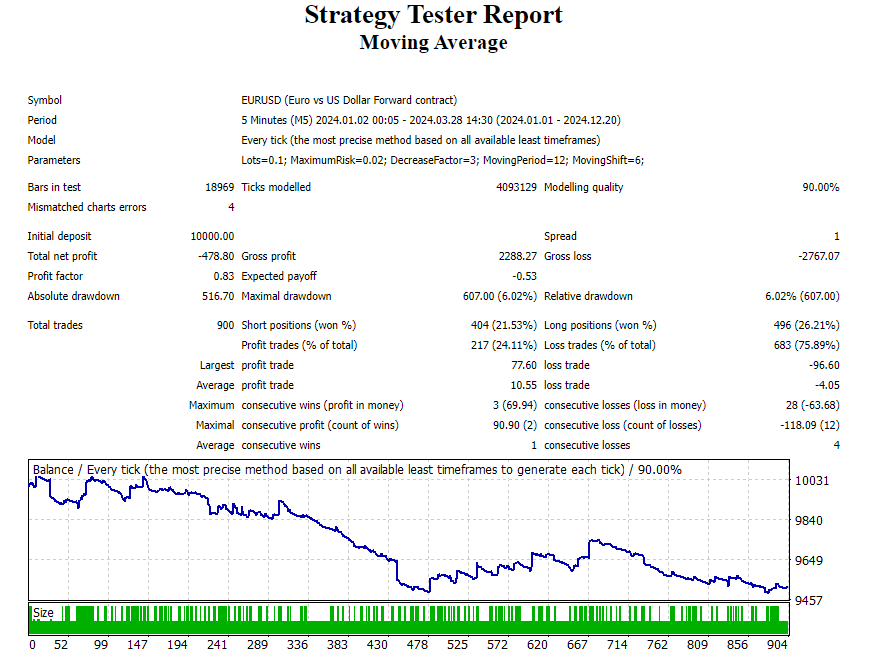
Moving Average
The above image shows the testing result of a Moving Average (MA) trading advisor built into the MT4 platform. The MA advisor was tested on the EUR/USD currency pair on an initial capital of $10,000 with over 900 trades taken. The result shows a negative gross profit of 478.80, which suggests that the MA indicator is somewhat not consistent and, hence, not suitable as a stand-alone tool for trade entries. So, traders can use the MA along with other technical indicators or price action to increase efficiency.
Relative Strength Index (RSI)
The RSI is a momentum oscillator that measures the speed and change of price movements on a scale of 0 to 100. It is a versatile trading tool for identifying price divergences, overbought and oversold levels, and trend identification. Besides, it is relatively easy to understand, making it suitable for beginners.
Traders can use the RSI to determine a bullish or bearish trend when the indicator crosses above or below the middle line. Additionally, traders can use the RSI to identify potential trend reversal trading opportunities at the indicator’s overbought level of 70 and oversold level of 30.
However, using the RSI with price action or other technical indicators is recommended for more confirmations before trading decisions. We also recommend reading the article “Top 3 RSI Indicator Strategies for Day Trading” for more details on how to trade with the RSI.
Moving Average Convergence Divergence (MACD)
The MACD is a trend-following momentum indicator that shows the relationship between two moving averages (EMA) periods (typically 12-period EMA minus 26-period EMA) of a security’s price. It is also a versatile and beginner-friendly indicator that helps traders confirm market momentum and trend identification.
The indicator’s signals are easy to interpret. It suggests that a trend is bullish when the MACD line crosses above the signal line, while a bearish trend is when it crosses below the signal line. Besides, the MACD’s histogram bars are used to identify divergence trading opportunities.
However, using the MACD indicator along with price action or other indicators is also recommended for better efficiency.
Bollinger Bands
The Bollinger Bands is a volatility-based indicator, consisting of a middle Simple Moving Average (SMA) line along with two standard deviation lines above and below it.
Bollinger Bands are often considered a beginner-friendly indicator due to their simplicity and effectiveness in identifying trading opportunities in the financial markets.
The indicator’s upper and lower bands help traders gauge market volatility and identify overbought and oversold zones (when the price exceeds the upper/lower band), while the middle line is for trend identification. So, the price above the middle line suggests a bullish sentiment, while a bearish bias is when the price falls below the line. Also, traders may look for trend reversal or pull-back trading opportunities when the price shows reversal signs (e.g., wick rejection, candlestick patterns, etc.) upon touching the upper or lower bands.
Best Forex brokers


What are the Best Indicators for Beginners in TradingView?
One of the best technical indicators for beginners available on TradingView is the squeeze momentum indicator, also known as LazyBear. It is an ideal indicator for catching a breakout after the market goes into consolidation.
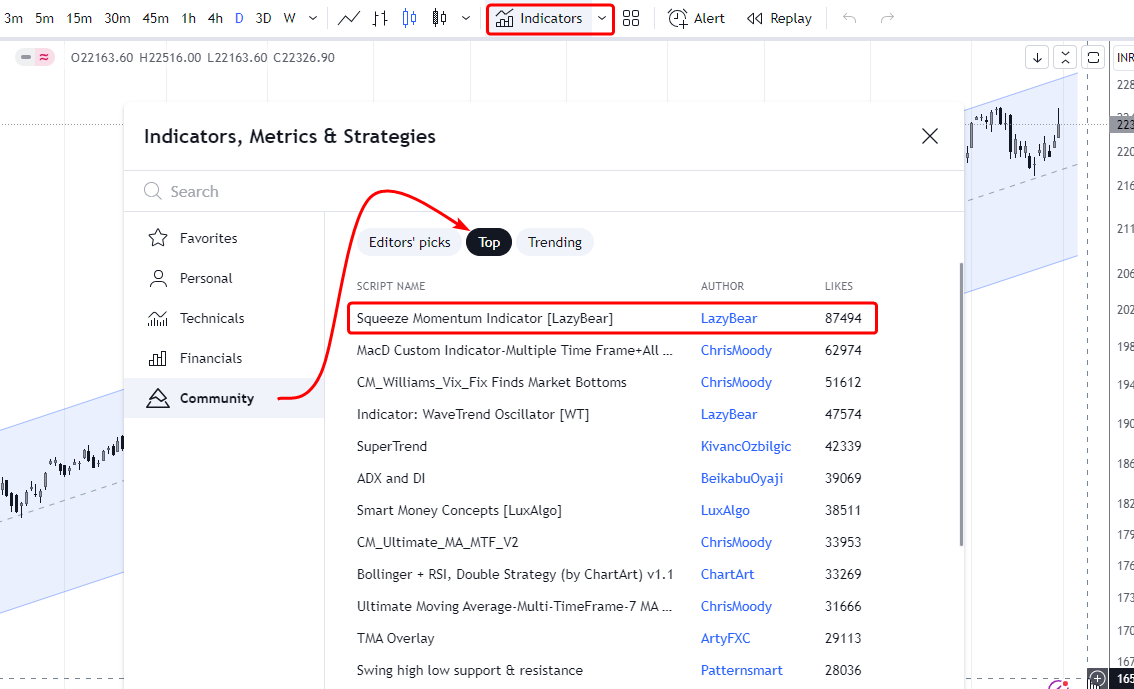
Best indicators for beginners in TradingView source
The Squeeze Momentum indicator is chart-friendly and easy to interpret, making it a beginner-friendly tool for identifying buying or selling opportunities after the price breakout of a range. The indicator uses a combination of the Bollinger Bands and the Keltner channel to detect price consolidation and identify breakout trading opportunities with accuracy. It is safe to say that the Squeeze Momentum indicator is worth giving a try.
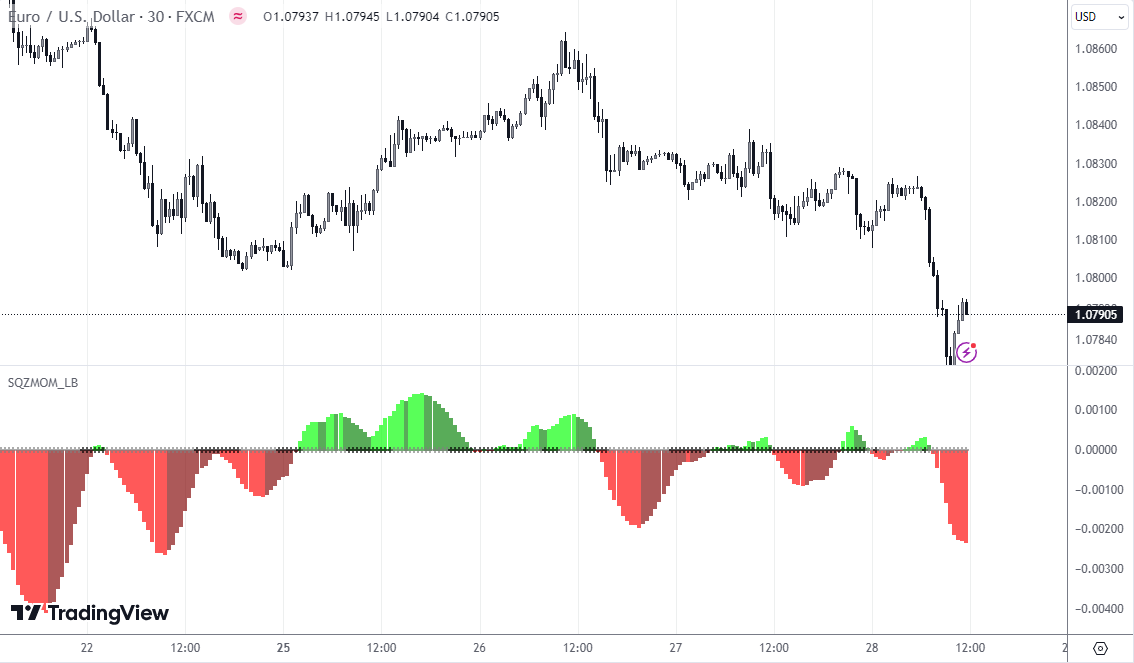
Best indicators for beginners in TradingView
The above image shows the market analysis of the Squeeze Momentum indicator. The indicator displays dots along the horizontal line, representing a market consolidation period. Additionally, it has green and red histogram bars above and below the horizontal line, depicting price breakouts.
So, the green histogram above the zero line indicates a price breakout to the upside, suggesting a potential bullish movement for a buy position. Conversely, if the red histogram breaks below the middle line, it indicates a bearish price breakout, suggesting a potential selling opportunity. TradingView indicators are essential tools that help traders analyze price movements, identify trends, and make accurate trading decisions.
Implementing Indicators in Your Trading Strategy
Here is a step-by-step guide on how to incorporate technical indicators into your trading strategy:
-
Start Simple: Begin with one or two indicators to avoid analysis paralysis
-
Open Brokerage Account: Download platform with built-in Indicators.
-
Practice: Use a demo account to practice applying these indicators within your trading strategy without financial risk.
-
Learn: Understand what each indicator tells you about the market conditions and how to apply them to make trading decisions.
Now, let’s delve into the general tips on how to start trading futures as described by Expert Mikhail Vnuchkov:
-
Set up your account. Most brokers will require a standard account to trade futures, as well as an extensive identity verification process that can take several days.
-
Consider your trading strategy. Before you get started, you should go into trading futures with a solid strategy. You can also use a demo account to experiment with different strategies without risking any capital.
-
Set up a risk control system. Adhere to the requirements of money management in real trading.
-
Do your research. Study the market, your commodity of choice, and everything that has to do with futures. We recommend studying some blog posts on Traders Union, different videos and tutorials from futures experts, and tutorials offered by your broker of choice.
-
Fund your account. When starting, we recommend only risking about $500 or so on futures.
-
On your platform of choice, simply search for the asset you’d like to trade and conduct a buy or sell. You’ll need to choose your asset, funding source, expiration date, and other necessary information.
Final Thoughts
Simple indicators that provide insight into trend direction, market volatility, momentum, and breakouts can significantly aid traders in making informed decisions. These simple yet effective tools, such as the moving averages, RSI, MACD, Squeeze Momentum, and Bollinger Bands indicator, help traders identify trading opportunities in the financial market. However, success in trading demands more than just relying on simple indicators; it requires practice, a grasp of technical analysis, risk management, and an understanding of market dynamics.
Glossary for novice traders
-
1
ATR Indicator
ATR (Average True Range) is a volatility indicator that helps traders assess the potential price range or volatility of a financial instrument. It calculates the average of true price ranges over a specified period, providing insight into the level of price fluctuations within that timeframe.
-
2
Futures contract
A futures contract is a standardized financial agreement between two parties to buy or sell an underlying asset, such as a commodity, currency, or financial instrument, at a predetermined price on a specified future date. Futures contracts are commonly used in financial markets to hedge against price fluctuations, speculate on future price movements, or gain exposure to various assets.
-
3
Index
Index in trading is the measure of the performance of a group of stocks, which can include the assets and securities in it.
-
4
Price action trading
Price action trading is a trading strategy that relies primarily on the analysis of historical price movements and patterns in financial markets, such as stocks, currencies, or commodities. Traders who use this approach focus on studying price charts, candlestick patterns, support and resistance levels, and other price-related data to make trading decisions.
-
5
Bollinger Bands
Bollinger Bands (BBands) are a technical analysis tool that consists of three lines: a middle moving average and two outer bands that are typically set at a standard deviation away from the moving average. These bands help traders visualize potential price volatility and identify overbought or oversold conditions in the market.
Related Articles

Team that worked on the article

Joshua Francis is a professional Forex trader with 4+ years of experience in the financial industry. He trades the XAU/USD and GBP/JPY pairs. He is also a ghostwriter and author for Indicatorspot and Traders Union, where he puts his intensive research skills and deep knowledge of the financial markets into freelance writing.

Dr. BJ Johnson is a PhD in English Language and an editor with over 15 years of experience. He earned his degree in English Language in the U.S and the UK. In 2020, Dr. Johnson joined the Traders Union team. Since then, he has created over 100 exclusive articles and edited over 300 articles of other authors.

Mirjan Hipolito is a journalist and news editor at Traders Union. She is an expert crypto writer with five years of experience in the financial markets. Her specialties are daily market news, price predictions, and Initial Coin Offerings (ICO).
