What are Forex Indicators? Definition and How to Use them to Earn More


Editorial Note: While we adhere to strict Editorial Integrity, this post may contain references to products from our partners. Here's an explanation for How We Make Money. None of the data and information on this webpage constitutes investment advice according to our Disclaimer.
Forex indicators are mathematical formulas applied to price or volume data to reveal trading signals. They simplify complex market behavior into readable patterns, helping traders make timely decisions. While no indicator predicts price with certainty, combining trend, momentum, and volume indicators can offer a strategic edge in both short- and long-term trading.
Forex indicators are technical tools that help traders analyze price movements and identify potential entry or exit points in the currency market. These indicators use mathematical formulas based on historical price data (such as open, high, low, and close) to forecast trends, measure volatility, or signal momentum. Common types include trend indicators (like Moving Averages), oscillators (like RSI and MACD), and volume-based indicators. Traders use them to build strategies, confirm trends, and reduce emotional decision-making.
What are Forex indicators?
A forex indicator is a mathematical calculation that allows you to analyze a currency pair. It can consider volume, open interest, exchange rates, and other factors to help you understand the movement in the currency. This data is often presented in charts, bars, and graphs so that you can decide whether to move forward with a long or short position.
In other words, forex indicators can provide insight into the following questions:
What forex pairs should you be trading?
Should you buy or sell the forex pair?
What is the estimated profit that may be earned?
As such, forex indicators can guide your overall trading strategy and improve your performance. Likewise, they can help you better understand the forex market and allow you to learn from your trading experience.
The benefits of using forex indicators include the fact that they simplify the analysis process by creating clear and concise visuals. It will save you time and energy as you build your strategy, and you can customize them to get even better results. They work for almost all currency pairs too, so the applications are rather broad.
The downside to relying on forex indicators is that they can often contradict each other. This can confuse traders about which currency pairs to trade. Signals can also show premature results, so you should not solely rely on them.
How can Forex indicators help?
So, how can forex indicators help you make decisions about what positions to open or close?
The easiest way to understand this is to look at an example. The moving average is a popular forex trend indicator. It helps you decide whether the best move is to open a long or short position.
The tool will display the moving averages, and the key is to look for the crossover – if the shorter moving average crosses above the longer one, it is a bullish signal. If the crossover occurs below the longer moving average, then that is a bearish signal.
When the forex indicator displays a bullish signal, traders will use that as the basis for opening long positions. On the other hand, they will pursue short positions if the indicators are bearish.
As you can imagine, forex indicators can be very helpful when used correctly. However, you must ensure that you understand the principles and functionalities of each signal before you rely on them. Every technique and trading style has its risks, so you must weigh them carefully when developing your strategy.
Are Forex indicators effective?
Another common question is whether forex indicators are effective. While they cannot always guarantee success, they can help traders identify important movements in currency pairs and make strategic investment decisions.
The best forex indicators are selected based on your specific goals and timeframe. You need to develop a consistent method for analyzing signals and applying them, as they are only relevant during certain market movements and patterns.
How do Forex indicators work?
The best way to understand how forex indicators work is to look at an example. The easiest technical indicator to consider is momentum, so let’s start there. This signal measures the price variation in a currency pair over time – and it can be a leading indicator of where the value will move to.
When you look at the chart and see that the Momentum indicator begins to rise after forming a cavity, it is showing a buy signal. On the other hand, you can see the trend change in the opposite direction when the indicator looks like this:
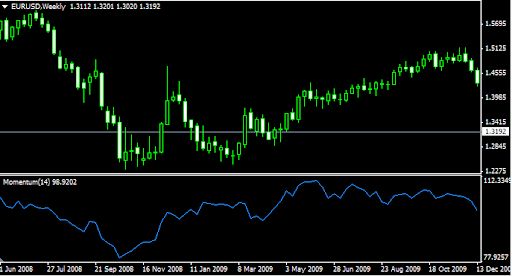
When the momentum indicator begins to fall, it represents a reversal in momentum:
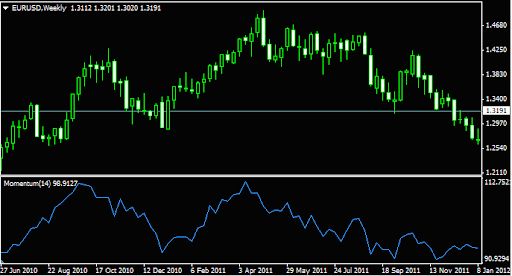
When you see very high or low values on the indicator, it implies that the current trend will continue. At the market base, you will notice that the momentum indicator will slump – then reverse for growth. Overshooting the momentum indicator could also indicate that the currency pair is approaching its peak.
While this is rather generalized, forex traders combine the momentum indicator with additional research. This is just one example of how you can use a forex indicator to drive your trading strategy.
Main types of Forex indicators
There are four core categories of Forex indicators: trend indicators, volume indicators, oscillators, and moving averages. Each serves a distinct purpose in signal detection and decision-making.
Trend indicators help identify the market’s direction. Price action is the primary signal — all other tools derive from it. Traders often use moving averages or the Supertrend indicator to confirm uptrends or downtrends based on consistent price patterns.
Volume indicators reflect market participation. In Forex, where centralized volume data doesn’t exist, brokers provide tick volume estimates. These indicators confirm trends and validate breakouts by measuring buying/selling pressure.
Oscillators such as the Stochastic help spot overbought or oversold zones. They’re best used in ranging markets and can signal potential reversals when momentum weakens.
Moving averages smooth out price fluctuations to reveal the prevailing direction. Traders use them to generate buy/sell signals based on crossovers or the position of the price relative to the average line.
Used correctly, these tools enhance strategy accuracy — but only when paired with context and risk management.
MT4 indicators: Where to find and how to use them
MetaTrader 4 (MT4) is a widely used trading platform licensed to brokers since 2005. It comes with a built-in set of technical indicators for analyzing currency pairs. Most indicators are pre-installed in the platform, but additional ones can be downloaded from the official MetaTrader website or directly from your broker’s resource section.
You can also access curated MT4 indicator packages through trusted sources, including the link below.
Each MT4 indicator performs a specific analytical function — trend detection, momentum analysis, volume confirmation, or volatility tracking. There is no universal “best” tool; traders choose based on strategy and market conditions.
Popular indicators on MT4 include:
Bollinger Bands – volatility and mean reversion
MACD – trend strength and momentum
On-Balance Volume (OBV) – volume-price relationship
CCI (Commodity Channel Index) – cyclical trends
Accumulation/Distribution Line – money flow direction
Money Flow Index (MFI) – volume-weighted momentum
Market Facilitation Index (MFI) – price movement efficiency
These tools are accessible from the MT4 terminal and can be customized for any trading style.
Download Forex indicators for free
Not all forex indicators are the same or easy to use, so consider downloading some for free. Here you can find a more detailed description of the best indicators for your strategy – and start using them to improve your results.
ADX

ATR
Bollinger Bands
EW1
Gentor CCI
MA Channels FIBO
Momentum
Roc
Snake
William New
Alligator
Awesome Oscillator
Bulls Power
Fibo Pivots
Heiken ashi
MACD
Moving Average Candlesticks
RSI
Stochastic Oscillator
ZigZag
AMA & AMA sig
Bears Power
DeMarker
Fx Analizer
Ichimoku Kinko Hyo
MACDdtLSMA
Multi Symbol
Scalper Signal
Trendband
Parabolic
Best MT4 Forex brokers
Not all brokers support advanced customization of MT4. Below is a comparison of reliable Forex brokers that allow users to install and run custom indicators:
| Demo | Min. deposit, $ | Max. leverage | Deposit fee, % | Withdrawal fee, $ | Regulation | MT4 | Open an account | |
|---|---|---|---|---|---|---|---|---|
| Yes | 1 | 1:30 | No | No | CNMV | Yes | Study review | |
| Yes | 250 | 1:400 | No | 10-100 | FSCA, CySEC | Yes | Study review | |
| Yes | 100 | 1:50 | No | No | CIMA, FCA, FSA (Japan), NFA, IIROC, ASIC, CFTC | Yes | Study review | |
| Yes | No | 1:200 | No | 0-15 | FSC (BVI), ASIC, IIROC, FCA, CFTC, NFA | Yes | Go to broker Your capital is at risk. |
|
| Yes | 1 | 1:200 | No | No | FCA, BaFin, ASIC, MAS, CySec, FINMA, BMA, CFTC, NFA | Yes | Study review |
How I really use Forex indicators

I’ve tested dozens of Forex indicators across various markets and timeframes. Most of them overcomplicate the decision-making process. In practice, only a few matter — and only in specific conditions.
For example, I rely on Moving Averages solely to define structure on higher timeframes. I don’t use crossovers or slope angles — they lag. Instead, I compare MA positions with recent price impulses to detect trend exhaustion.
Oscillators like RSI or Stochastic? I only use them during flat or corrective phases — never in trending markets. They fail when volatility spikes. One of the most reliable signals I’ve seen is RSI divergence near multi-session ranges — but only if volume confirms the shift.
Volume-based tools (like VWAP) have given me more edge than most visual indicators. If there’s no confluence between price, structure, and liquidity — I skip the trade.
The best setup is the one you can explain in one sentence. If an indicator needs interpretation manuals or “settings optimization,” I discard it.
Conclusion
Forex indicators are measurements and graphs that help traders decide when to open or close positions. They can also allow them to determine whether they should buy or sell the currency pairs.
For example, you can use them to analyze volume movements in the forex market or predict when a trend will continue or break. However, statistical analysis relies on patterns and mathematical calculations, so it is not guaranteed to be successful every time.
Simply put, leveraging forex indicators can enhance your trading experience - and you should take advantage of them wherever possible. While you can use signal providers to trade automatically if you do not intend to trade full-time, it is essential that you work with a reliable platform and fully understand the risks associated with them.
FAQs
Is day trading worth it?
It is much more difficult to succeed in day trading in today’s market. The hedge funds run sophisticated algorithms that increase the difficulty. Day traders are severely undercapitalized. They have to pay for expensive chartroom memberships, educational courses, and newsletter subscriptions. However, with experience in day trading, you can make good profit.
Is day trading illegal?
Day trading is allowed in the United States. However, you must have at least a $25,000 minimum account balance to become a Pattern Day Trader. Every trader must strive to get approval as a Pattern Day Trader. Once classified as a PDT, you get access to a 4:1 margin intraday.
What are the risks of day trading?
Since you have to buy and sell using borrowed capital, it is inherently risky. Like poker, you can lose vast amounts of money. Each day traders must take undisciplined risks to earn profit.
Can you day trade on multiple platforms?
It is possible to trade on multiple platforms.Most day traders have multiple brokerage accounts and use several trading platforms simultaneously.
Editors' Top Picks and Insights

Bitcoin mining is getting greener, but the debate isn't over

Asia's largest IPO: How CXMT became China's most valuable company

Global fintech in 2026: Three trends that matter

From Jesus Christ to aliens: Polymarket's most absurd prediction markets

Hunting crypto owners: Why criminals have gone offline

BitMEX is shutting down: Why Trump could not save the exchange
Related Articles
Team that worked on the article
Alamin Morshed is a contributor at Traders Union. He specializes in writing articles for businesses that want to improve their Google search rankings to compete with their competition.
Chinmay Soni is a financial analyst with more than 5 years of experience in working with stocks, Forex, derivatives, and other assets. As a founder of a boutique research firm and an active researcher, he covers various industries and fields, providing insights backed by statistical data.
Mirjan Hipolito is a journalist and news editor at Traders Union. She is an expert crypto writer with five years of experience in the financial markets.
A long position in Forex, represents a positive outlook on the future value of a currency pair. When a trader assumes a long position, they are essentially placing a bet that the base currency in the pair will appreciate in value compared to the quote currency.
Bitcoin is a decentralized digital cryptocurrency that was created in 2009 by an anonymous individual or group using the pseudonym Satoshi Nakamoto. It operates on a technology called blockchain, which is a distributed ledger that records all transactions across a network of computers.
Forex trading, short for foreign exchange trading, is the practice of buying and selling currencies in the global foreign exchange market with the aim of profiting from fluctuations in exchange rates. Traders speculate on whether one currency will rise or fall in value relative to another currency and make trading decisions accordingly. However, beware that trading carries risks, and you can lose your whole capital.
CFD is a contract between an investor/trader and seller that demonstrates that the trader will need to pay the price difference between the current value of the asset and its value at the time of contract to the seller.
In the Forex market, a “trend” is the label used to describe the general direction that the prices of currency pairs are moving in, over a specific period of time. Trends are basically the pattern that a currency pair appears to be following and can help traders determine when to enter and exit a trade.

-
 Afghanistan
-
 Albania
-
 Algeria
-
 Angola
-
 Argentina
-
 Armenia
-
 Australia
-
 Austria
-
 Azerbaijan
-
 Bahamas
-
 Bahrain
-
 Bangladesh
-
 Belarus
-
 Belgium
-
 Bolivia
-
 Botswana
-
 Brazil
-
 Brunei
-
 Bulgaria
-
 Cambodia
-
 Cameroon
-
 Canada
-
 Chile
Chile
-
 China
China
-
 Colombia
-
 Congo
Congo
-
 Costa Rica
-
 Cote d'Ivoire
-
 Croatia
-
 Cuba
Cuba
-
 Cyprus
-
 Czechia
-
 DR Congo
-
 Denmark
-
 Dominican Republic
-
 Ecuador
-
 Egypt
Egypt
-
 El Salvador
-
 Estonia
-
 Eswatini
-
 Ethiopia
-
 Finland
-
 France
-
 Georgia
-
 Germany
-
 Ghana
Ghana
-
 Greece
-
 Haiti
Haiti
-
 Hong Kong
-
 Hungary
-
 India
India
-
 Indonesia
-
 Iran, Islamic republic
-
 Iraq
Iraq
-
 Ireland
-
 Israel
-
 Italy
Italy
-
 Jamaica
-
 Japan
Japan
-
 Jordan
-
 Kazakhstan
-
 Kenya
Kenya
-
 Korea
Korea
-
 Kuwait
-
 Kyrgyzstan
-
 Laos
Laos
-
 Latvia
-
 Lebanon
-
 Lesotho
-
 Libya
Libya
-
 Lithuania
-
 Luxembourg
-
 Madagascar
-
 Malaysia
-
 Malta
Malta
-
 Mauritius
-
 Mexico
-
 Moldova
-
 Mongolia
-
 Montenegro
-
 Morocco
-
 Mozambique
-
 Myanmar
-
 Namibia
-
 Nepal
Nepal
-
 Netherlands
-
 New Zealand
-
 Nigeria
-
 North Macedonia
-
 Norway
-
 Oman
Oman
-
 Pakistan
-
 Palestine
-
 Panama
-
 Papua New Guinea
-
 Paraguay
-
 Peru
Peru
-
 Philippines
-
 Poland
-
 Portugal
-
 Puerto Rico
-
 Qatar
Qatar
-
 Reunion
-
 Romania
-
 Rwanda
-
 Saudi Arabia
-
 Serbia
-
 Singapore
-
 Slovakia
-
 Slovenia
-
 Somalia
-
 South Africa
-
 Spain
Spain
-
 Sri Lanka
-
 Sweden
-
 Switzerland
-
 Syria
Syria
-
 Taiwan
-
 Tajikistan
-
 Tanzania
-
 Thailand
-
 Trinidad and Tobago
-
 Tunisia
-
 Turkey
-
 UAE
UAE
-
 Uganda
-
 Ukraine
-
 United Kingdom
-
United States
-
 Uruguay
-
 Uzbekistan
-
 Venezuela
-
 Vietnam
-
 Yemen
Yemen
-
 Zambia
-
 Zimbabwe
- Forex
- Crypto
