What are Bollinger Bands?
This article is written by a professional trader who discusses the following:
- 1
Disadvantages and advantages of the indicator;
- 2
Bollinger Bands trading strategy;
- 3
How to add the Bollinger Bands indicator to the chart, and set it;
- 4
FAQs about BBands.
Bollinger Bands (BBands) is an indicator developed by John Bollinger in the 1980s. John started as a trader making decisions on fundamental analysis, but he was not satisfied with the results. Then he decided to add an element of technical analysis, namely his proprietary Bollinger Bands indicator, to first select suitable assets based on fundamentals and then look for entry points using BBands.
The Bollinger Bands tool shows the average price and its standard deviations. The simplicity, versatility, and usefulness of Bollinger Bands make this indicator a popular tool for traders to trade cryptocurrencies, stocks, futures, and Forex markets.
What are Bollinger Bands (BBands)
How does the indicator work?
The Bollinger Bands tool shows alternating volatility, quiet conditions, and splashes.
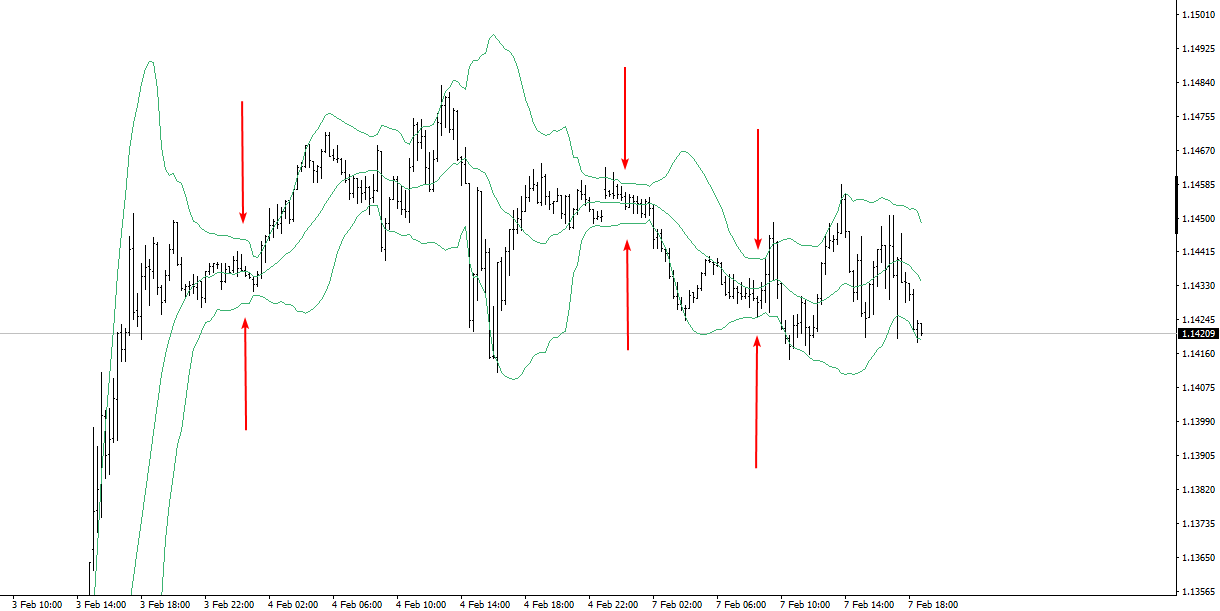
Alternating volatility, quiet conditions, and splashes
For example, in the intraday chart above you can see the arrows that show three periods when the bands narrowed. These are periods of market inactivity or low volatility.
During periods of market activity, Bollinger Bands expand and thus give the boundaries of overbought and oversold trades, which depend on volatility.
It is believed that:
if the price is above the Bollinger Upper Band, then the market is overbought because the current quote is above the average values by 2 standard deviations;
if the price is below the Bollinger Lower Band, then the market is oversold, as the price has fallen below two standard deviations from its average values;
If the bands widen after a period of low volatility, the probability of a new trend establishing increases.
Do Bollinger Bands work in Forex?
No analysis tool is guaranteed to be accurate, and Bollinger Bands is no exception. It has its advantages and disadvantages, to be taken into account.
👍 Pros
• The indicator works on any timeframe (avoid too fast timeframes containing a lot of "noise")
• The indicator works in all markets
• Not copied
• Included in MT4 and other platforms
• Flexible settings
👎 Cons
• Since the indicator includes an SMA, we can say that Bollinger Bands can lag
• The indicator doesn’t give trading signals, its readings shall be interpreted to make decisions on your own.
The Bollinger Bands indicator is not used as a self-sufficient tool, which generates signals for entry and exit positions. It is usually used as an auxiliary tool to measure volatility or as a trading strategies component.
Download Bollinger BandsBollinger Bands strategy
There are 3 basic strategies to trade on the Bollinger Bands indicator:
in the center spread
on the breakdown
for the breakdown test
All Bollinger Band trading strategies are applicable for intraday trading as well as for investors on daily/weekly charts. Please find a few examples below. Apply them as a basis for your research.
1. In the center spread
This is the most obvious strategy. It assumes:
opening short positions when prices are too high (above the Upper Band line)
opening long positions when prices are too low (below the Lower Band line).
It is rational to use candlestick patterns as confirmations to enter a trade because they reflect the price dynamics without lag.
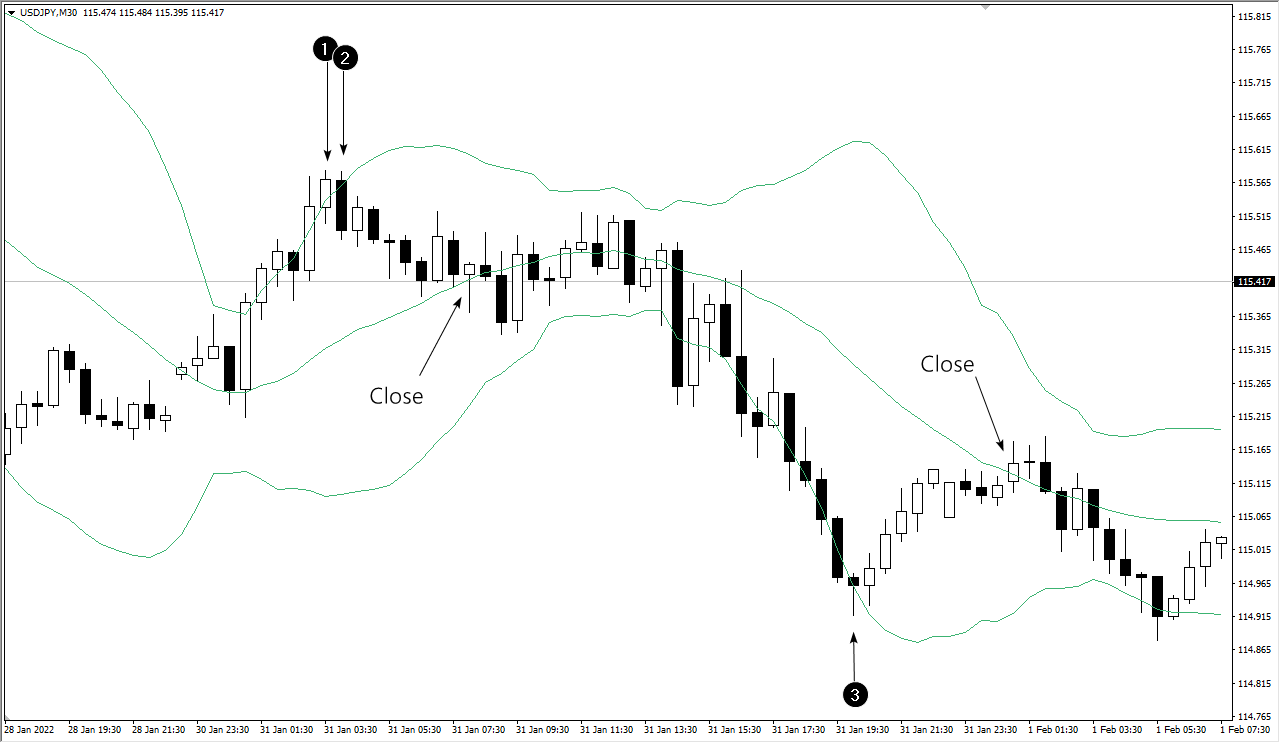
Bollinger Bands strategy
For example, in the chart above, the numbers 1 and 2 show a bearish consumption, with the first candle closing above the Upper Band. The pattern indicates that sellers have probably taken control of the market as it is overbought.
In this case, the stop-loss should be put for the top of the pattern of consumption, and to close the position or when the price reaches the SMA (simple moving average) line (indicated by the arrow), or if the price reaches the lower line of the Lower Band (expecting the price moves into the oversold zone, it would be reasonable to move the stop in the black if given the opportunity).
The number 3 indicates a pin bar, which is a candle with a very long lower shadow. It shows that the demand forces are probably interested in the cheapening asset and are ready to support it. A long entry is based on a breakout of the pin bar's maximum, with a stop just below the pin bar's minimum.
Exit a position when it reaches the midline of the SMA. You can close a position in parts, to try to hold it until the price reaches the upper line (this was not a good idea according to the example above).
Advantages of the strategy:
Meant to buy at the cheapest and sell at the most expensive.
A sufficient number of sets in different markets.
Automatically takes volatility into account.
Flaws in the strategy:
There is a chance of making a position against a strong trend. Therefore, it should hardly be used during the release of important news, and you should protect the position with a stop-loss.
Confirmations are required, for example, from candlestick patterns.
2. On the breakdown
The strategy implies selling the asset when the Lower Band line is crossed and buying when the Upper Band line is crossed.
It makes sense to apply the strategy when you expect strong moves, for example, based on fundamental information, or after an extremely prolonged flat period when the probability of a strong impulse increases.
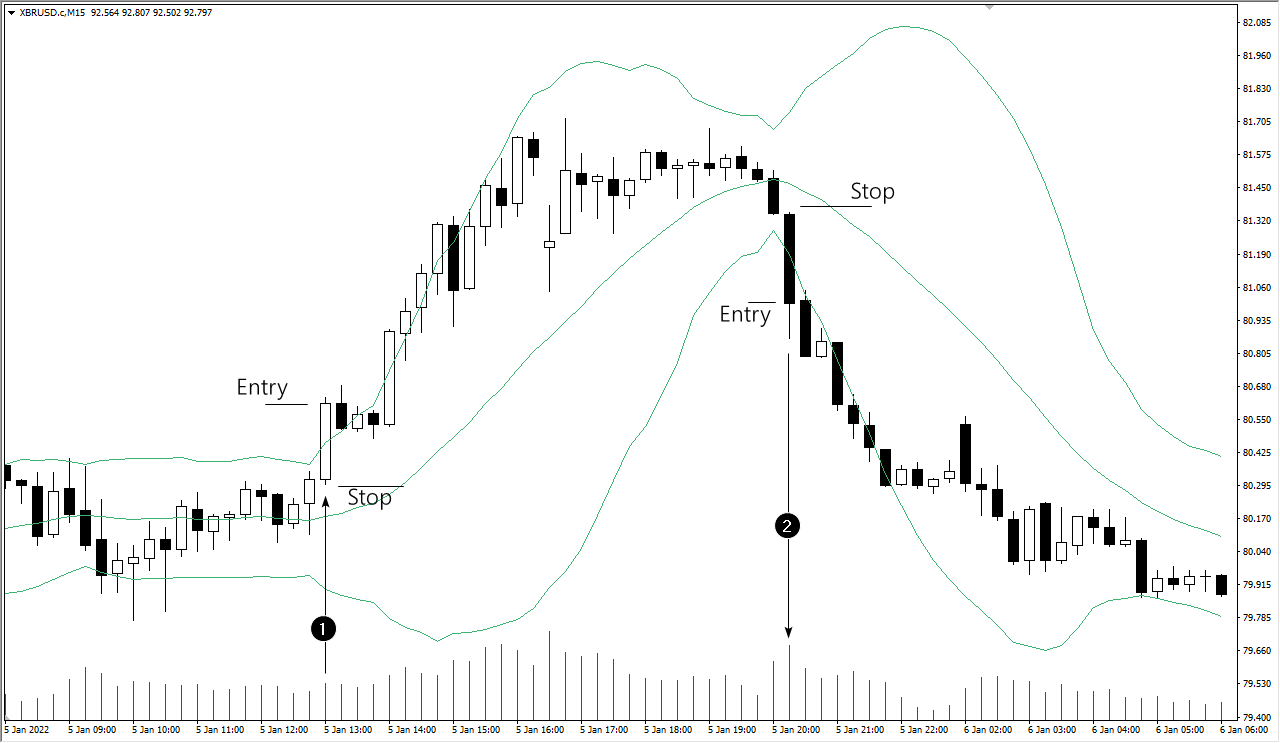
Bollinger Bands strategy
The picture above shows two setups in the oil market.
The number 1 indicates a buy setup:
the candle closes above the Upper Band after a period of slack;
there is an extension of the body of the candle and an increase in volume, as a confirmation of the buyers' activity.
It is rational to place the stop-loss below the minimum of a breakout candle and to hold the position as long as the trend allows. It is acceptable to partially close a position, to transfer it to the black to protect profits to make a smoother capital growth in the long term.
The number 2 shows a similar trade, but for sale:
The candle closes below the Lower Band after a period of slack;
the candle expands with increasing volume, which confirms the sellers’ activity.
In the days shown on the chart, there was increased geopolitical density in the world, there was a threat of war, so the price of oil reacted sensitively to changes in the news background.
An advantage of the strategy:
Allows you to benefit from strong impulses.
Flaws in the strategy:
A large number of false signals.
Confirmation is required, for example through volume analysis.
It can be psychologically stressful.
3. Breakdown test
This strategy will suit those who are not comfortable opening positions in the direction of the momentum and prefer to wait for a pullback.
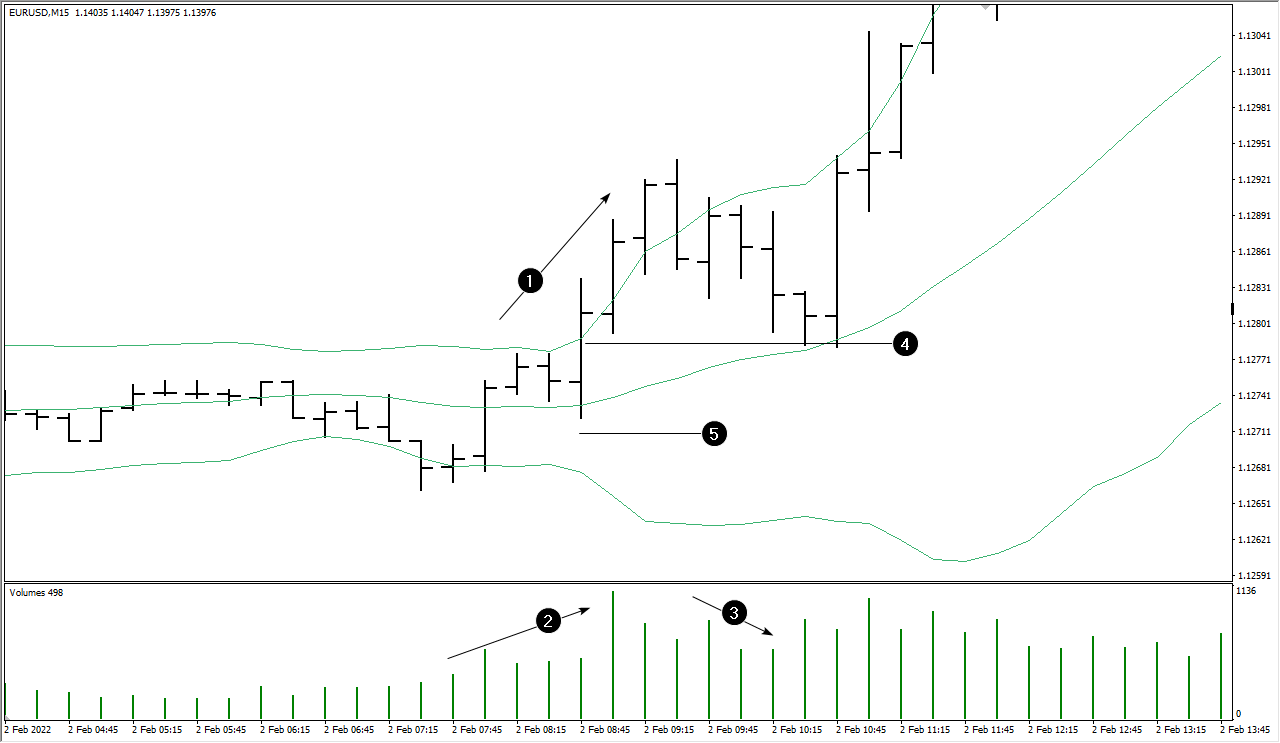
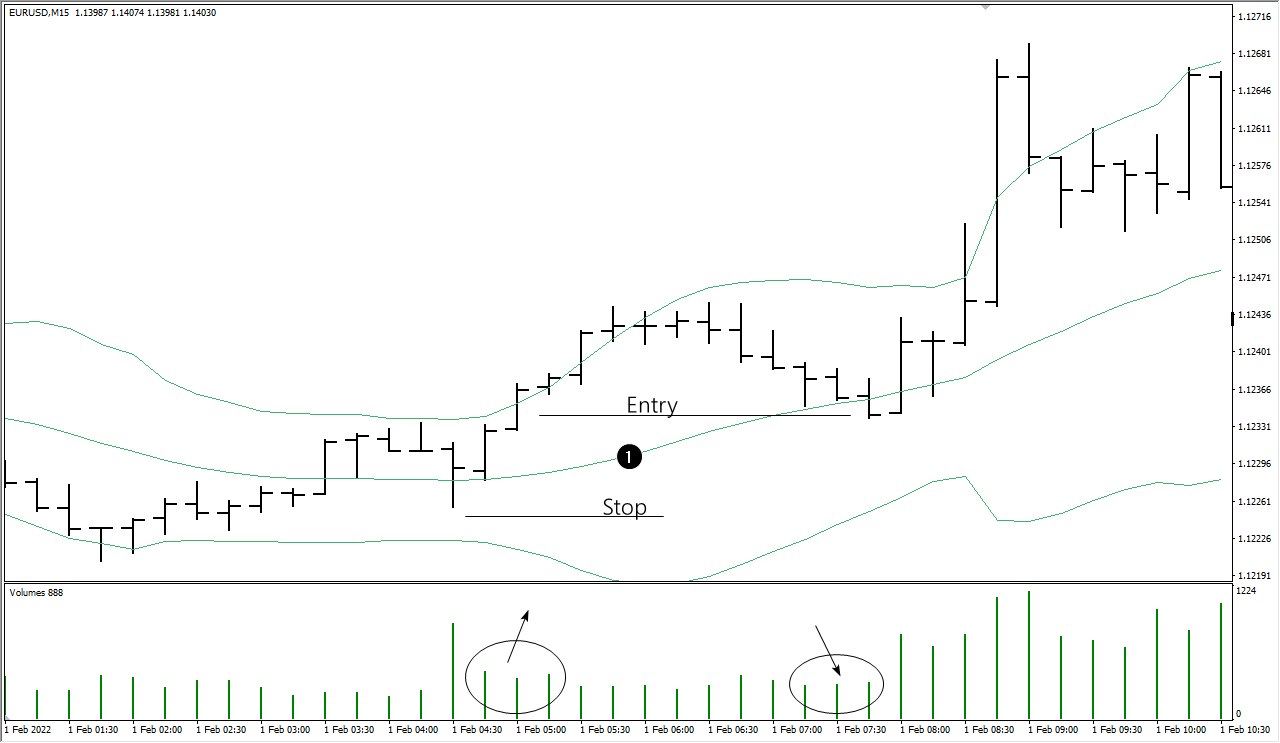
Bollinger Bands strategy
The chart above shows that prices started to rise (1) after a period of slack, during which the Bollinger Bands indicator lines narrowed. Confirmation of the bullish momentum is the increase in volumes (2). Closing prices are above the Upper Band, and this is also a confirmation of the upward impulse strength.
Then a pullback happens. Price returns to the inside of the indicator bars, with volumes decreasing (3), confirming that the market is in a corrective phase.
Level (4), which is in the area of the initial breakdown can be a good guide for opening a long position considering the uptrend resumption. Stop-loss should be placed behind the local minimum (5) and try to hold a long position as long as the trend is relevant.
Bollinger Bands strategy
The SMA line (1), as the chart above shows, will sometimes seem to provide dynamic support for rising prices, but it will not necessarily always be this way.
Advantages of the strategy:
Meant for trading on the trend.
Reduces risks.
Automatically takes volatility into account.
Flaws in the strategy:
There is no guarantee that the trend will resume after a pullback.
You can miss a strong trend without a pullback.
What strategy should I use to trade?
There is no definite answer to this question because the strategies described cannot be right or wrong. Each will give signals leading to both profits and losses.
Determine which strategy suits you best based on your personal preferences, whether you like to buy in the direction of momentum, or vice versa, look for reversals.
Try trading the Bollinger Bands indicator on a demo account to see which strategy gives the most promising dynamics. Next, try to improve your performance by adding rules to your strategy.
The main thing is to cut the growing losses and leave the potential for profit growth.
How to set Bollinger Bands
The Bollinger Bands indicator represents three lines:
The average line is a simple moving average (SMA).
The Upper Bands is calculated by adding twice the value of the standard deviation to the SMA.
The Lower Bands - ditto. The trader needs to subtract twice the value of the standard deviation from the SMA.
SMA = SUM [CLOSE, N] / N
UPPER = SMA + (D*StdDev)
LOWER = SMA – (D*StdDev)
Where:
N is the period used for the calculations. The default period = 20;
SMA – Simple Moving Average;
D – the coefficient, the default value is 2.
StdDev – means Standard Deviation.
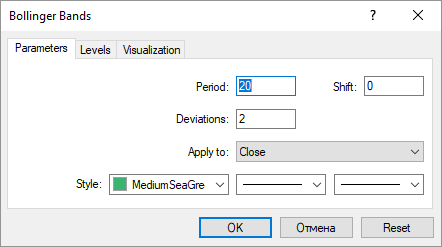
Setting up the Bollinger Bands indicator
The period is a period of the indicator. The greater the value, the smoother the lines will be.
Deviations - means the number of standard deviations to set off up and down from the average line. The larger this parameter is, the wider the lines of the indicator will be.
The shift is a shift of the indicator relative to the chart.
Classic indicator settings used by the author:
Period = 20;
Deviations = 2.
If the period is increased to 50, then John Bollinger recommends increasing Deviations to 2.1. If the period is reduced to 10, Deviations should also be reduced to 1.9.
How to add Bollinger Bands to MT4
The Bollinger Bands indicator is included by default in many popular platforms for financial markets trading and analysis. MetaTrader 4 is no exception.
Select Insert/Indicators/Trend/Bollinger Bands in the main menu to add a Bollinger Bands indicator to the chart.
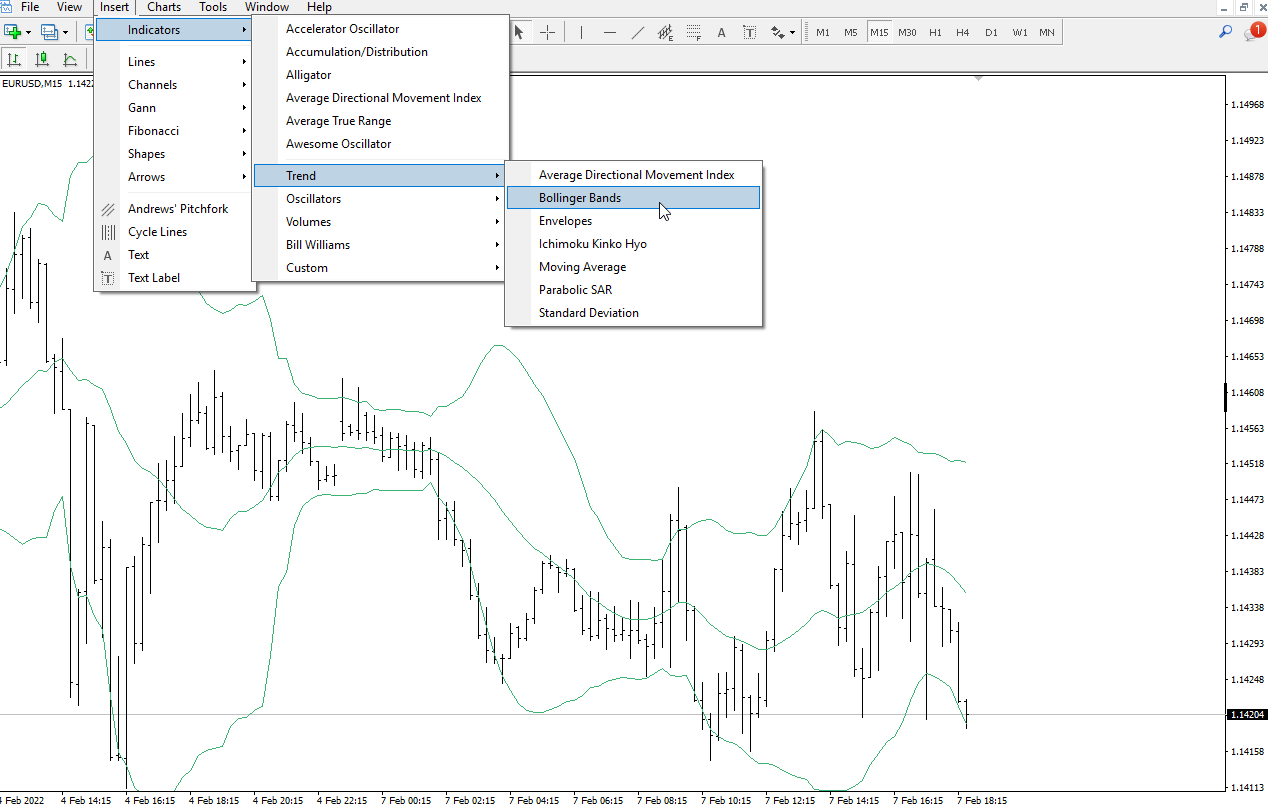
Adding Bollinger Bands to MT4
Another way is to drag & drop an indicator from the Navigator window, which can be triggered in MT4 by pressing Ctrl+N.
Are Bollinger Bands accurate?
We studied an EA that trades on a Bollinger line breakdown to gather relevant information on this issue.
The expert advisor places a buy-stop order on the Upper Band, and a sell-stop order on the Lower Band line. And when the price crosses the line, the Expert Advisor enters the position. Exit the position by fixed take profit and stop loss values.
You can see a screenshot of the testing process of the Bollinger Bands indicator in MetaTrader 4 below.
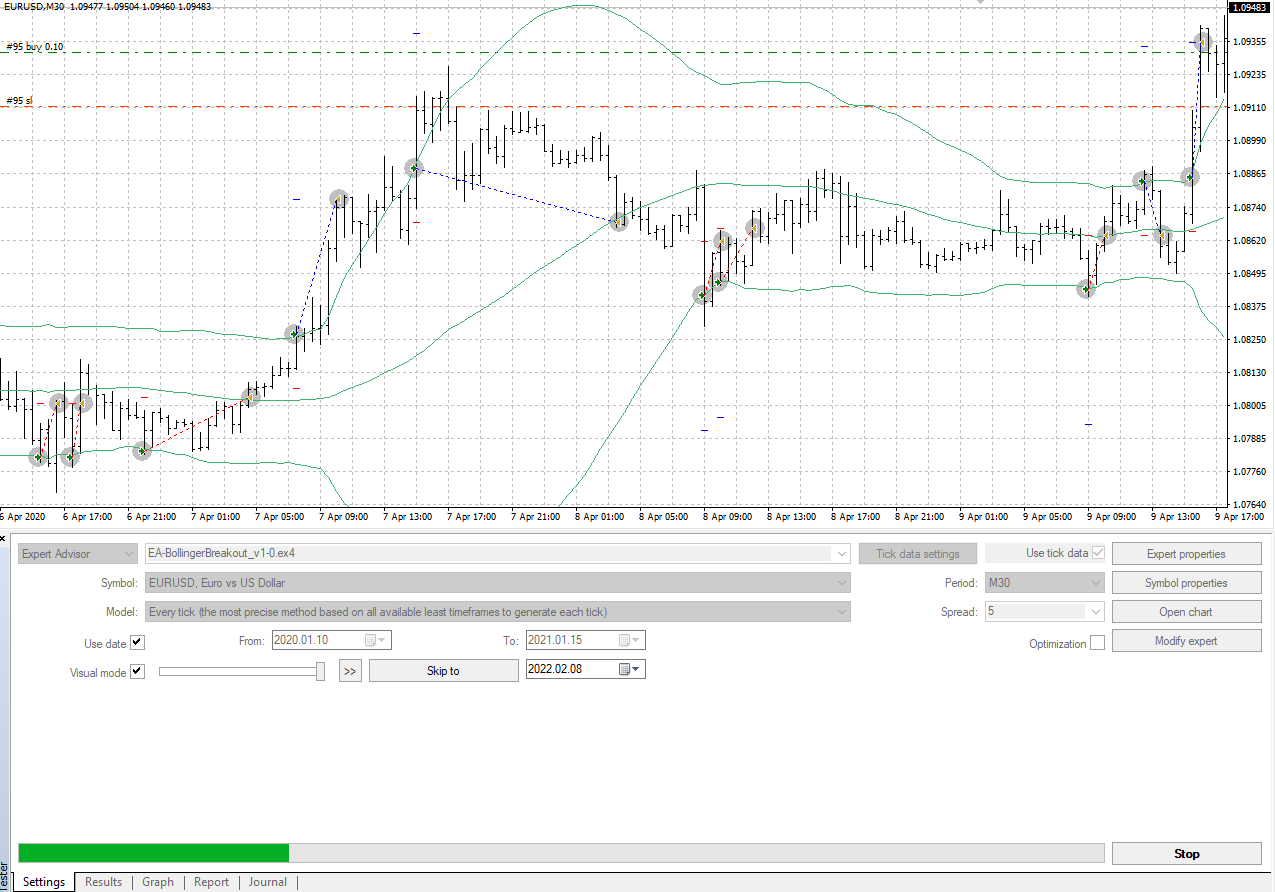
Testing process of the Bollinger Bands indicator in MetaTrader 4
Please find the final test report below. Here you can see the used parameters of the advisor, the dates, the yield curve, and the results achieved.
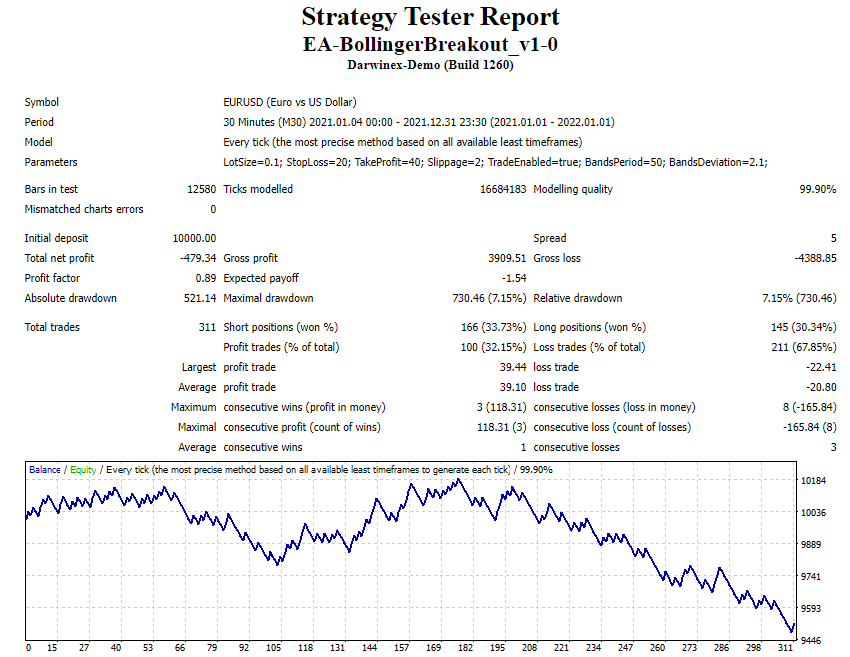
The final test report
The curve shows that trading on a breakdown of the Bollinger Bands according to the simplest rule can be effective only for some time (trades from 105 to 170). In the long run, trading will bring losses, which are largely determined by the size of the spread and the commissions paid.
Therefore, we recommend not using the Bollinger Bands as an independent tool, but adding filters, other indicators, fundamental analysis, volume analysis – anything that can improve the effectiveness of trading on the Bollinger Bands.
Use the strategy tester, demo account, and other features of the MT4 terminal (which is provided by many brokers) to get more predictable results.
FAQs
Are Bollinger Bands important?
Yes. It's used by professional traders and often appears in the reports of Wall Street analysts.
The indicator allows you to evaluate the market volatility, as well as to monitor the overbought and oversold zones. The average SMA line can indicate the direction of the current trend, and you can judge the trend strength by its slope. So, Bollinger Bands is a multifunctional indicator, which is a must-know for traders.
What is Bollinger Band crossover and what is Bollinger alert?
When the price crosses the Upper Band, it is a signal that can be interpreted as the market going into the overbought zone or the potential start of an uptrend.
When the price crosses the Lower Band, it is a signal that can be interpreted as the market going into the oversold zone or the potential start of a downtrend.
How do you use Bollinger Bands for day trading?
You should determine how to trade on a reversal from the Bollinger Bands, or their breakdown. The test result above may suggest that trading on the reversal has a better chance. Next, experiment to see which indicators or techniques will help you to improve your results. For example, if the reversal from the Bollinger Bands coincides with the support/resistance level, then it can be used as an intraday trading strategy.
Is Bollinger Bands a leading indicator?
Smoothed values of historical prices are used when calculating the indicator. This means that Bollinger Bands cannot be considered a leading indicator (in fact, there is no indicator that prices follow). However, note that the indicator solves the problem, in the terms of when the historical base is already considered.
Therefore, it is incorrect to say that Bollinger Bands lags.
Glossary for novice traders
-
1
Expert Advisor
An Expert Advisor (EA) is a piece of software or script used in the MetaTrader trading platform to automate trading strategies. EAs are programmed to execute trading decisions based on predefined criteria, rules, and algorithms, allowing for automated and systematic trading without the need for manual intervention.
-
2
Deviation
The deviation is a statistical measure of how much a set of data varies from the mean or average value. In forex trading, this measure is often calculated using standard deviation that helps traders in assessing the degree of variability or volatility in currency price movements.
-
3
Bollinger Bands
Bollinger Bands (BBands) are a technical analysis tool that consists of three lines: a middle moving average and two outer bands that are typically set at a standard deviation away from the moving average. These bands help traders visualize potential price volatility and identify overbought or oversold conditions in the market.
-
4
Cryptocurrency
Cryptocurrency is a type of digital or virtual currency that relies on cryptography for security. Unlike traditional currencies issued by governments (fiat currencies), cryptocurrencies operate on decentralized networks, typically based on blockchain technology.
-
5
Forex indicators
Forex indicators are tools used by traders to analyze market data, often based on technical and/or fundamental factors, to make informed trading decisions.


Team that worked on the article

Chinmay Soni is a financial analyst with more than 5 years of experience in working with stocks, Forex, derivatives, and other assets. As a founder of a boutique research firm and an active researcher, he covers various industries and fields, providing insights backed by statistical data. He is also an educator in the field of finance and technology.
As an author for Traders Union, he contributes his deep analytical insights on various topics, taking into account various aspects.

Dr. BJ Johnson is a PhD in English Language and an editor with over 15 years of experience. He earned his degree in English Language in the U.S and the UK. In 2020, Dr. Johnson joined the Traders Union team. Since then, he has created over 100 exclusive articles and edited over 300 articles of other authors.

Mirjan Hipolito is a journalist and news editor at Traders Union. She is an expert crypto writer with five years of experience in the financial markets. Her specialties are daily market news, price predictions, and Initial Coin Offerings (ICO).
