Popular Technical Indicators For MT4


Editorial Note: While we adhere to strict Editorial Integrity, this post may contain references to products from our partners. Here's an explanation for How We Make Money. None of the data and information on this webpage constitutes investment advice according to our Disclaimer.
Top 6 Essential MT4 Indicators For Forex Traders:
Moving Averages (MA): Provides a smoothed-out price trend over a specific period, ideal for identifying the direction of the market trend
Parabolic SAR: Offers clear signals for potential trend reversals, making it essential for trend-following strategies
Average Directional Movement Index (ADX): Measures the strength of a trend, invaluable for confirming whether to engage in a trend-following trade.
Volume: Indicates the strength of a market move based on trading volume, which is crucial for validating the robustness of a trend
Bollinger Bands: Measures market volatility and provides overbought or oversold signals, perfect for determining market entry and exit points
Stochastic Oscillator: Compares a security’s closing price to its price range, essential for identifying overbought and oversold conditions
Mastering the use of technical indicators is pivotal in Forex trading. These tools provide traders with crucial insights into market trends, volumes, and dynamics, enabling informed decision-making.
In this article, we will explore the 6 essential MT4 indicators that are free for Forex traders, and how to install them. One should aim to approach these indicators with a clear understanding of their capabilities and limitations. They are not infallible predictors but rather sophisticated instruments designed to analyze historical data and aid in forecasting future market movements.
What is the use of indicators in MT4?
MetaTrader 4 (MT4), a widely-recognized trading platform, offers an extensive suite of indicators, each serving a unique purpose in market analysis.
Feel free to watch our video resource on the topic:
Below you will find all the information.
MT4 indicators are instrumental in enhancing the analytical capabilities of traders. They serve various functions, including:
Oscillators. These indicators are pivotal in identifying overbought and oversold conditions in the market, signaling potential reversal points. Examples include MACD, Stochastic, and RSI, suitable for traders focusing on short-term price fluctuations.
Trend Indicators. Essential for trend following, these indicators help determine the market's direction. They are particularly useful for long-term traders. Prominent examples are SMA, EMA, and ADX.
Volume Indicators. These indicators measure trading volume, providing insights into the strength of a trend or the likelihood of a market reversal. OBV and MFI are commonly utilized in this category.
Volatility Indicators. These tools measure market volatility, aiding in determining optimal entry and exit points. Bollinger Bands and ATR are notable for traders looking to capitalize on market volatility.
Cyclicity Indicators. Useful for predicting future market movements, these indicators help identify recurring patterns in the market. Fibonacci Retracement and Elliott Wave are key examples in this category.
Employing these indicators in MT4 can significantly aid in market analysis, but it is crucial to use them as part of a comprehensive trading strategy, recognizing their strengths and limitations.
Best trading platforms for technical analysis
For technical analysis, TradingView stands out as the best platform, offering advanced charting tools, a vast library of built-in indicators, and robust customization options. However, it is primarily designed for professional traders due to its complexity and wide range of features.
For beginners, MT4/MT5 platforms are more suitable. They come equipped with over 50 built-in indicators and also allow the addition of custom indicators, providing a simpler yet effective way to implement technical analysis strategies.
We compared the trading conditions of brokers that offer these platforms, focusing on parameters such as minimum deposit, spreads for popular currency pairs (EUR/USD and GBP/USD), and the ease of opening an account, to help traders choose brokers that best support their technical analysis needs.
| Plus500 | OANDA | Trading.com USA | |
|---|---|---|---|
|
Min. deposit, $ |
100 | No | 50 |
|
ECN Spread EUR/USD |
No | 0.15 | No |
|
ECN Spread GBP/USD |
No | 0.2 | No |
|
Trading platforms |
WebTrader, Mobile application | MetaTrader4 | MT5, WebTrader, Trading.com App |
|
TradingView |
Yes | Yes | Yes |
|
Open an account |
Go to broker 80% of retail CFD accounts lose money. |
Go to broker Your capital is at risk. |
Go to broker Your capital is at risk. |
Which indicator is best for MetaTrader 4?
Choosing the right indicator in MetaTrader 4 (MT4) can be a game-changer for Forex traders. Based on functionality and popularity, here are the top 6 indicators for MT4, in no particular order:
Moving Averages (MA): A fundamental tool for trend following, Moving Averages help identify the direction of the market trend. They smooth out price data over a specified period, providing a clearer view of the trend direction. This indicator is ideal for traders looking to capitalize on long-term movements.
Parabolic SAR: A go-to for identifying potential reversals in the market trend. The Parabolic SAR (Stop and Reverse) provides clear signals on when to buy or sell, making it a favorite among traders who focus on trend reversal strategies.
The Average Directional Movement Index (ADX): This indicator is a boon for advanced technical analysts. The ADX indicator helps determine the strength of a trend, enabling traders to decide whether to enter a trend-following trade.
Volume: The Volume indicator is crucial for understanding the strength behind price movements. A high volume indicates strong interest in the asset, which can be a sign of a strong trend or an impending reversal.
Bollinger Bands: A versatile indicator used for trading within ranges and identifying potential trend reversals. Bollinger Bands provide a visual representation of market volatility, helping traders make informed decisions on market entry and exit points.
The Stochastic Oscillator: This indicator compares a security’s closing price to its price range over a specific time period. It's instrumental in identifying overbought and oversold conditions, aiding traders in timing their trades effectively.
Each of these indicators offers unique insights and serves different trading strategies. It's essential for traders to understand their individual trading needs and test these indicators to find the best fit for their trading style.
Moving Averages
Moving Averages (MAs) stand out as one of the most popular indicators used in the MetaTrader 4 (MT4) platform, revered for their simplicity and effectiveness. These indicators smooth out price data over a specific period, creating a single flowing line that makes identifying the trend easier.
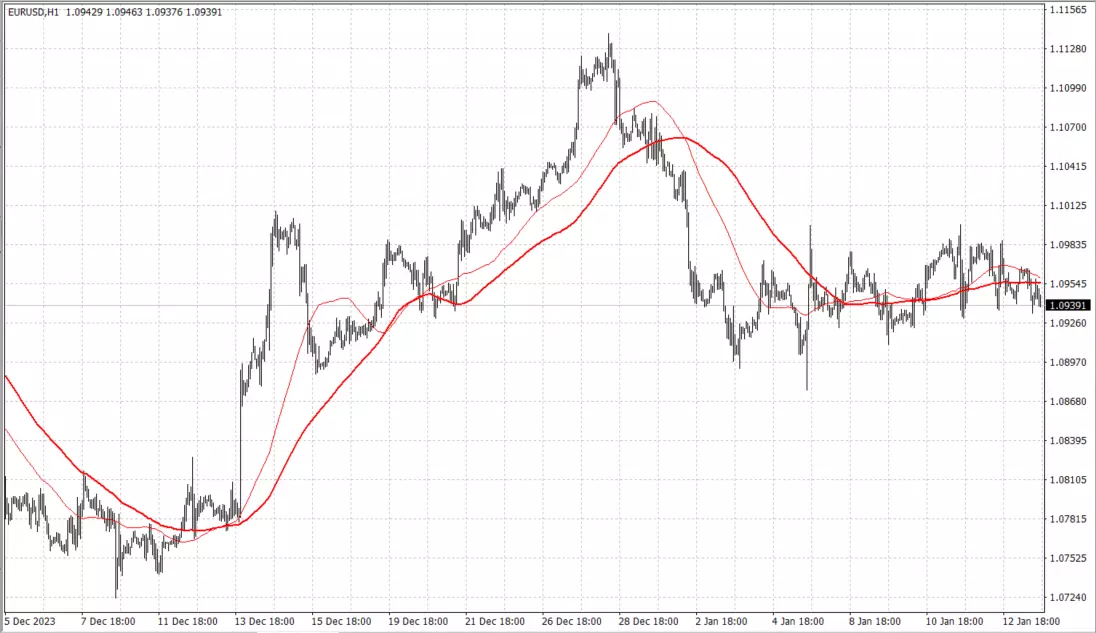 EMA(50) and EMA(100)
Main Features:
Types: The most common types are Simple Moving Average (SMA) and Exponential Moving Average (EMA). SMA calculates the average price over a specific time period, while EMA gives more weight to recent prices.
Timeframes: MAs can be applied to various timeframes, from minutes to months, catering to different trading styles.
How to Use:
Trend Identification: A rising MA indicates an uptrend, while a falling MA suggests a downtrend.
Support and Resistance: MAs can act as dynamic support and resistance levels.
Crossovers: A popular strategy involves observing the crossover of short-term and long-term MAs. For instance, when a short-term MA crosses above a long-term MA, it may signal a buying opportunity.
Moving averages are versatile, easy to use, and can be extremely effective in working with trends, but they can hardly be used as a sufficient tool for making trading decisions. Read also information about How to create a custom indicator in MQL4.
Parabolic SAR
The Parabolic SAR (Stop and Reverse) is a unique and versatile indicator in the MetaTrader 4 toolkit, widely used for its ability to pinpoint potential trend reversals. This indicator is visually represented as dots placed above or below the price on a chart.
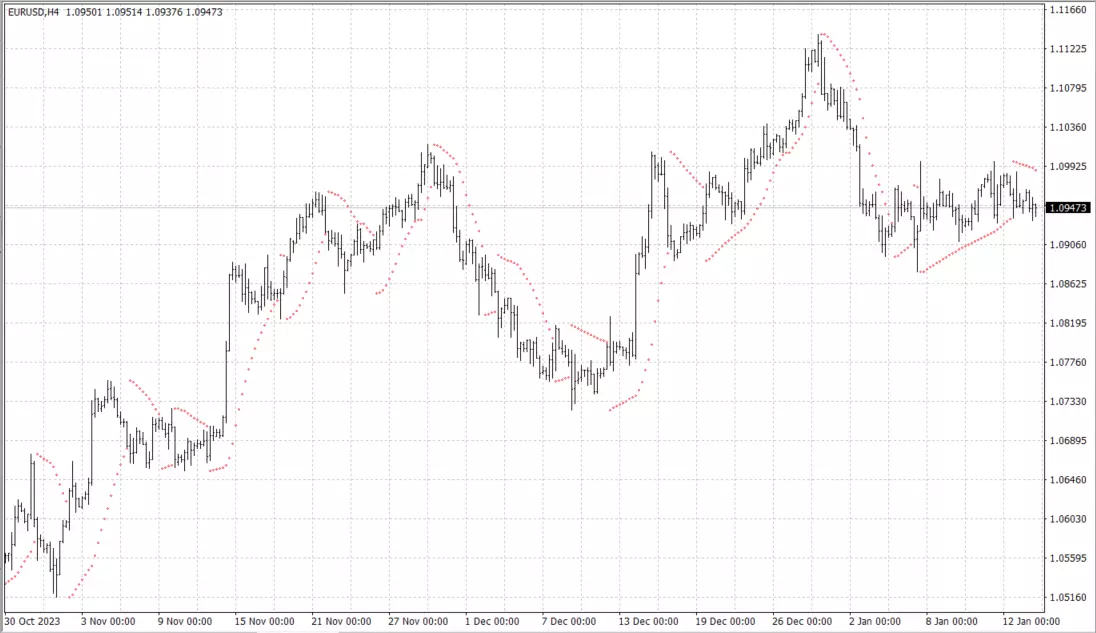 Parabolic SAR
Main Features:
Trend Direction: When dots are below the price, it suggests an uptrend, and when above, a downtrend.
Acceleration Factor: The SAR starts slowly and accelerates with the trend, reflecting market momentum.
Strategies:
Entry and Exit Points: Traders often use Parabolic SAR to identify optimal entry and exit points. For instance, entering a trade when the dots flip below the price in an uptrend and exiting when they flip above.
Stop-Loss Orders: It's also used for trailing stop-loss orders, providing dynamic exit points that adjust with the price movement.
The Parabolic SAR excels in trending markets but may produce false signals in ranging conditions. Thus, it's often paired with other indicators for enhanced accuracy. To use parabolic SAR effectively, it is important to choose the right time period and acceleration factor and to use them in conjunction with other indicators.
ADX
The Average Directional Movement Index(ADX) is a key tool in MT4 for assessing the strength of a trend. It doesn’t indicate the trend direction but gauges how strong or weak a trend is.
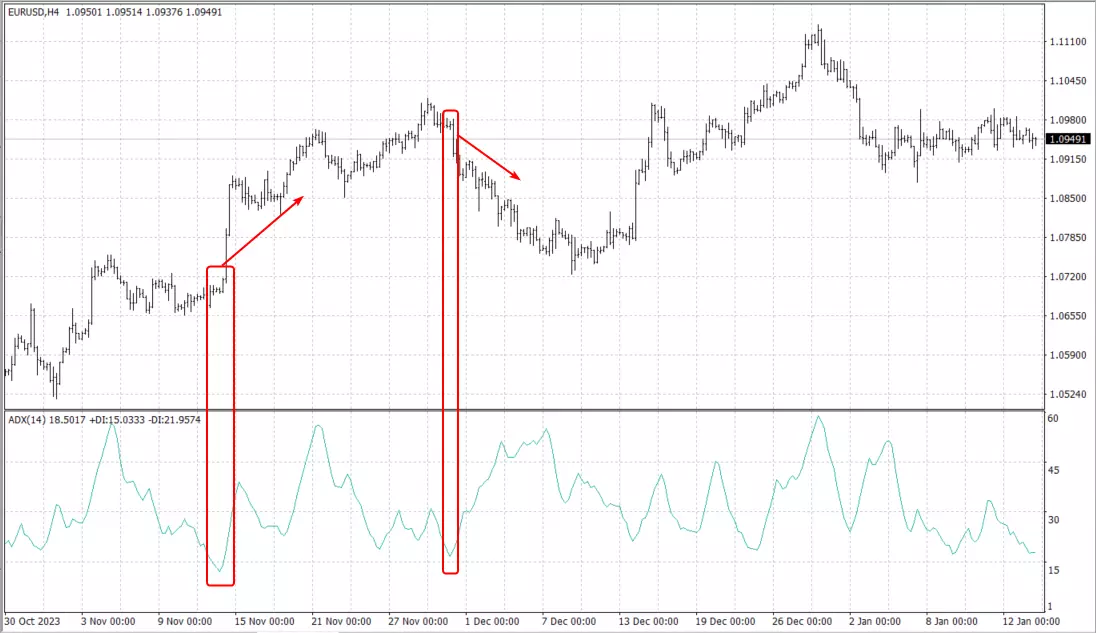 Average Directional Movement Index(ADX)
Main Features:
Range: The ADX fluctuates between 0 and 100, with higher values indicating a stronger trend.
Components: It includes the Positive Directional Indicator (+DI) and Negative Directional Indicator (-DI) to help determine trend direction.
Strategies:
Trend Strength: An ADX value above 25 suggests a strong trend, while below 20 indicates a weak trend.
Crossovers: When +DI crosses above -DI, it may signal a bullish trend, and vice versa for a bearish trend.
ADX is best used in conjunction with other indicators, as it doesn’t provide complete information on its own. It’s ideal for traders looking to strengthen their trend-based strategies.
Volume
Volume, one of the most fundamental indicators in MT4, measures the number of shares or contracts traded for a security or an entire market during a specified period. Along with the usual tick volume, MT4 has the ability to use volume indicators such as Money Flow Index (MFI), On Balance Volume (OBV) and others.
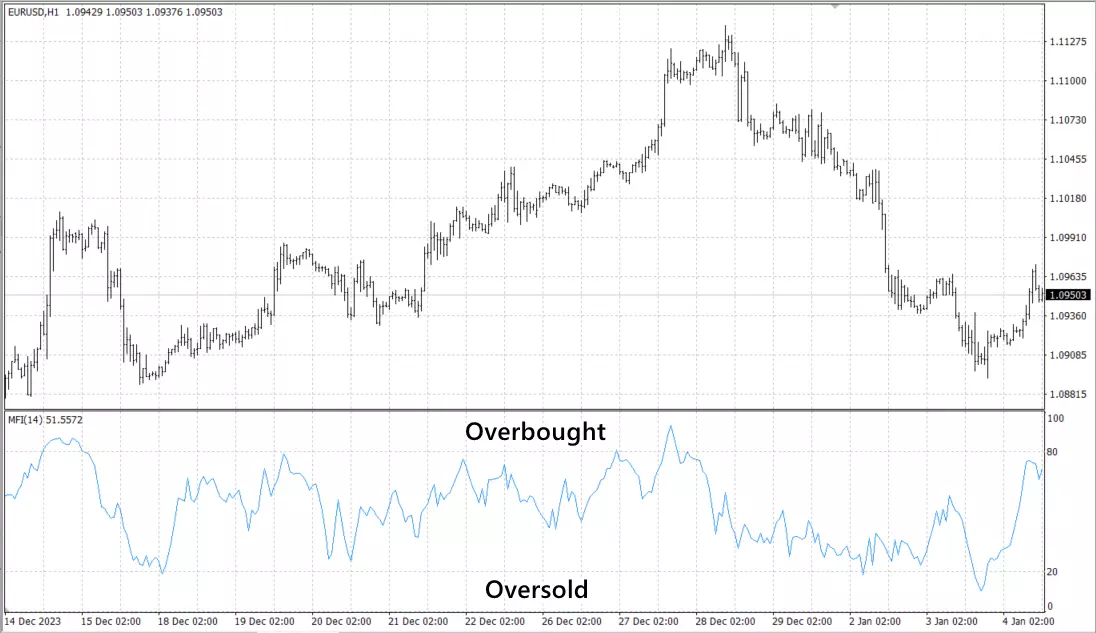 Money Flow Index (MFI)
Main Features:
Market Activity: High volume indicates strong market interest, while low volume suggests less interest.
Confirmation: Volume can confirm trends or chart patterns. Rising volume alongside a price trend strengthens the trend’s validity.
Strategies:
Trend Confirmation: A trend accompanied by increasing volume is seen as robust, whereas a trend with decreasing volume may signal weakness.
Volume Oscillators: Tools like On-Balance Volume (OBV) and Money Flow Index (MFI) help analyze volume changes, providing insights into potential price movements.
Volume indicators are crucial in validating price movements and are often used alongside other technical indicators to bolster trading strategies. They are particularly useful in spotting trend reversals and continuations.
Bollinger Bands
Bollinger Bands are a highly regarded technical analysis tool in MetaTrader 4, known for their ability to measure market volatility. Developed by John Bollinger, these bands consist of three lines: the moving average in the middle, with two outer bands dynamically adjusting to volatility.
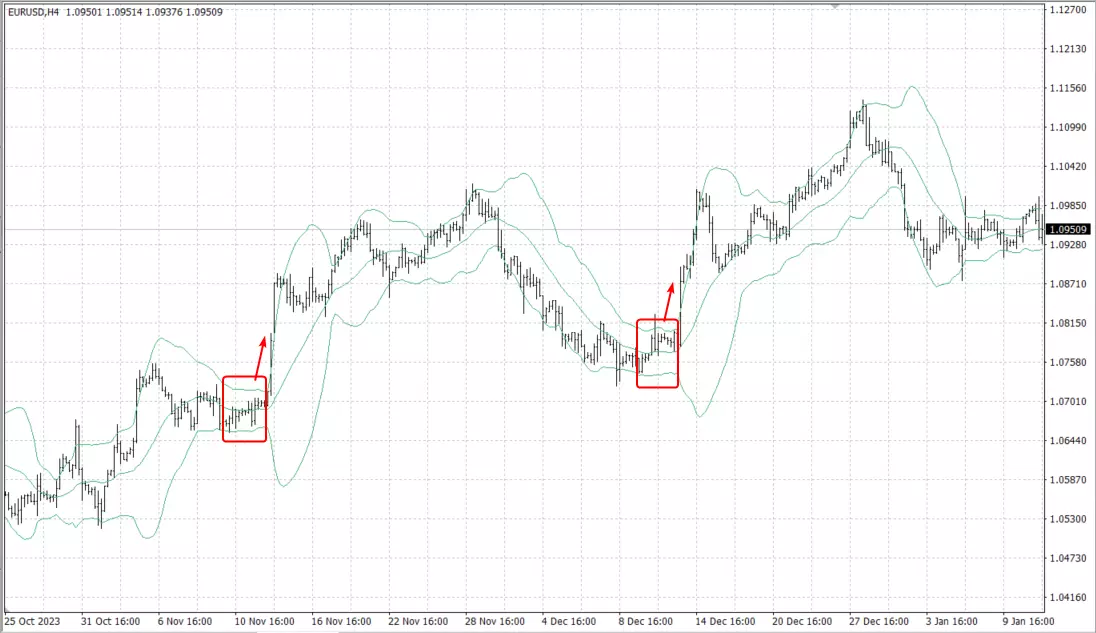 Bollinger Bands
Main Features:
Volatility Indication: The bands widen during high volatility periods and contract during low volatility, providing visual cues about market conditions.
Overbought and Oversold Levels: Prices touching the upper band may indicate overbought conditions, while touching the lower band might signal oversold conditions.
Strategies:
Trend Reversals: Traders often look for price tags of the bands as indicators of potential trend reversals.
Squeeze: A “Bollinger Squeeze”, when bands come close together, can indicate a forthcoming sharp price movement.
Combination with MAs: Combining Bollinger Bands with moving averages can enhance trend identification and entry/exit decision-making.
Bollinger Bands are best utilized in ranging as well as trending markets but should be used in conjunction with other indicators for optimal results.
Stochastic
The Stochastic Oscillator, a momentum indicator in MT4, compares a particular closing price of an asset to a range of its prices over a specific period. This indicator is similar to the Relative Strength Index (RSI) but with its own unique features.
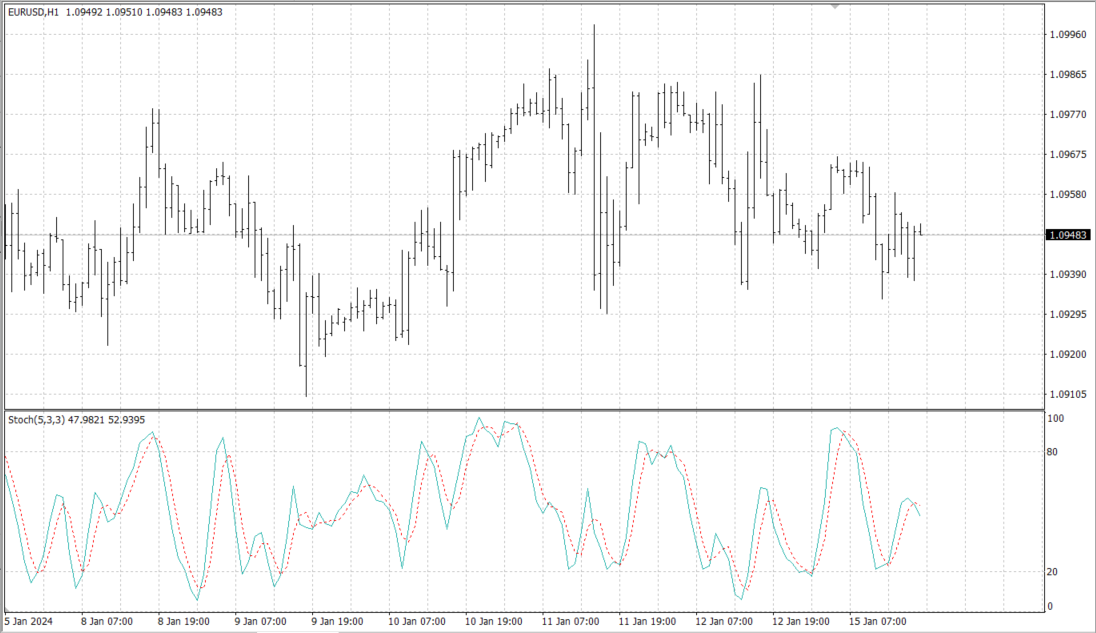 Stochastic, a momentum indicator in MT4
Main Features:
Range Bound: Values range between 0 and 100, indicating overbought conditions above 80 and oversold conditions below 20.
K and D Lines: It consists of two lines, the %K (main line) and %D (signal line), providing trading signals through cross-overs and divergences.
Strategies:
Overbought/Oversold Conditions: Traders use the 80 and 20 levels as signals for potential reversals. A move above 80 suggests an overbought market, while below 20 indicates oversold.
Crossovers: A common strategy involves acting on crossovers between the %K and %D lines. For instance, a bullish signal is generated when the %K line crosses above the %D line, and vice versa for bearish signals.
Divergence: Divergence between the Stochastic Oscillator and the price action is another key signal. Price making a new high while the oscillator fails to do so can be a sign of weakening momentum.
While the Stochastic Oscillator offers valuable insights, especially in sideways markets, it's most effective when combined with other indicators, like the RSI, to confirm signals and avoid false positives.
Download MT4 Indicators For Free
There are plenty of different MT4 indicators out there. Once you choose which ones best match your trading strategy, you can multiple MT4 indicators of various general types - from moving average indicators, to momentum indicators, volume indicators, and trend reversal indicators. Pick the ones that match your strategy and you’ll meet your trading objectives more easily!
ADX

ATR
Bollinger Bands
EW1
Gentor CCI
MA Channels FIBO
Momentum
Roc
Snake
William New
Alligator
Awesome Oscillator
Bulls Power
Fibo Pivots
Heiken ashi
MACD
Moving Averages
RSI
Stochastic Oscillator
ZigZag
AMA & AMA sig
Bears Power
DeMarker
Fx Analizer
Ichimoku Kinko Hyo
MACDdtLSMA
Multi Symbol
Scalper Signal
Trendband
Parabolic SAR
How to install and set up indicators in MT4
Installing and setting up indicators in MetaTrader 4 (MT4) is a straightforward process. Here's a step-by-step guide to get you started:
To Add an Indicator to the MT4 Platform:
Open Data Folder: In MT4, click on “File” at the top left corner and select “Open Data Folder”.
Access Indicator Folder: In the data folder, navigate to “MQL4” and then to “Indicators”.
Copy & Paste Indicator File: Copy the indicator file (usually a .mq4 or .ex4 file) you wish to add.
Paste into “Indicators” Folder: Paste the copied file into the “Indicators” folder.
Reload MT4: Close and reopen MT4 to load the new indicator.
To Add the Indicator to a Chart:
Open the “Insert” Menu: Click on “Insert” at the top of the MT4 platform.
Navigate to “Indicators”: Select “Indicators” from the dropdown menu.
Choose the Indicator: From the list, choose the indicator you want to add. Alternatively, you can drag and drop the indicator from the “Navigator” window onto your chart.
To Adjust Indicator Settings:
Access Indicator Settings: Press “Ctrl+I” on your keyboard to open the “Indicators List” window.
Select the Indicator: Click on the indicator you want to modify and press “Edit”.
Customize Settings: In the settings window, you can adjust various parameters like period, colors, and levels as per your preference.
By following these steps, you can easily install, apply, and customize indicators in MT4, tailoring them to fit your trading strategy and preferences. Remember, while indicators are powerful tools, they should be used as part of a comprehensive trading plan.
What are the benefits of using MT4 indicators?
MetaTrader 4 (MT4) indicators offer numerous advantages to traders, enhancing their analysis and decision-making processes. Here are some of the key benefits:
Enhanced Market Analysis: MT4 indicators provide a deeper understanding of market trends, volumes, and dynamics. This comprehensive analysis helps traders to identify potential trading opportunities and make informed decisions.
Customization and Flexibility: With a wide range of indicators available, MT4 allows users to customize and tailor their analysis to their specific trading style and strategy. Whether it's trend-following, momentum, volume, or volatility indicators, traders can choose what best suits their needs.
Risk Management: Many indicators, especially those related to volatility and momentum, assist in effective risk management. They help in setting appropriate stop-loss and take-profit levels, ensuring traders minimize losses and lock in profits.
Confirmation of Signals: Indicators are excellent tools for confirming trading signals derived from other analyses, such as chart patterns or fundamental analysis. This confirmation helps in reducing the likelihood of false signals and improves the accuracy of trading decisions.
Accessibility: MT4’s user-friendly interface makes it easy for traders of all levels to access and use these indicators, making complex trading decisions more accessible to a broader audience.
Real-time Data Analysis: MT4 indicators provide real-time market analysis, allowing traders to respond promptly to market changes and adjust their strategies accordingly.
What are the disadvantages of indicators in trading?
While MT4 indicators are valuable tools, they come with their own set of disadvantages that traders should be aware of:
Lagging Nature: Many indicators are lagging in nature, meaning they are based on past data. This can result in delayed signals, which might lead to entering or exiting a trade later than the optimal time.
Over-reliance: Relying too heavily on indicators can lead to neglecting other important aspects of trading, such as fundamental analysis or market sentiment. This over-reliance can result in a one-dimensional trading approach.
False Signals: Indicators are not foolproof and can sometimes give false signals, particularly in volatile or sideways markets. This can lead to misinformed trading decisions and potential losses.
Complexity and Overload: With a vast array of indicators available, there’s a risk of information overload. Using too many indicators at once can lead to conflicting signals and confusion, complicating the decision-making process.
Subjectivity: The interpretation of indicator signals can be subjective. Different traders might interpret the same indicator signals in different ways, which can lead to varied and sometimes contradictory trading decisions.
Conclusion
The choice of indicators in platforms like MetaTrader 4 should be a thoughtful process, tailored to individual trading styles and objectives. While indicators offer invaluable insights and aids in decision-making, they are not one-size-fits-all solutions.
Each trader must assess their goals, risk tolerance, and strategy preferences when selecting indicators. Balancing technical analysis with other market analysis forms, and integrating sound risk management practices, is crucial for achieving long-term success in trading. Remember, indicators are tools to inform your decisions, not dictate them.
FAQs
Where can I find MT4 indicators?
MT4 indicators can be found within the MetaTrader 4 platform under the 'Navigator' window, or they can be downloaded from various online sources and forums dedicated to Forex trading.
What are the leading indicators in MT4?
Most of the default indicators (such as the Stochastic Oscillator, Relative Strength Index (RSI), and Moving Average Convergence Divergence) installed in MT4 use various ways of averaging past price values - so they can hardly be considered leading indicators. However, using them to look for divergences can give hints of a trend reversal before it actually occurs. Fibonacci levels can also be considered a leading indicator in MT4.
Are Forex Indicators Effective?
Forex indicators can be effective in analyzing market trends and making informed trading decisions, but their effectiveness depends on correct usage and combining them with other forms of analysis.
Are indicators enough for trading?
Indicators alone are not sufficient for trading; they should be used as part of a comprehensive trading strategy that includes fundamental analysis, risk management, and an understanding of market psychology.
Editors' Top Picks and Insights

Lindsey Graham death: U.S. senator’s crypto legacy

Tether under pressure: USDT in Europe, audit questions, and the fight for trust

Lean Ethereum: Why Buterin wants to rebuild the network

SK Hynix debuts on Nasdaq: Largest U.S. offering by foreign company

SpaceX falls out of orbit: Does anyone still want Musk’s stock?

The crypto IPO problem: How high-profile listings became investor traps
Related Articles
Team that worked on the article
Vuk stands at the forefront of financial journalism, blending over six years of crypto investing experience with profound insights gained from navigating two bull/bear cycles. A dedicated content writer, Vuk has contributed to a myriad of publications and projects.
Dr. BJ Johnson is a PhD in English Language and an editor with over 15 years of experience. He earned his degree in English Language in the U.S and the UK.
Tobi Opeyemi Amure is an editor and expert writer with over 7 years of experience. In 2023, Tobi joined the Traders Union team as an editor and fact checker, making sure to deliver trustworthy and reliable content.
Bollinger Bands (BBands) are a technical analysis tool that consists of three lines: a middle moving average and two outer bands that are typically set at a standard deviation away from the moving average. These bands help traders visualize potential price volatility and identify overbought or oversold conditions in the market.
Index in trading is the measure of the performance of a group of stocks, which can include the assets and securities in it.
Uptrend is a market condition in which prices are generally rising. Uptrends can be identified by using moving averages, trendlines, and support and resistance levels.
Forex trading, short for foreign exchange trading, is the practice of buying and selling currencies in the global foreign exchange market with the aim of profiting from fluctuations in exchange rates. Traders speculate on whether one currency will rise or fall in value relative to another currency and make trading decisions accordingly. However, beware that trading carries risks, and you can lose your whole capital.
An investor is an individual, who invests money in an asset with the expectation that its value would appreciate in the future. The asset can be anything, including a bond, debenture, mutual fund, equity, gold, silver, exchange-traded funds (ETFs), and real-estate property.

-
 Afghanistan
-
 Albania
-
 Algeria
-
 Angola
-
 Argentina
-
 Armenia
-
 Australia
-
 Austria
-
 Azerbaijan
-
 Bahamas
-
 Bahrain
-
 Bangladesh
-
 Belarus
-
 Belgium
-
 Bolivia
-
 Botswana
-
 Brazil
-
 Brunei
-
 Bulgaria
-
 Cambodia
-
 Cameroon
-
 Canada
-
 Chile
Chile
-
 China
China
-
 Colombia
-
 Congo
Congo
-
 Costa Rica
-
 Cote d'Ivoire
-
 Croatia
-
 Cuba
Cuba
-
 Cyprus
-
 Czechia
-
 DR Congo
-
 Denmark
-
 Dominican Republic
-
 Ecuador
-
 Egypt
Egypt
-
 El Salvador
-
 Estonia
-
 Eswatini
-
 Ethiopia
-
 Finland
-
 France
-
 Georgia
-
 Germany
-
 Ghana
Ghana
-
 Greece
-
 Haiti
Haiti
-
 Hong Kong
-
 Hungary
-
 India
India
-
 Indonesia
-
 Iran, Islamic republic
-
 Iraq
Iraq
-
 Ireland
-
 Israel
-
 Italy
Italy
-
 Jamaica
-
 Japan
Japan
-
 Jordan
-
 Kazakhstan
-
 Kenya
Kenya
-
 Korea
Korea
-
 Kuwait
-
 Kyrgyzstan
-
 Laos
Laos
-
 Latvia
-
 Lebanon
-
 Lesotho
-
 Libya
Libya
-
 Lithuania
-
 Luxembourg
-
 Madagascar
-
 Malaysia
-
 Malta
Malta
-
 Mauritius
-
 Mexico
-
 Moldova
-
 Mongolia
-
 Montenegro
-
 Morocco
-
 Mozambique
-
 Myanmar
-
 Namibia
-
 Nepal
Nepal
-
 Netherlands
-
 New Zealand
-
 Nigeria
-
 North Macedonia
-
 Norway
-
 Oman
Oman
-
 Pakistan
-
 Palestine
-
 Panama
-
 Papua New Guinea
-
 Paraguay
-
 Peru
Peru
-
 Philippines
-
 Poland
-
 Portugal
-
 Puerto Rico
-
 Qatar
Qatar
-
 Reunion
-
 Romania
-
 Rwanda
-
 Saudi Arabia
-
 Serbia
-
 Singapore
-
 Slovakia
-
 Slovenia
-
 Somalia
-
 South Africa
-
 Spain
Spain
-
 Sri Lanka
-
 Sweden
-
 Switzerland
-
 Syria
Syria
-
 Taiwan
-
 Tajikistan
-
 Tanzania
-
 Thailand
-
 Trinidad and Tobago
-
 Tunisia
-
 Turkey
-
 UAE
UAE
-
 Uganda
-
 Ukraine
-
 United Kingdom
-
United States
-
 Uruguay
-
 Uzbekistan
-
 Venezuela
-
 Vietnam
-
 Yemen
Yemen
-
 Zambia
-
 Zimbabwe
- Forex
- Crypto
