How to Use ATR Indicator in Trading - Review


Editorial Note: While we adhere to strict Editorial Integrity, this post may contain references to products from our partners. Here's an explanation for How We Make Money. None of the data and information on this webpage constitutes investment advice according to our Disclaimer.
How to use ATR indicator in trading:
Setting a stop loss with reference to the level of volatility and key levels.
Confirmation of the direction of the trend for the growth of volatility.
Identification of potential trend reversal points based on the price range.
What does ATR mean? Average True Range is an indicator that measures volatility.
ATR was introduced in 1978, when the book titled New Concepts in Technical Trading System by J.Welles Wilder was published. Also Parabolic SAR, RSI, ADX indicators were introduced in this book.
Despite that ATR does not provide trading signals, it is actively used by traders in all markets (Forex, crypto, stocks).
Read more about:
How the ATR indicator works;
Pros and cons of the indicator;
How to use ATR in stock trading;
FAQ.
This article was written by a professional trader working with Traders Union.
What does the ATR indicator mean?
The ATR indicator is available by default on all platforms for trading analysis. Usually, you can find it under the price chart.
Absolute values of the indicator depend on the figures of the price change of the selected financial instrument. For example, on the 5-minute Bitcoin chart shown on the screenshot below, the ATR values are around 140. What does it mean?

This means that in current conditions, the change of the 1 Bitcoin price by plus/minus 140 dollars within 5 minutes is within the expected range.
Another example. On the day charts of oil futures ATR = 2.80.

This means that if the price of 1 barrel of Brent oil changes by $2.80 in one day (regardless of whether up or down), it will be considered a normal dynamics.
How Does an ATR indicator work?
In order to calculate the value of ATR indicator, you need to find 3 differences:
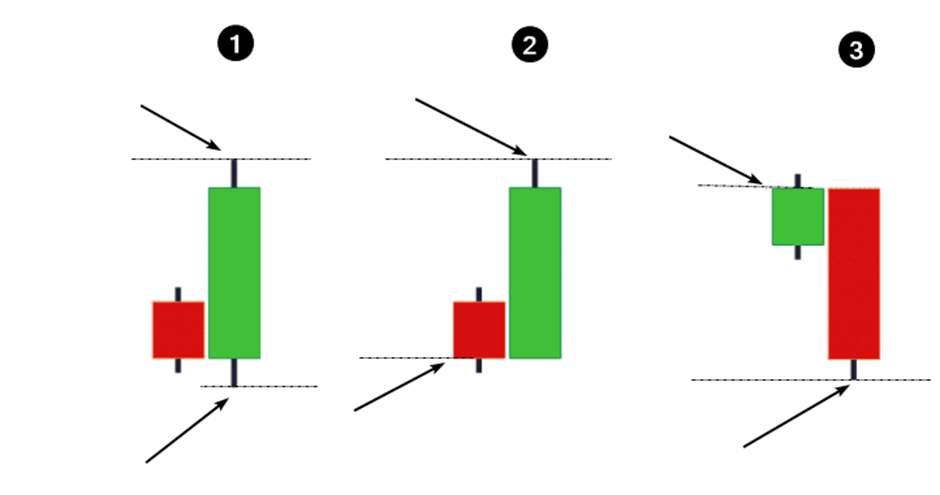
The difference between the current high and low
The difference between the current high and the previous close
The difference between the low and the previous close
The highest difference between the three by the module is the value to use.
This difference is titled True Range:
True Range = Max(High[1]-Low[1]; High[1]-Close[2]; Close[2]-Low[1])
Then, the smoothing is performed – a simple average value for the period is calculated.
Average True Range = SMA (TrueRange, Period).
Usually, 14 latest values are used as a period.
Pros and cons of the ATR indicator
- Pros
- Cons
- Suitable for working on different timeframes – for short-term trading inside the day and for investing on long-term charts
- Is not redrawn
- Is available on the popular trading platforms by default
- Has a changeable period for setting up sensitivity
- Smoothing is used in the ATR calculation formula; this adds a lagging property to the indicator.
- The indicator is not
- The indicator is not a self-sufficient tool, it does not provide trading signals. Use ATR in combination with other methods for making trading decisions.
Usually, traders look at the ATR value in order to determine the stop loss level, but there are other ways to use it (as we will show below).
In addition, ATR can mislead those novice traders, who believe that this indicator is connected to the strength of a trend. This is not true.
Example.
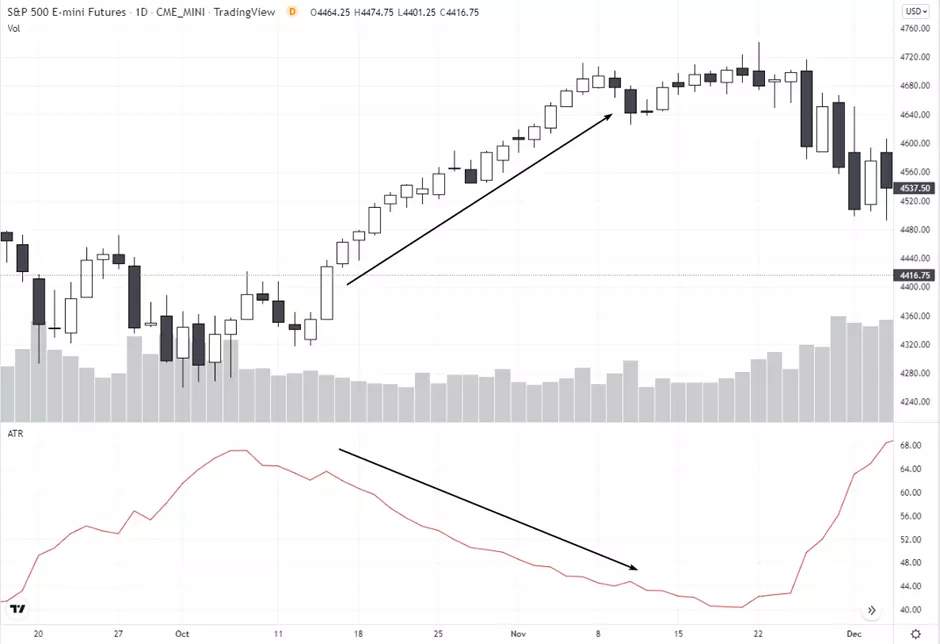
Look at the day chart of S&P 500 futures. The arrow shows that the values of the indicator were gradually decreasing when the market showed a stable bullish trend.
Keep in mind that ATR and the trend are not related.
How Do You Use ATR in day trading
Below are the methods of using the ATR indicator for day trading and for investing on the day / week charts.
1. How to set stop loss based on the ATR indicator
This the most popular method of using the ATR indicator
Let’s assume that you are monitoring the gold market. The metal is showing bullish dynamics against the background of the news of increasing geopolitical tension. You see that the price on the 1h chart is approaching its previous high at around 1881.6 and aggressively breaks out. You enter a long position on the 5-minute chart, for example at 1883. Where should you place the stop loss?
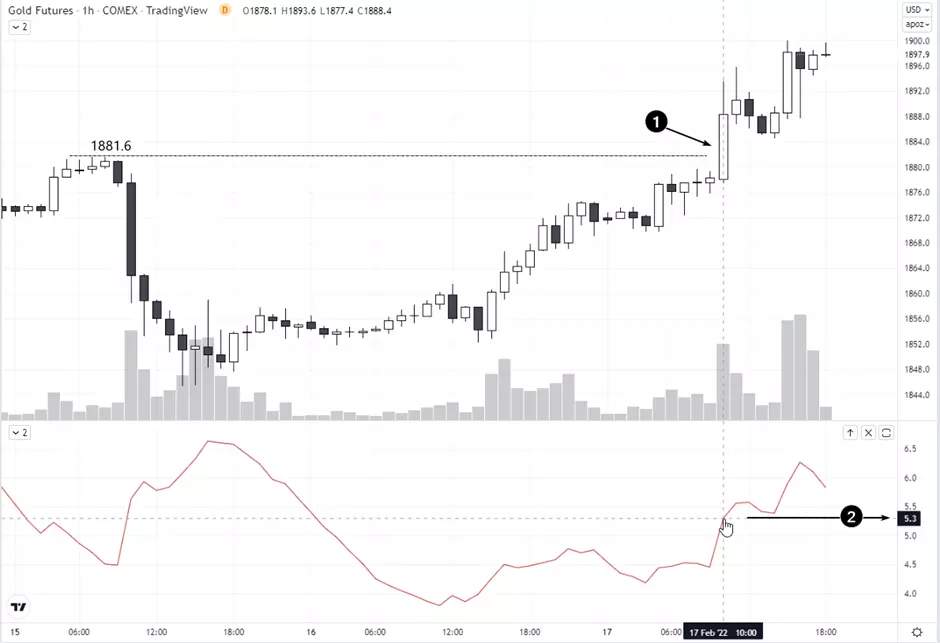
Use the ATR values. At the moment of the breakout (2), the ATR equaled $5.5. This means that the level for setting the stop loss = 1883 - 5.5 = 1877.5.
Using the ATR, the traders seem to give the price space to pull back and fluctuate within the noise.
However, if the price turns against the impulse and travels the distance that exceeds the Average True Range, it will mean that the impulse was false and that it is most likely a mistake to hold a long position, which could lead to critical losses.
Tip. A stop loss is typically set with a multiplier ranging from 1 to 4 depending on the risk profile. For example, by multiplying the ATR by 2 to determine the stop loss level, you expand the range of acceptable fluctuations. At the same time, it is necessary to choose goals that correspond to the risks.
A stop loss is typically set with a multiplier ranging from 1 to 4 depending on the risk profile. For example, by multiplying the ATR by 2 to determine the stop loss level, you expand the range of acceptable fluctuations. At the same time, it is necessary to choose targets that correspond to the risks.
- Pros of setting Stop Loss based on ATR:
- Cons of setting Stop Loss based on ATR:
- Simple mathematical calculation.
- Usually, the majority sets Stops beyond the local extremums. Using the ATR, you don’t follow “the crowd”.
- There is no element of subjectivity that can exist when you choose a local extremum for setting the Stop Loss after it.
- Setting stop loss based on ATR can be easier emotionally.
- A multiplier of 1 to 4 is often used to set the stop. Choosing the optimal multiplier value can be a difficult task.
2. Setting Take Profit
The ATR indicator can be used not only to set Stop Loss, but also Take Profit.
Example.
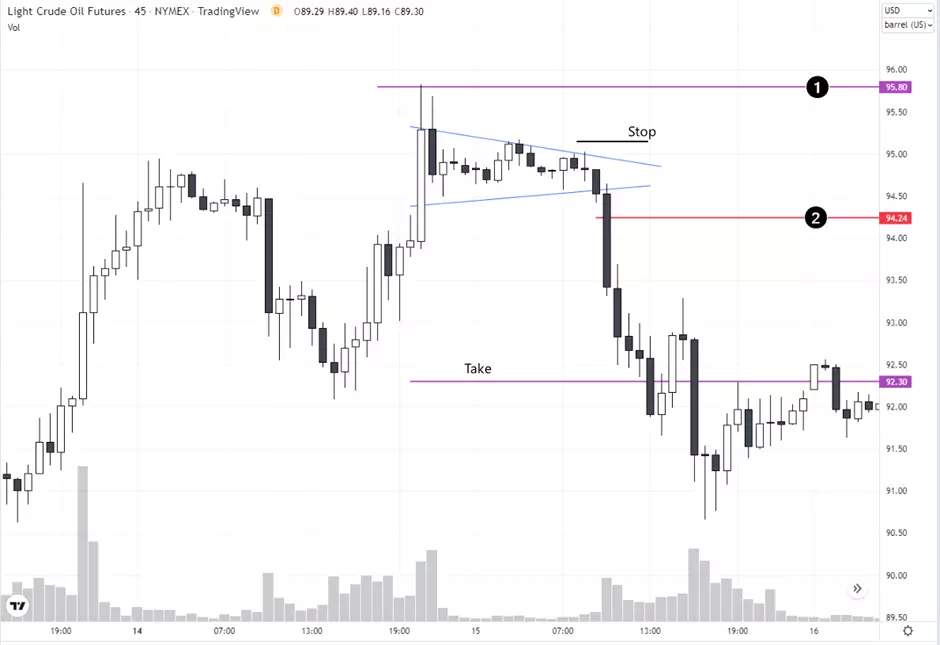
Let’s assume that you determined that ATR = $3.50 on the day chart. This means that a decline of the price by $3.50 from the day’s high will be normal dynamics.
On the 45-minute timeframe, you notice a triangle (consolidation, local flat during the Asian session). On the bearish breakout of the triangle you enter a short position (2), let’s say at 94.24.
You set the Stop behind the upper edge of the triangle.
Where should you place Take? Subtract the ATR from the (assumed) high of the day = 95.80 - 3.50 = 92.30. The resulting take profit size provides a comfortable risk-to-reward ratio.
- Pros of setting a Take Profit based on the ATR indicator:
- Cons of the method:
- Allows you to increase the size of the reward. The ATR allows you not to leave the trend earlier than you need to.
- The method is applicable to different markets.
- It is not very certain that the price will reach take profit or won’t continue its movement along the trend.
3. Predicting the trend
We realize that nobody can ever predict a trend with certainty, but sometimes the ATR indicator can quite successfully be used for this purpose.
Example.
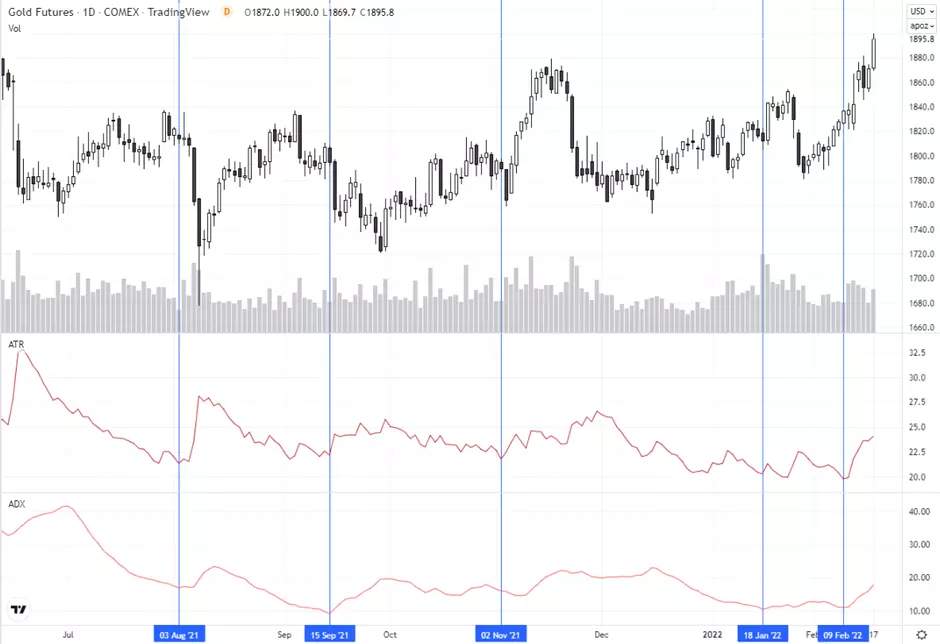
The ATR and ADX indicators are placed on the day gold chart.
ADX shows the strength of the trend and the ATR indicator shows volatility. When both indicators are moving towards minimum values it means that the market is in deep calm. Therefore, the probability of a trend movement is increasing.
On the chart, 5 days are marked, when the two indicators were at their minimums. Soon after the marked days, strong movements happened.
- Pros of the method:
- Cons of the method:
- The combination of ATR and ADX helps you to be on alert when others lose their guard watching a dull market.
- It helps open a position at the early stages of a trend.
- There are no indications about the direction of the expected trend
- There is no certainty that the trend will start. The price may continue to move in a sideways trend, even if ATR and ADX reached their minimum values.
4. Trailing while using the ATR indicator
This method describes how to manage trailing stop loss by using ATR.
The example below (30-minute EUR/USD chart) shows lines that extend up/down from the price for a distance equal to 3 * ATR.

Let’s assume that you entered a long position on the breakout of the high. Using the triple ATR, you can set a stop loss and then gradually increase it, following the impulse.
- Pros of the method:
- Cons of the method:
- ATR allows you to manage the risk of the position: for as long as there is a trend, the position is held, otherwise it closes.
- Trailing stop loss can be set up in an automatic mode
- It is believed that the movement of stop loss following the ATR is more effectgive than using MA for these purposes.
- It is difficult to choose the optimal value of the multiplier. Usually a value between 2 and 4 is used, but there is no guarantee that the position will be closed on time.
How to set up the ATR indicator
Classic ATR indicator is usually available on all trading platforms. Setting it up is easy.
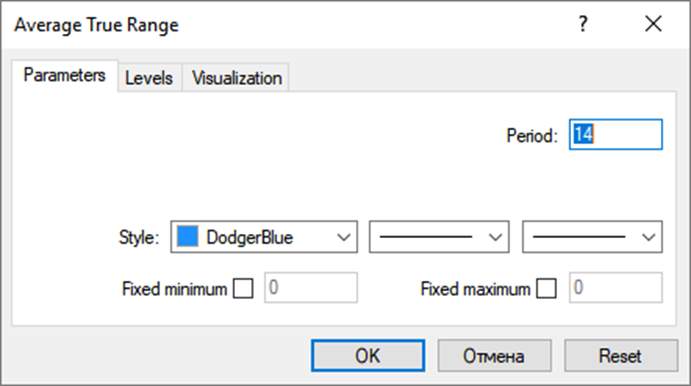
What is the ATR period? This is a parameter that shows how many previous prices need to be taken into account. By default the value is 14. The higher the value, the smoother the lines and the lower the sensitivity of the indicator is.
How do you use the ATR indicator for profit?
There is no miraculous indicator that guarantees profit.
if the price crosses 3*ATR from bottom to top, close the short and enter the long position.
if the price crosses 3*ATR from top to bottom, close the long position and enter short.
Based on this strategy, the position will always be open – long or short, depending on the direction of the trend. The more stable the development of the trend, the higher the profit. If the market is stuck in a prolonged flat, the strategy will bring losses.
The chart below shows examples of trades and the result of testing in the Bitcoin market (1h timeframe).
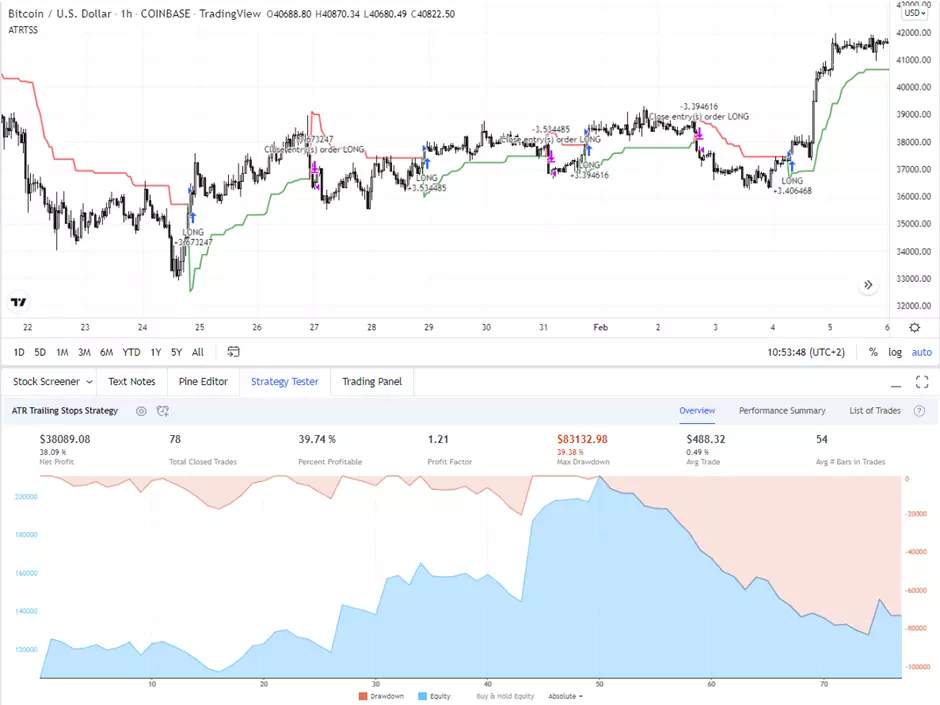
78 trades – that is not enough to judge the stability of the strategy;
In other markets / timeframes, the strategy shows both profitable and unprofitable results.
Studies show that trading by simple rules using ATR will bring profit with a 50/50 change.
Conclusions
The ATR indicator is used to assess the market from the standpoint of its volatility. The higher the ATR, the more volatile the price. ATR is not used as a standalone instrument in simple mechanical trading; usually it is an element in trading strategies, where different methods of technical and fundamental analysis are used.
Check how the ATR indicator can help you find Stop Loss and Take Profit levels;
Make sure that it is reasonable to use ATR on historical data;
Combine the ATR with trading based on support and resistance levels, technical analysis patterns and other methods;
Pay attention to the breakouts of important levels, when the ATR is at its minimum values.
It is important not to allow the possibility of increase of losses to the critical levels and leave the potential for profit growth.
FAQs
What is the ATR indicator used for?
Average true range (ATR) is an indicator that measures volatility. The ATR indicator does not take into account the presence of the trend, its direction and/or strength.
ATR is usually used for searching for potential breakouts, determining the levels of Stop Loss and Take Profit.
How to interpret the ATR indicators?
ATR is not redrawn. Interpretation is simple:
Growth of the ATR indicator points to rising volatility
Decline of the ATR indicator points to decreasing volatility.
ATR is not trying to predict the future direction of the price.
What is the best volatility indicator?
In addition to the ATR indicator, Bollinger Bands, Keltner Channel, Donchian Channel, and also the VIX indicator (for the stock market) can be used to measure volatility.
There is no one right answer about which of them is the best. A lot depends on personal preferences and specific market. Try everything in order to understand what suits you best.
What is the difference between ATR and ADR?
Average daily range (ADR) rules out price gaps, while the formula for calculating the ATR indicator can include the difference in prices, which is formed by the gap.
Editors' Top Picks and Insights

Hunting crypto owners: Why criminals have gone offline

BitMEX is shutting down: Why Trump could not save the exchange

Do governments need crypto workers?

Brent nears $100: Why oil prices are rising

Gram Wallet launch: Can Telegram bring crypto to the masses?

AI without limits: How dangerous are neural networks?
Related Articles
Team that worked on the article
Mikhail Vnuchkov joined Traders Union as an author in 2020. He began his professional career as a journalist-observer at a small online financial publication, where he covered global economic events and discussed their impact on the segment of financial investment, including investor income.
Olga Shendetskaya has been a part of the Traders Union team as an author, editor and proofreader since 2017. Since 2020, Shendetskaya has been the assistant chief editor of the website of Traders Union, an international association of traders.
Volatility refers to the degree of variation or fluctuation in the price or value of a financial asset, such as stocks, bonds, or cryptocurrencies, over a period of time. Higher volatility indicates that an asset's price is experiencing more significant and rapid price swings, while lower volatility suggests relatively stable and gradual price movements.
Short selling in trading involves selling an asset the trader doesn't own, anticipating its price will decrease, allowing them to repurchase it at a lower price to profit from the difference.
A trading system is a set of rules and algorithms that a trader uses to make trading decisions. It can be based on fundamental analysis, technical analysis, or a combination of both.
Index in trading is the measure of the performance of a group of stocks, which can include the assets and securities in it.
Forex indicators are tools used by traders to analyze market data, often based on technical and/or fundamental factors, to make informed trading decisions.

-
 Afghanistan
-
 Albania
-
 Algeria
-
 Angola
-
 Argentina
-
 Armenia
-
 Australia
-
 Austria
-
 Azerbaijan
-
 Bahamas
-
 Bahrain
-
 Bangladesh
-
 Belarus
-
 Belgium
-
 Bolivia
-
 Botswana
-
 Brazil
-
 Brunei
-
 Bulgaria
-
 Cambodia
-
 Cameroon
-
 Canada
-
 Chile
Chile
-
 China
China
-
 Colombia
-
 Congo
Congo
-
 Costa Rica
-
 Cote d'Ivoire
-
 Croatia
-
 Cuba
Cuba
-
 Cyprus
-
 Czechia
-
 DR Congo
-
 Denmark
-
 Dominican Republic
-
 Ecuador
-
 Egypt
Egypt
-
 El Salvador
-
 Estonia
-
 Eswatini
-
 Ethiopia
-
 Finland
-
 France
-
 Georgia
-
 Germany
-
 Ghana
Ghana
-
 Greece
-
 Haiti
Haiti
-
 Hong Kong
-
 Hungary
-
 India
India
-
 Indonesia
-
 Iran, Islamic republic
-
 Iraq
Iraq
-
 Ireland
-
 Israel
-
 Italy
Italy
-
 Jamaica
-
 Japan
Japan
-
 Jordan
-
 Kazakhstan
-
 Kenya
Kenya
-
 Korea
Korea
-
 Kuwait
-
 Kyrgyzstan
-
 Laos
Laos
-
 Latvia
-
 Lebanon
-
 Lesotho
-
 Libya
Libya
-
 Lithuania
-
 Luxembourg
-
 Madagascar
-
 Malaysia
-
 Malta
Malta
-
 Mauritius
-
 Mexico
-
 Moldova
-
 Mongolia
-
 Montenegro
-
 Morocco
-
 Mozambique
-
 Myanmar
-
 Namibia
-
 Nepal
Nepal
-
 Netherlands
-
 New Zealand
-
 Nigeria
-
 North Macedonia
-
 Norway
-
 Oman
Oman
-
 Pakistan
-
 Palestine
-
 Panama
-
 Papua New Guinea
-
 Paraguay
-
 Peru
Peru
-
 Philippines
-
 Poland
-
 Portugal
-
 Puerto Rico
-
 Qatar
Qatar
-
 Reunion
-
 Romania
-
 Rwanda
-
 Saudi Arabia
-
 Serbia
-
 Singapore
-
 Slovakia
-
 Slovenia
-
 Somalia
-
 South Africa
-
 Spain
Spain
-
 Sri Lanka
-
 Sweden
-
 Switzerland
-
 Syria
Syria
-
 Taiwan
-
 Tajikistan
-
 Tanzania
-
 Thailand
-
 Trinidad and Tobago
-
 Tunisia
-
 Turkey
-
 UAE
UAE
-
 Uganda
-
 Ukraine
-
 United Kingdom
-
United States
-
 Uruguay
-
 Uzbekistan
-
 Venezuela
-
 Vietnam
-
 Yemen
Yemen
-
 Zambia
-
 Zimbabwe
- Forex
- Crypto
