What is ADX?
The Average Directional Index (ADX) is an indicator that shows the strength of a trend. The indicator was developed in 1978 by J. Welles Wilder, a technical analyst.
ADX is easy to understand and it is applicable to trend trading in any market (Forex, crypto, stocks, etc.) and in both intraday and long-term investing charts.
In this article, written by a professional trader, you will read about:
how to use the ADX indicator;
disadvantages and advantages of the indicator;
trading strategies using the ADX indicator;
how to set up the ADX indicator;
answers to popular questions
How to use the ADX Indicator?
The trend is your friend because trading with the trend increases the chances of making a profit.
But how do you know that the market has established a trend? The ADX indicator will help you find the answer.
The indicator usually appears at the bottom in the area below the price chart and is an oscillator whose values range from 0 to 100. In practice, the indicator line rarely goes below 10 or above 60.
This is what ADX looks like when added to a chart in the TradingView platform.
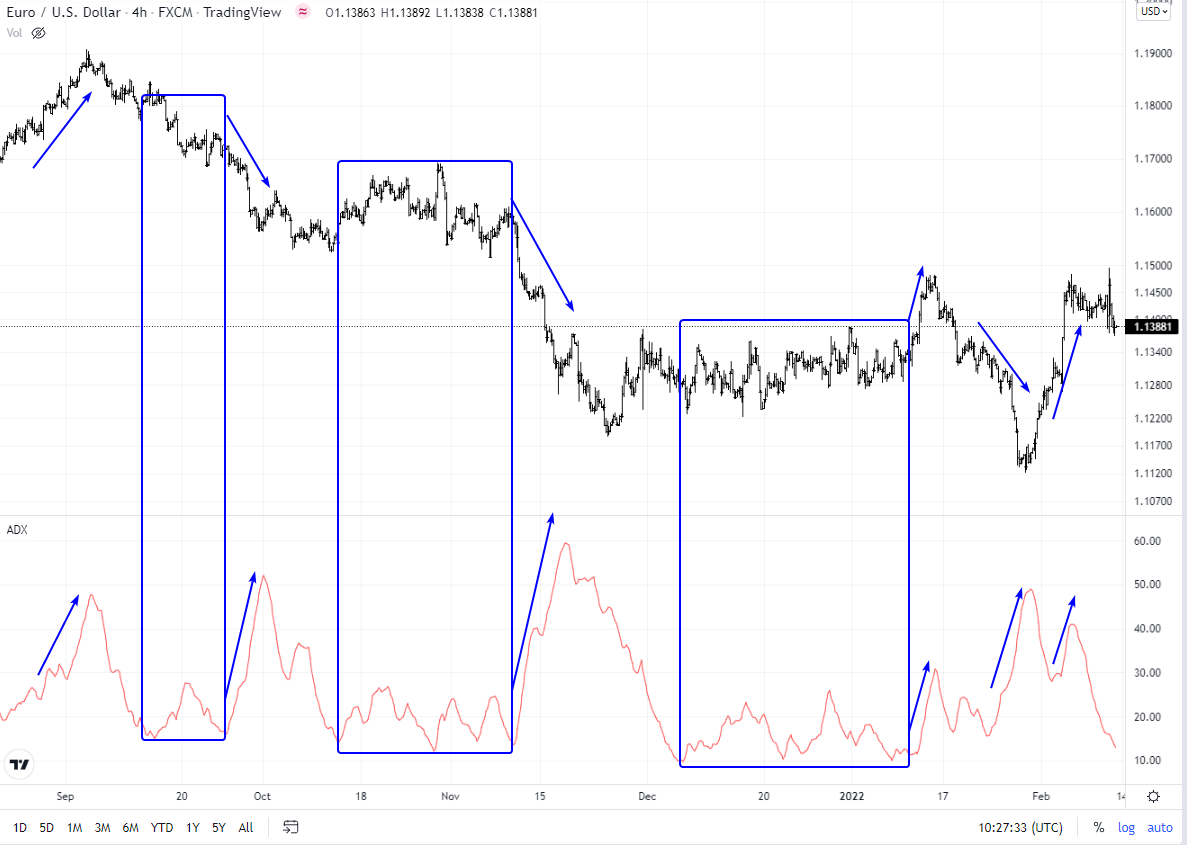
ADX indicator
The red line below is the ADX.
On the EUR/USD 4-hour chart above, the rectangles show three periods when the ADX indicator values were low. These are periods of flat market or low volatility.
The arrows show the growth of ADX and the corresponding increase of activity in the market — the price changed more directionally either up or down.
It is considered that:
-
If the ADX indicator values are above 25, there is a trend in the market.
-
If ADX < 25, then the market is flat.
Is ADX a good indicator?
Advantages and disadvantages of the ADX indicator
Not a single indicator can give you a signal with a 100% profit accuracy.
ADX does not give buy and sell signals on its own, as it is designed to determine the presence of a trend. However, the info it shows can also be disappointing.
👍 Pros
• The ADX indicator works on all timeframes and markets
• It’s not redrawn
• It’s easy to interpret
• Included by default in popular trading platforms
• It has a variable period to adjust the sensitivity
The advantage of the indicator is that it automatically takes into account the current market volatility because the calculation formula uses ATR (Average True Range) values.
👎 Cons
• When ADX indicates a strong trend, momentum may actually be exhausted.
• The indicator is not a self-sufficient tool, as it does not give trading signals.
• Use ADX information in conjunction with other decision-making methods to build a comprehensive strategy.
Normally traders analyze the strength of the trend using the ADX tool, and then, after making sure that the market is moving, they look for an entry point in the direction of the trend.
Question. Is ADX a lagging indicator?
The creator of the ADX Wilder indicator used smoothing, so we can reasonably assume that the indicator has the property of lagging.
However, massive trends are not born in the twinkle of an eye and usually end gradually. ADX with default settings has sufficient sensitivity to fix the strengthening or weakening of the trend strength without critical delays.
Trading strategies using the ADX indicator
All ADX trading strategies can be used for intraday trading, as well as by investors on daily/weekly charts.
1. Basic trading strategy
The strategy involves opening positions when a trend is established in the market. For this, the classic ADX level of 25 is used.
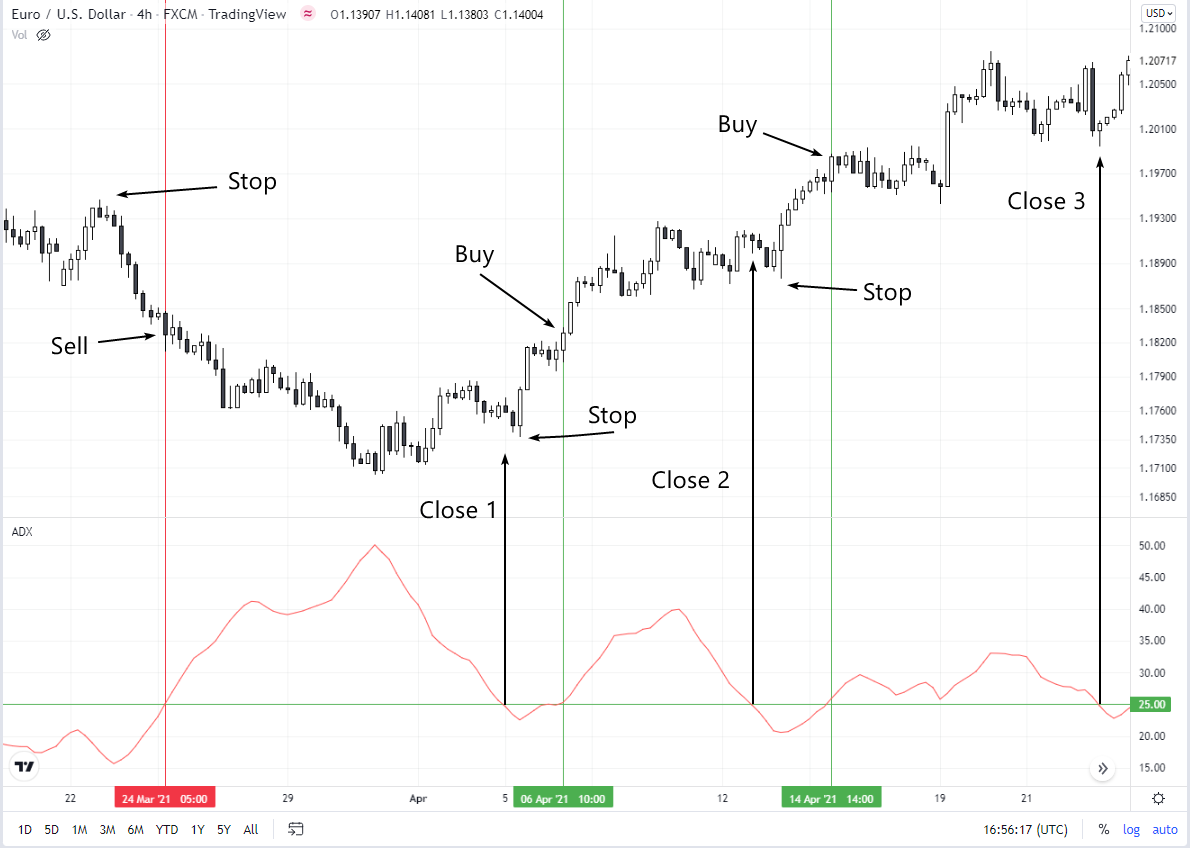
ADX trading strategy
For example, the 4-hour EUR/USD chart above shows 3 trades - one for sale and 2 for buying. All three were profitable.
A sell signal comes when ADX crosses level 25 upwards. At the same time, the price moves down. This means that opening a short position will be justified. Stop loss is usually placed behind the previous local maximum. In the example above, this is a fairly wide stop-loss, which may mean a reduction of the position amount to comply with the risks. The position should be closed when the ADX indicator crosses level 25 from the top downward. This means that the trend is over.
The first buying signal comes when ADX crosses level 25 upwards amid the price growth. The stop is placed below the previous low and the trade is held as long as the ADX is above level 25.
The second buying signal comes when ADX, crossing level 25 from the bottom upwards amid rising prices, signals that the bullish trend is resuming. The stop is placed behind the previous low, and the trade is held while ADX is above level 25. But in this case, it was not possible to increase profit in the position, because the trend was exhausted.
👍 Advantages of the basic strategy:
• It is designed for trend trading. By following the simple rules, you won’t miss a single big move.
• Plenty of setups on any market/timeframe.
• Automatically takes into account volatility.
👎 Disadvantages of the strategy:
• You have to independently determine the direction of the formed trend. Although it’s not that difficult.
• Sometimes the stops can be too wide.
• The trend may end immediately after ADX crosses line 25 from the bottom upwards. Then the position will bring a loss.
An important disadvantage of the described method will be the situation when the trend changes its direction sharply, and the ADX line does not fall below level 25.
2. Breakout trading
The strategy involves entering a position when the market exits the deep flat stage.
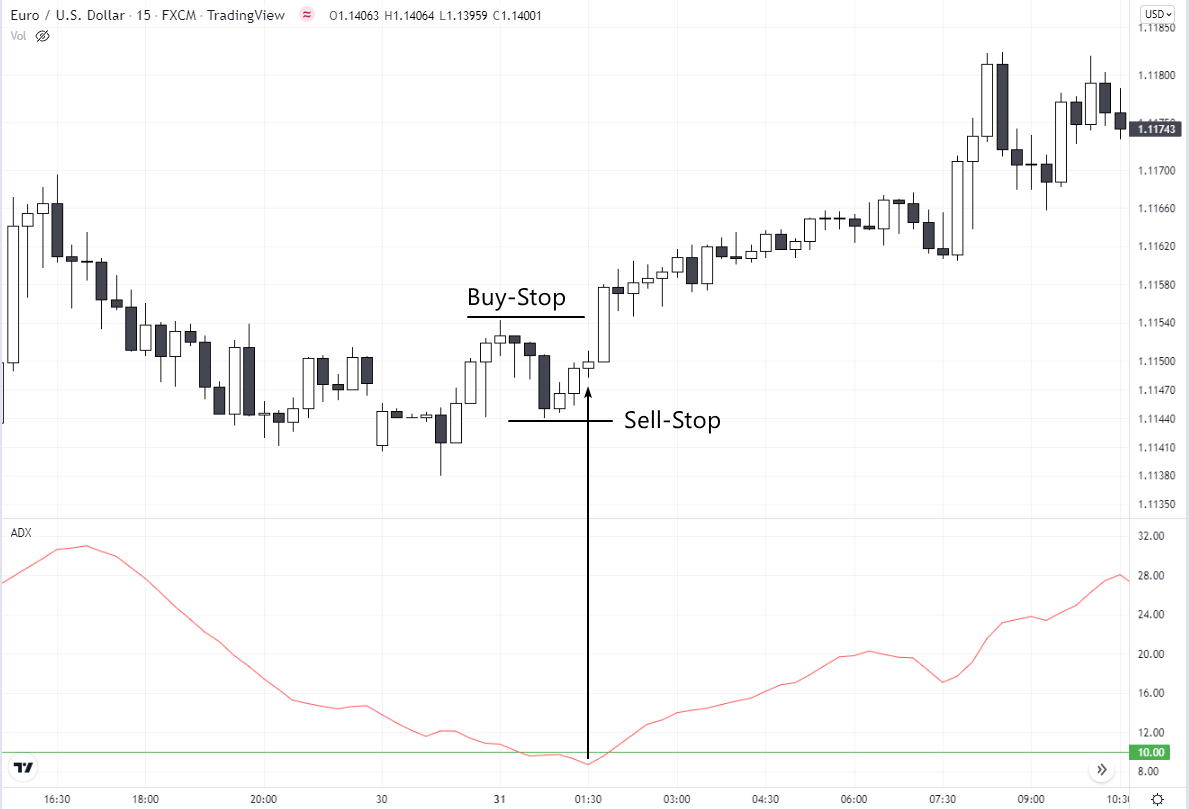
ADX trading strategy
The 15-minute EUR/USD chart shows that ADX is falling below level 10. This means that the market is deep flat. The emerging momentum can attract new traders and develop into a long-term trend.
To try to “catch” the momentum at the very beginning, you can:
-
wait until ADX drops below 10
-
set the buy-stop at the level of the previous high
-
place a sell-stop at the previous low
In the above example, the buy-stop order was triggered, while the sell-stop remained as a protective stop-loss. While the price was going up, you can gradually raise the stop loss (trailing tactics) to bring the position to breakeven first, and then protect the growing profit (if the situation is favorable)
It is rational to apply the strategy when the probability of strong movements after protracted consolidations increases.
The chart below shows an example of a sell trade in the gold market.
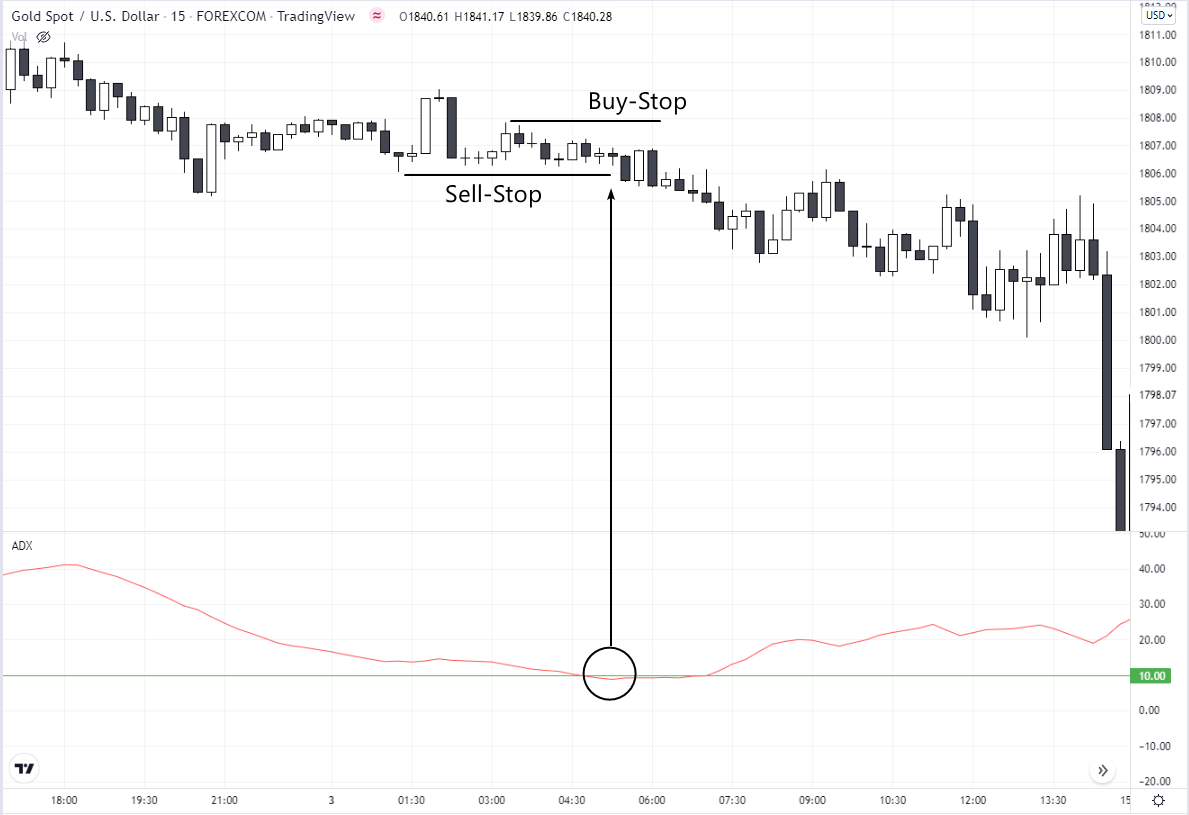
ADX trading strategy
👍 Strategy pros:
• It allows you to reduce risks
• It applies to different markets and periods
• It does not require additional analysis to select the direction of the transaction because the market itself will choose where it wants to go.
👎 Strategy cons:
• Sometimes you have to wait for moments of deep calm too long
• The choice of levels for placing pending orders is not always obvious
• Choosing an exit point for a trade can be challenging.
3. Trading with DI- and DI+ lines
This ADX trading strategy is suitable for those who want to have an additional tool for determining the direction of the trend and the time to exit the position.
The example below shows a chart from the MetaTrader terminal with the ADX indicator. But why three lines?
Black line is ADX
Red line is DI-
Green line is DI+
DI- and DI+ are indicators also developed by technical analyst J. Welles Wilder for use with ADX.
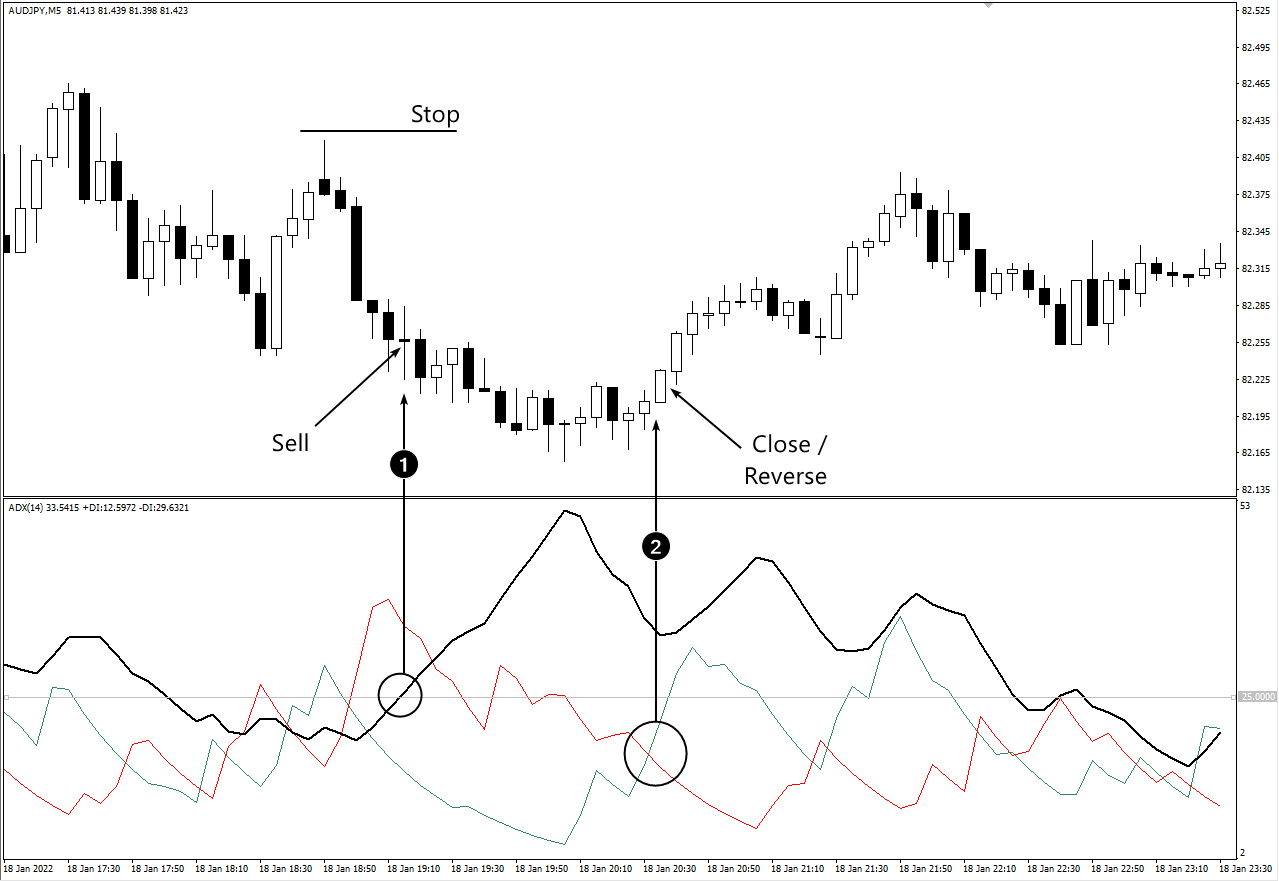
ADX trading strategy
What are DI- and DI+? These are the Directional Index indicators that show changes in price declines and increases:
If DI- line is over DI+, then it’s a downtrend
If DI+ is over DI-, then it’s uptrend
In fact, the DI- and DI+ lines underlie the calculation of the ADX indicator line. The greater the distance between DI- and DI+, the greater the ADX value is.
The chart shows an example of a sell trade (1). To enter short, 2 conditions must be met:
The black ADX line crosses level 25 from the bottom upwards
Red DI- line is higher than DI+
The stop in this case is too wide, which implies a decrease in the position volume. The exit from the trade is indicated by arrow 2. The signal to close shorts (or turn to longs) is the intersection of DI+ and DI-. When the green line of the indicator is above the red one, it means that the trend has not ended, but has changed its direction.
The example shows that if you wait for a signal to close a short position from the ADX line crossing level 25 from the top downward, this may be a bad idea.
4. Swing trading strategy
ADX can be used for medium-term trading. It may be necessary to correct the level of trend establishment for this.
The example below (this is a daily chart of the Canadian dollar) shows entry and exit points for a short position with lines.
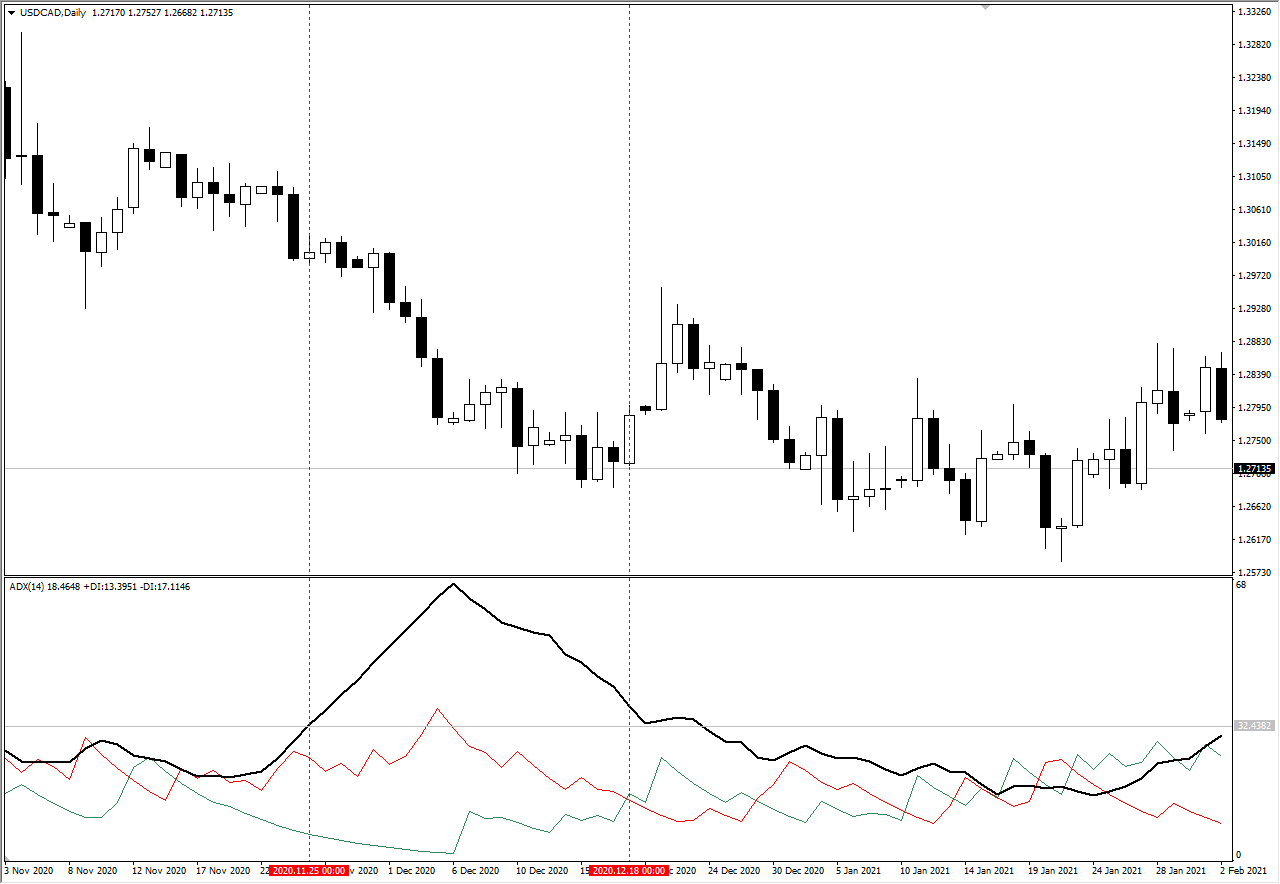
ADX trading strategy
A short entry signal is received when:
-
ADX exceeds signal level 33. We determined it experimentally.
-
The red line DI- is above DI+
An exit signal is received when:
-
Red line DI- drops below DI+
-
A falling ADX line confirms that the downtrend has been exhausted.
How to set up the ADX indicator
It doesn't take much effort to set up the ADX indicator.
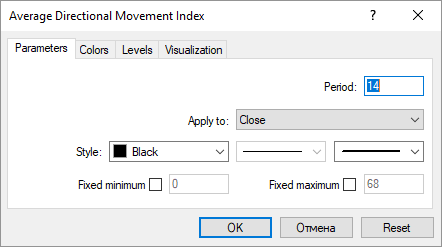
Set up the ADX indicator
Period. This is the indicator period. By default, it is 14. The larger the value, the smoother the lines will be, and the fewer crossover signals you will have.
Apply to. This represents which candle prices to use for the indicator calculation formula.
ADX ReviewIs ADX trading profitable?
We conducted a study of a simple advisor, which is based on the classical rules.
Buy entry is when:
-
ADX crosses line 25 from the bottom upwards;
-
and DI- is above DI+
Exit a position by fixed stop loss and take profit values.
Below you can see a screenshot of the advisor testing process in MetaTrader 4.
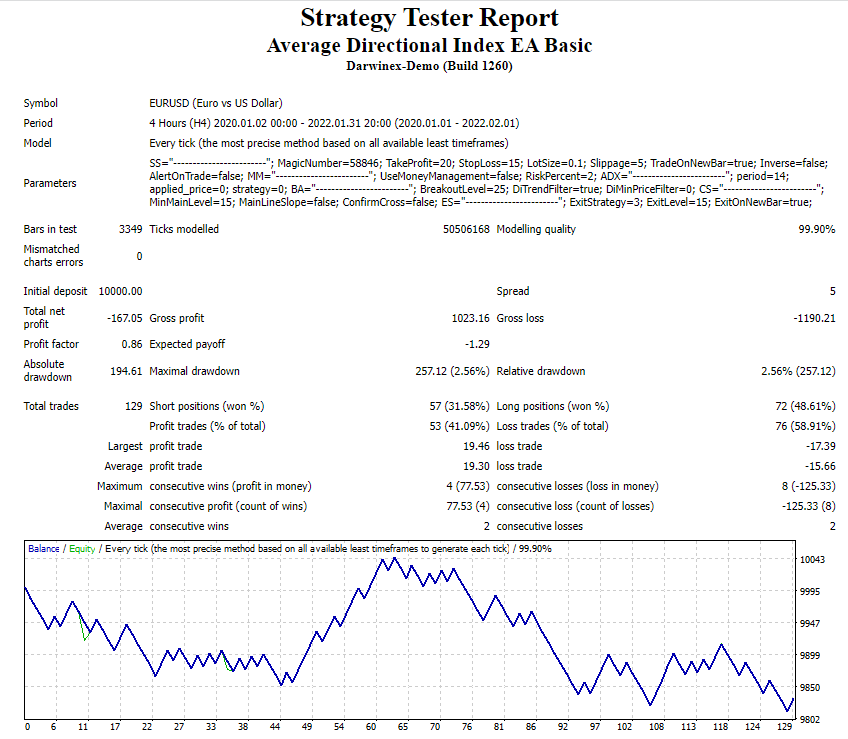
Testing process in MetaTrader 4
The curve shows that the average result is negative, which is largely determined by the width of the spreads and the size of the broker’s commission. Nevertheless, it can be argued that from time to time there are conditions on the market when trading using a simple classical strategy with the ADX indicator can bring a steady profit such as in the series of transactions from 44 to 61 in the profit chart above.
Best Forex Brokers
The best brokers for beginners listed below not only allow you to trade but have a demo account to help you practice. Also, they allow low initial deposits and offer opportunities for passive income.
RoboForex


RoboForex is an online broker that offers many trading services, including forex. They also provide traders with Pro-Cent, Pro-Standard, and RAMM live accounts. This way, traders can make passive income while trading. Roboforex offers an excellent online trading environment for traders. Also, it allows minimal deposit and charges a competitive spread rate for deposits. The broker provides a remarkable third-party integration of platforms, including MT4 and MT5.
RoboForex Bonus - How to Get Forex Bonus for FreeAvaTrade

Avatrade is a comprehensive platform for forex traders. It is a good option for beginners who employ technical analysis as their trading strategy. Also, you can engage in forex trading with little or no commission. Avatrade can be integrated with MT4 and MT5 that use technical indicators, candlestick time frames, and chart analysis. It also provides a free demo account that you can use to test your strategies risk-free.
Avatrade offers the copy trading feature that allows you to make passive income. Many learning resources that can aid you in understanding pricing charts are available on Avatrade.
eToro

eToro is a perfect platform for carrying out many kinds of trades with little or no commission. It is a trusted forex broker that provides a platform for you to run your chosen forex strategies seamlessly. eToro offers a demo account for beginners to test their strategy before entering the real market. Also, one peculiar feature of eToro that attracts new forex traders is free to copy trading. eToro aids beginners to copy trade by recommending expert traders. This way, beginners can get engaged and make passive income.
eToro Fees and Commissions ReviewConclusions
Trading with the ADX indicator while using simple rules may initially make a positive impression, but it is unlikely that success will be able to develop consistently for a long time.
Tips from a professional trader:
-
consider how ADX can give you an advantage in your trading style
-
test your ideas by creating a strategy and testing it on historical data;
-
experiment by combining ADX trading with support and resistance levels, technical analysis patterns, and other techniques to provide a trading edge;
-
try trading with the ADX indicator on a demo account to make sure your ideas are correct
It is important not to allow the possibility of growing losses to a critical size and leave the potential for profit growth.
FAQs
What is the best setting for the ADX indicator?
There are no universal settings that work equally well year after year.
Pay attention to the test report above, it was carried out for a period of 13 months. Only a few months out of that time, the market was one where the default ADX settings worked well. Then there were changes.
The nature of the market is influenced by many factors such as the macroeconomic dynamics, the actions of the Central Bank, the state of national economies, and geopolitics. Therefore, the settings of indicators, including ADX, must always be adapted to the nature of the market.
Where do I find ADX?
Normally, you don’t need to download it from third-party resources. Most trading platforms include ADX by default in the set of provided indicators. However, to create and use automatic strategies based on ADX, you will have to insure that you have the most up-to-date version of the tool.
What is an ADX crossover
As a rule, by crossing the ADX indicator, they mean the intersection of the main line with level 25. This is a classic level that determines whether there is a trend in the market or not.
Alternatively, the ADX crossover can mean the crossover between the DI+ and DI- lines, which indicate the direction of the trend.
How is ADX calculated?
First, the values of the DI+ and DI- lines are calculated. If prices rise for a specified period of time, then DI+ increases, and DI- values are equal to zero. Conversely, if prices decrease, then DI- increases, and DI+ values are equal to zero. The difference between DI+ and DI- is then calculated and smoothed. This is how ADX is obtained. And all three lines in the set are also called Directional Movement Index.
Glossary for novice traders
-
1
Forex Trading
Forex trading, short for foreign exchange trading, is the practice of buying and selling currencies in the global foreign exchange market with the aim of profiting from fluctuations in exchange rates. Traders speculate on whether one currency will rise or fall in value relative to another currency and make trading decisions accordingly. However, beware that trading carries risks, and you can lose your whole capital.
-
2
Forex bonus
A forex bonus is a promotional incentive offered by brokers to attract traders, typically providing additional funds or trading benefits upon fulfilling certain conditions.
-
3
Swing trading
Swing trading is a trading strategy that involves holding positions in financial assets, such as stocks or forex, for several days to weeks, aiming to profit from short- to medium-term price swings or "swings" in the market. Swing traders typically use technical and fundamental analysis to identify potential entry and exit points.
-
4
Investor
An investor is an individual, who invests money in an asset with the expectation that its value would appreciate in the future. The asset can be anything, including a bond, debenture, mutual fund, equity, gold, silver, exchange-traded funds (ETFs), and real-estate property.
-
5
Short selling
Short selling in trading involves selling an asset the trader doesn't own, anticipating its price will decrease, allowing them to repurchase it at a lower price to profit from the difference.


Team that worked on the article

Oleg Tkachenko is an economic analyst and risk manager having more than 14 years of experience in working with systemically important banks, investment companies, and analytical platforms. He has been a Traders Union analyst since 2018. His primary specialties are analysis and prediction of price tendencies in the Forex, stock, commodity, and cryptocurrency markets, as well as the development of trading strategies and individual risk management systems. He also analyzes nonstandard investing markets and studies trading psychology.
Also, Oleg became a member of the National Union of Journalists of Ukraine (membership card No. 4575, international certificate UKR4494).

Olga Shendetskaya has been a part of the Traders Union team as an author, editor and proofreader since 2017. Since 2020, Shendetskaya has been the assistant chief editor of the website of Traders Union, an international association of traders. She has over 10 years of experience of working with economic and financial texts. In the period of 2017-2020, Olga has worked as a journalist and editor of laftNews news agency, economic and financial news sections. At the moment, Olga is a part of the team of top industry experts involved in creation of educational articles in finance and investment, overseeing their writing and publication on the Traders Union website.

Mirjan Hipolito is a journalist and news editor at Traders Union. She is an expert crypto writer with five years of experience in the financial markets. Her specialties are daily market news, price predictions, and Initial Coin Offerings (ICO).
