Top 10 candlestick patterns every trader must know

Editorial Note: While we adhere to strict Editorial Integrity, this post may contain references to products from our partners. Here's an explanation for How We Make Money. None of the data and information on this webpage constitutes investment advice according to our Disclaimer.
Top 10 candlestick patterns every trader should know:
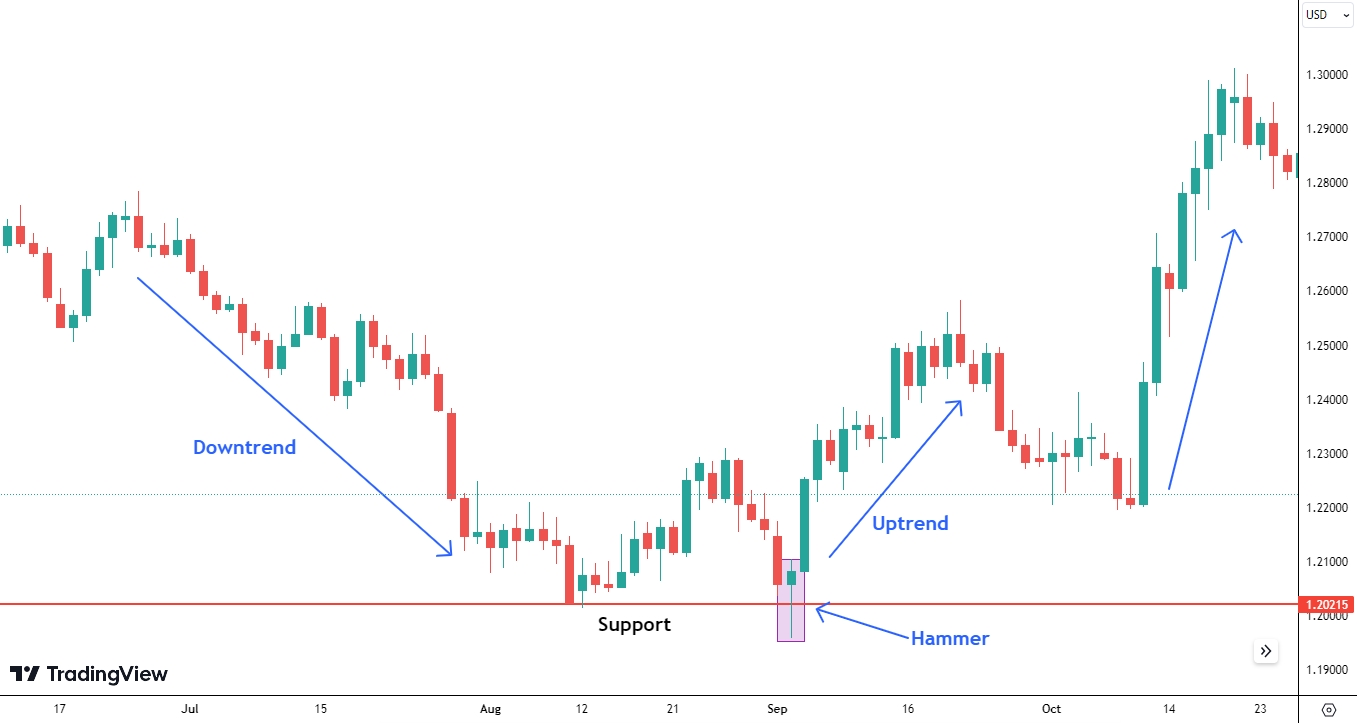
Hammer — bullish reversal pattern that appears after a downtrend and signals potential buying pressure.
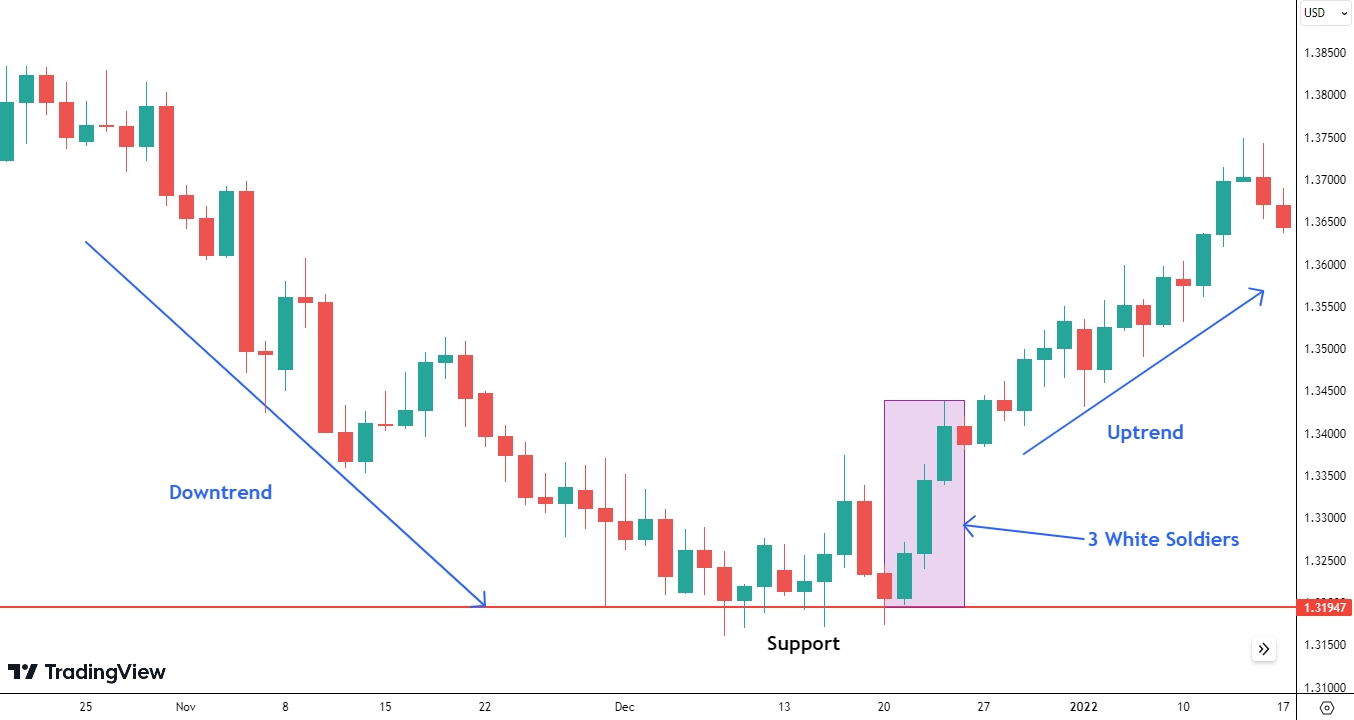
Three White Soldiers — three consecutive bullish candles indicating strong upward momentum.
Bullish Engulfing — a large bullish candle completely engulfs the previous bearish candle, suggesting a trend reversal.
Morning Star — three-candle bullish reversal pattern that often marks the end of a downtrend.
Piercing Line — bullish pattern where the second candle closes above the midpoint of the previous bearish candle.
Three Black Crows — three consecutive bearish candles signaling strong selling pressure.
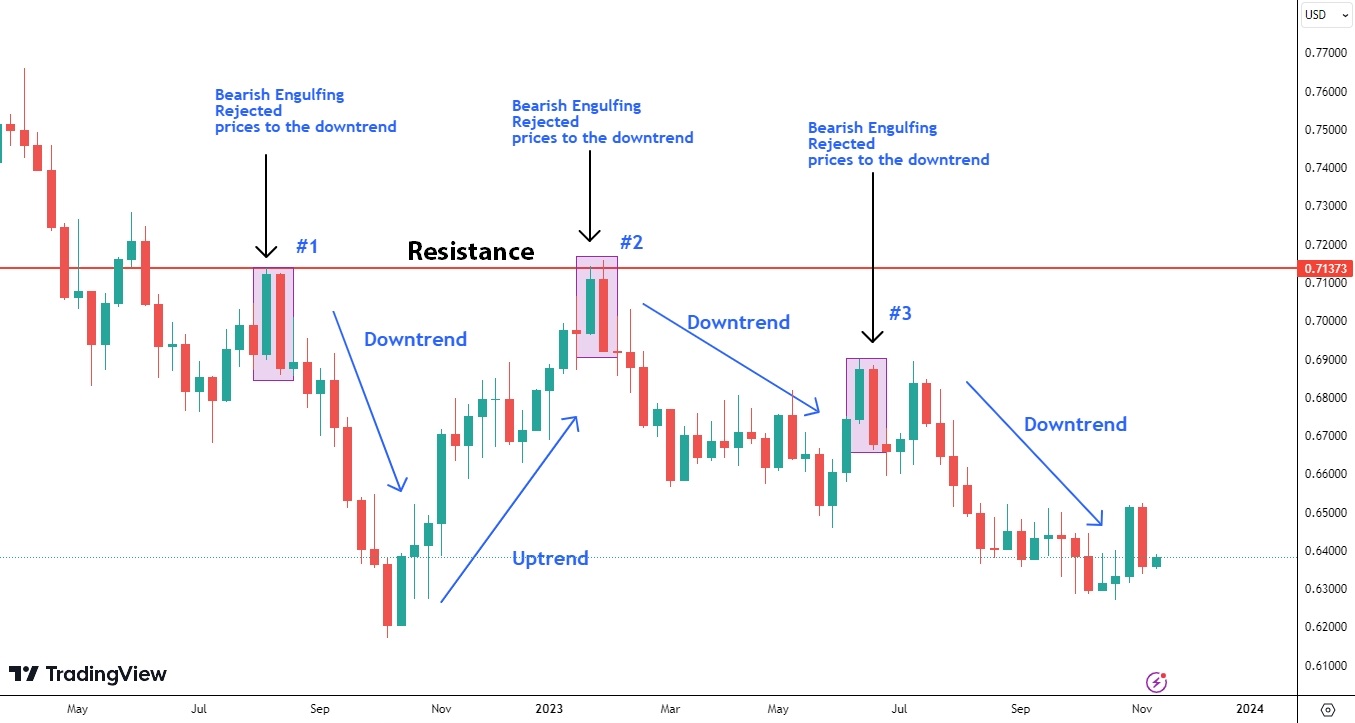
Bearish Engulfing — a large bearish candle engulfs the previous bullish candle, indicating a possible downtrend.
Evening Star — three-candle bearish reversal pattern that may signal the end of an uptrend.
Head and Shoulders — classic bearish reversal formation often preceding a trend change.
Doji — a candle with nearly identical open and close prices, reflecting market indecision and potential reversals.
Candlestick patterns are among the most popular tools in technical analysis, helping traders identify potential trend reversals, continuations, and shifts in market sentiment. By understanding these formations, traders can better time their entries and exits while gaining insight into the balance between buyers and sellers. In this guide, we cover 10 of the most important bullish and bearish candlestick patterns every trader should know.
Understanding a candlestick
A candlestick is an element of the chart containing key information about the price range over a period of time:
The price of the beginning of the trading period (Open).
Maximum price of the period (High).
Minimum price of the period (Low).
The price of the end of the trading period (Close).
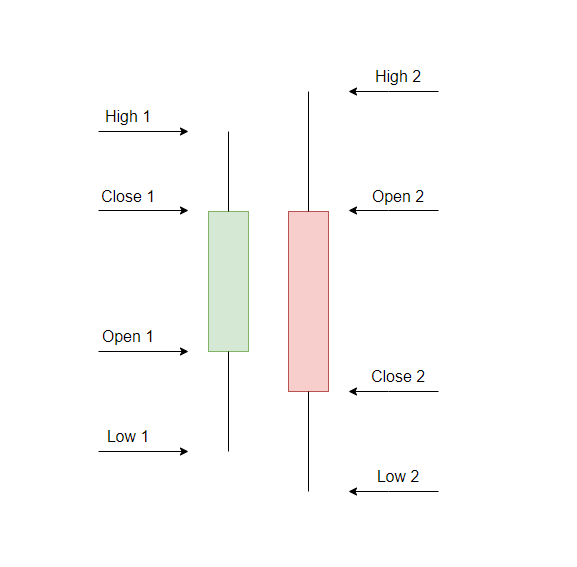
If the close price is higher than the open price, the candlestick is bullish or white (left side of the image above).
If the close price is lower than the open price, the candlestick is bearish or black (right side of the image above).
The price range between the Open and Close is called the “body” of the candlestick.
The thin lines between the body show the high and low prices and are called the “shadows”.
Best bullish candlestick patterns
Based on the opinion of various analysts and seasoned traders, our experts have shortlisted the following as the best bullish candlestick patterns:
Hammer
The Hammer candlestick pattern materializes when the low of a security significantly surpasses its opening price, but eventually rallies to close in close proximity to the opening price. The extended lower shadow of this pattern reveals that, initially, sellers managed to push the price down, however, buyers regained control and drove the price back up, hinting at a possible bullish reversal.
Three White Soldiers
Comprising three consecutive long green candles, each with a higher closing price than the preceding one and an opening within the body of the previous candle, the Three White Soldiers pattern signifies strong bullish momentum. It may indicate a potential trend reversal or the continuation of a pre-existing upward trend. Traders often interpret this pattern as a confirmation of a bullish market and might see it as an opportunity to initiate long positions or expand existing ones.
Bullish Engulfing
A Bullish Engulfing pattern appears when a small red candle is followed by a bigger green candle that completely covers the previous day's candle. This pattern implies that the buying pressure has surpassed the selling pressure, triggering a change in market sentiment that could result in an upward price movement.
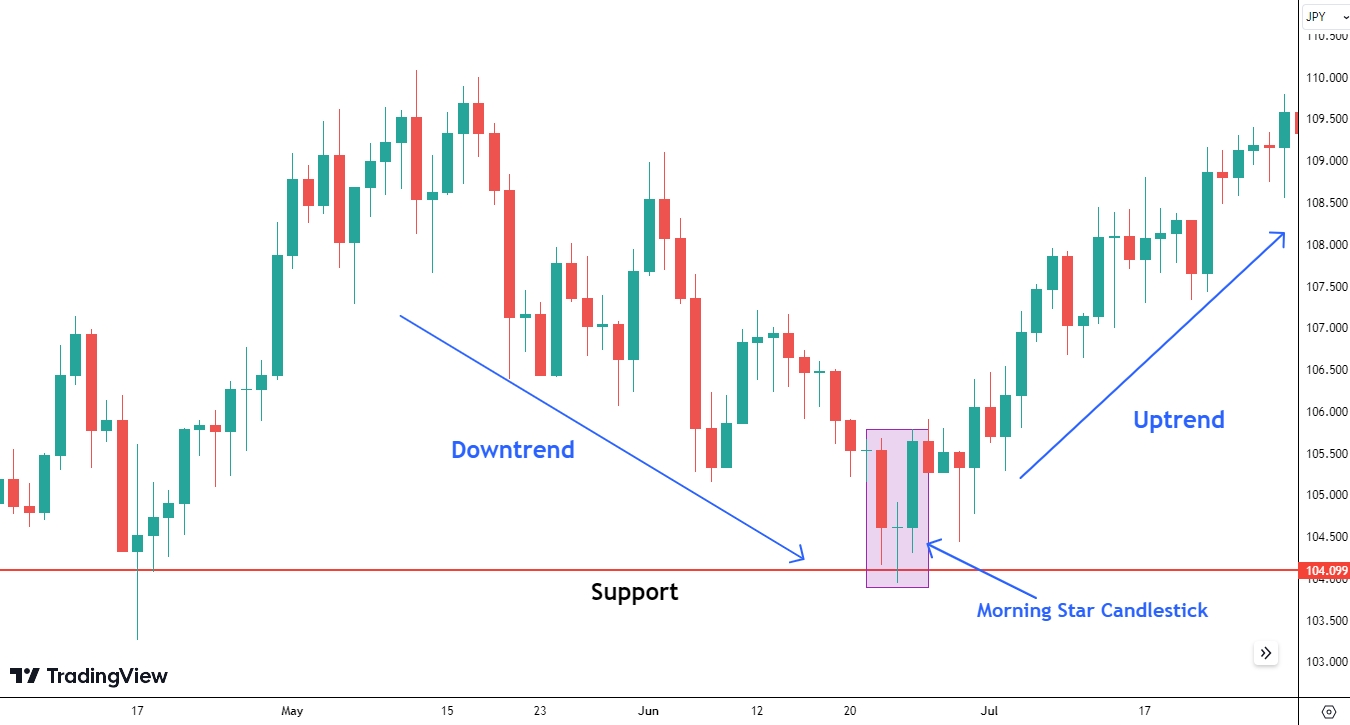
Morning Star
The Morning Star pattern is made up of three candlesticks: a lengthy red candle, a small-bodied candle (either red or green) that exhibits a lower gap, and a long green candle that closes within the first candle's range. This pattern signals a faltering downtrend, as the small-bodied candle reflects market indecision, succeeded by a robust green candle that suggests a bullish turnaround.
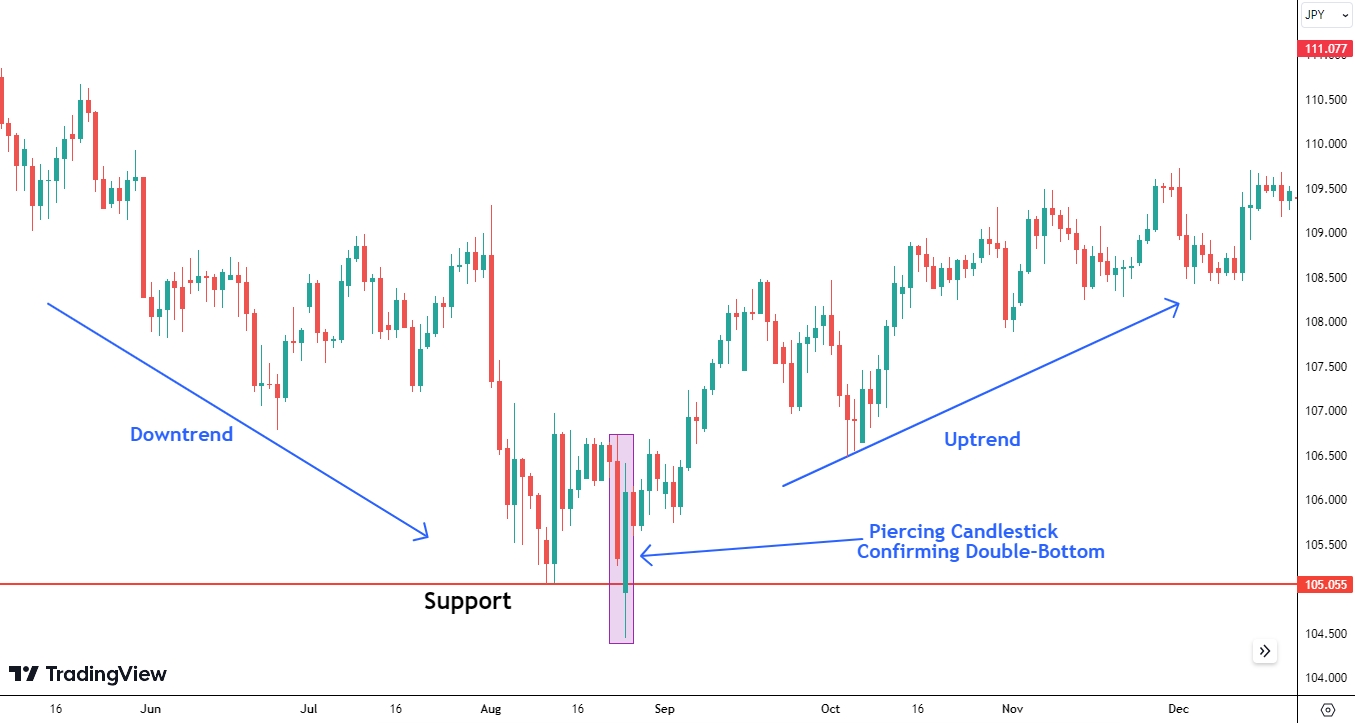
Piercing Line
A Piercing Line pattern consists of a two-candle formation, featuring a long red candle followed by a lengthy green candle that opens below the previous day's low but closes more than halfway above the midpoint of the initial candle. The strong close of the second candle indicates a shift in market sentiment and implies that bulls are taking control. While this pattern predominantly emerges in stocks due to their susceptibility to overnight gaps, it can manifest in any asset class on a weekly chart, even though it is less common in currencies or other 24-hour trading instruments.
Best bearish candlestick patterns
Based on the opinion of various analysts and seasoned traders, our experts have shortlisted the following as the best bearish candlestick patterns:
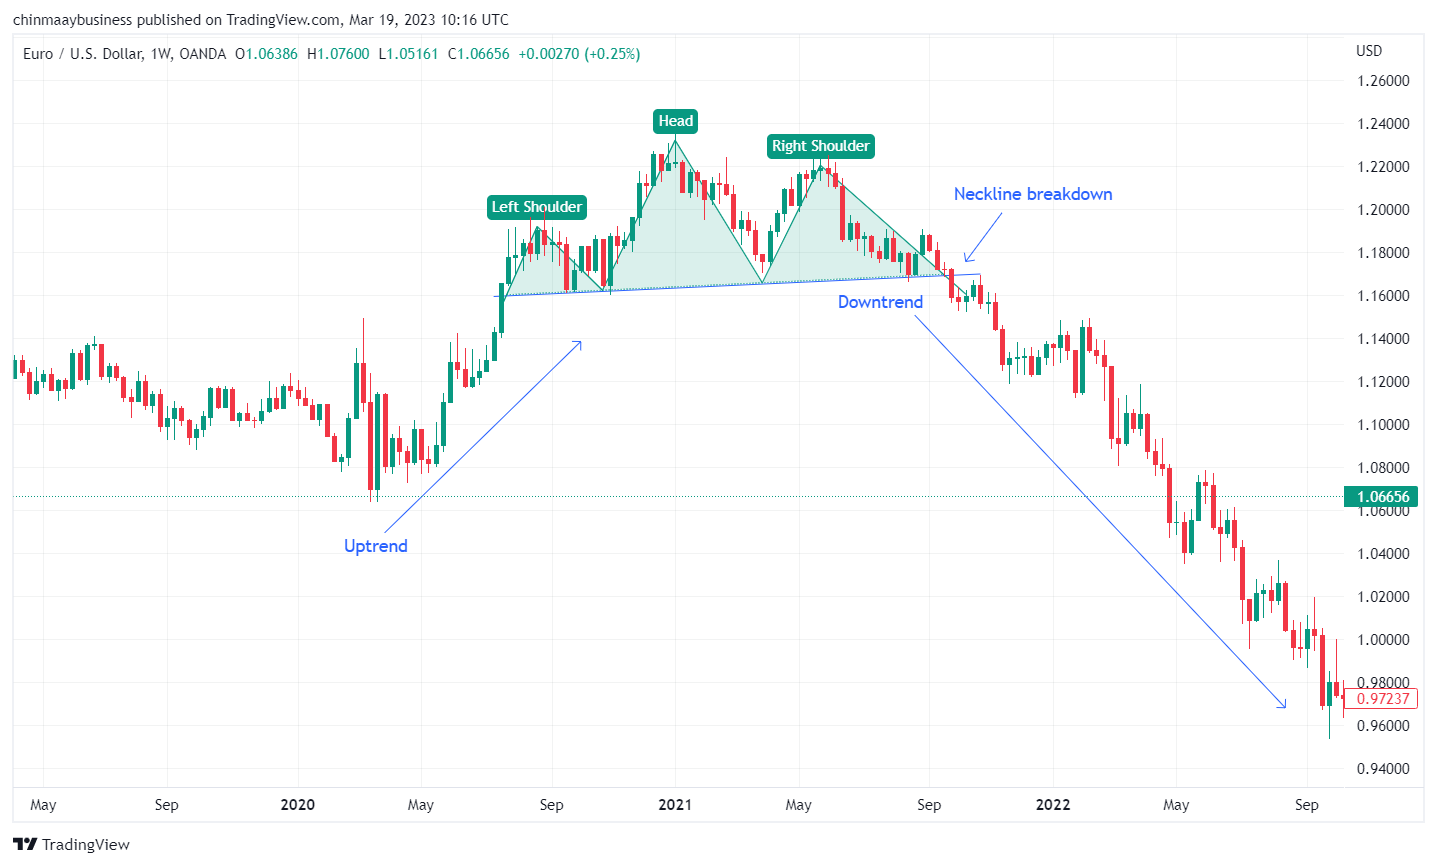
Head and Shoulders
The Head and Shoulders pattern is well-known for trading potential trend reversals. This pattern features three peaks, with the middle peak being the highest (the head) and the other two peaks being slightly lower (the shoulders). The primary indication of this pattern is that an uptrend is coming to an end, and that a downtrend may follow.
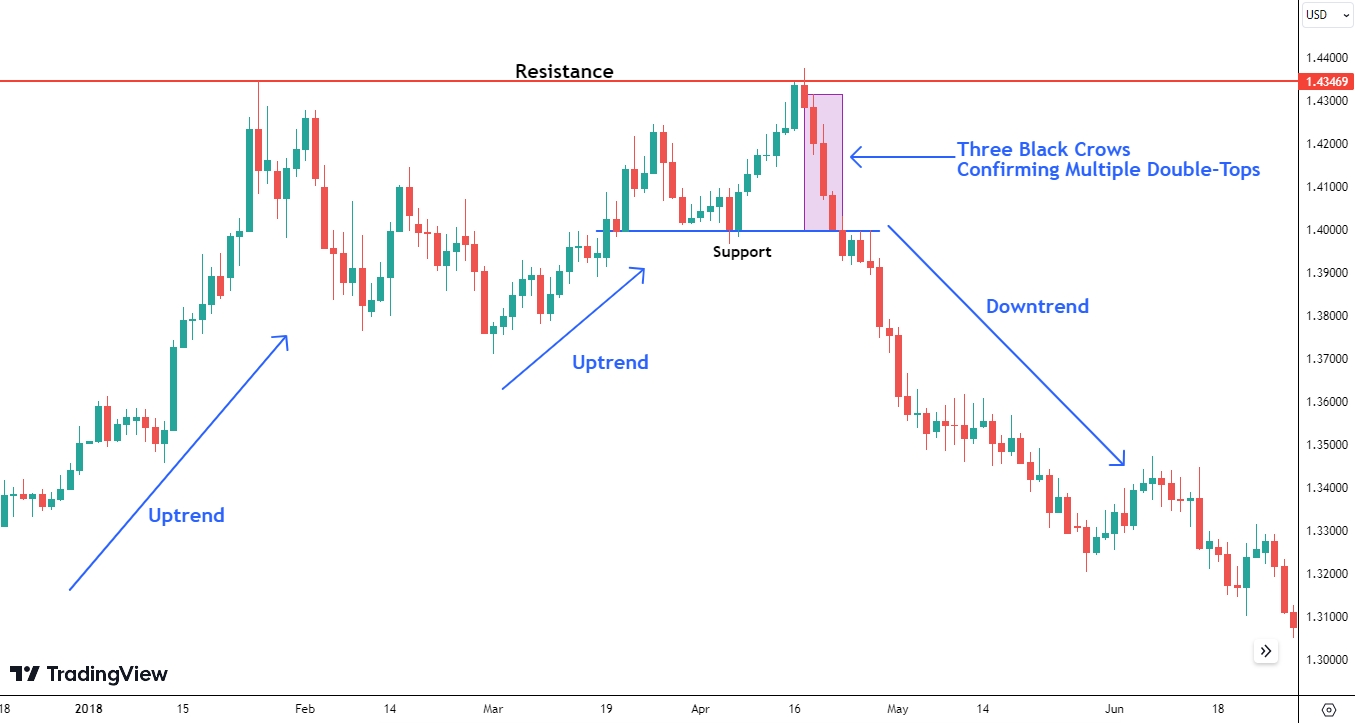
Three Black Crows
The Three Black Crows candlestick pattern is identified by three consecutive long red candles with lower closing prices than the previous candle, and each opening within the body of the prior candle. This pattern signifies strong bearish momentum and may signal a potential trend reversal or continuation of an existing downtrend.
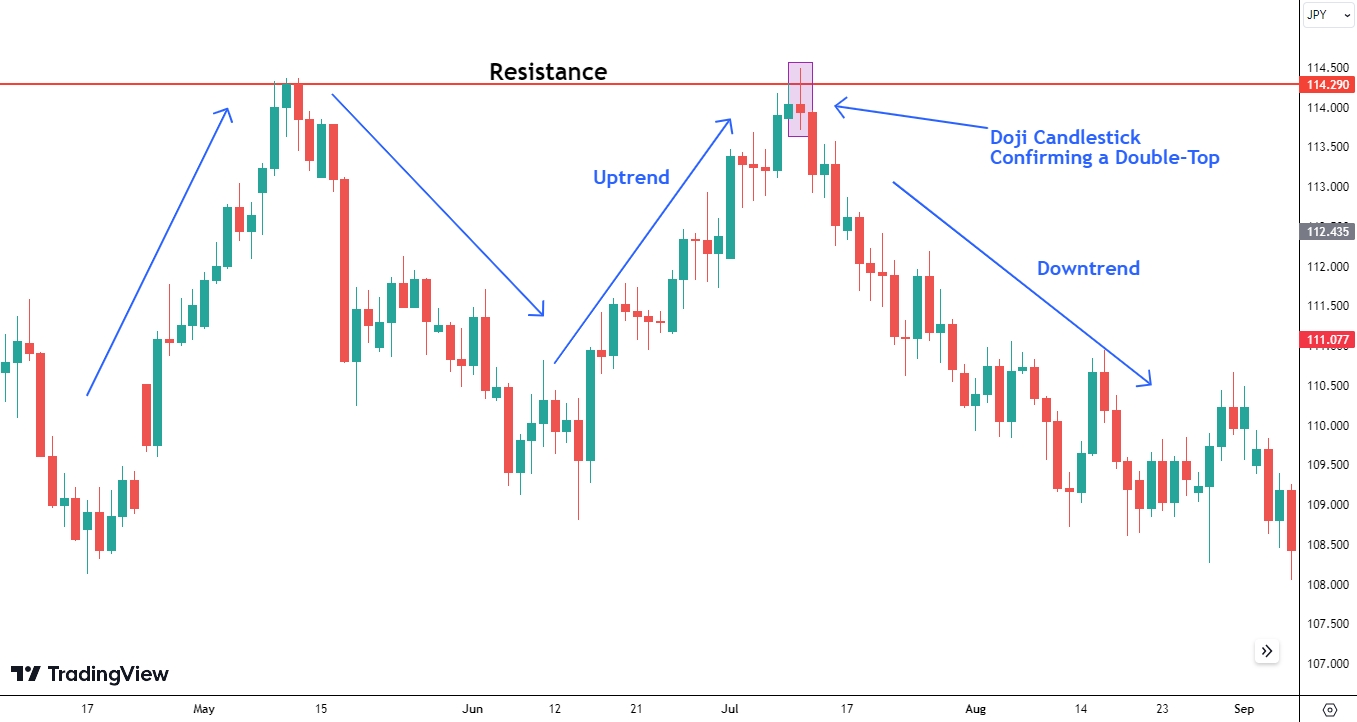
Doji
A Doji candlestick pattern is formed when a security's opening and closing prices are almost identical, resulting in a small or non-existent body and potentially long shadows. This pattern represents market indecision and may indicate a potential trend reversal or continuation, depending on the context of the preceding candles and overall market trend.
Bearish Engulfing
The Bearish Engulfing pattern appears when a small green candle is followed by a larger red candle that completely engulfs the previous day's candle. This pattern can indicate that selling pressure has intensified, and that the market sentiment has shifted towards bearishness, potentially leading to a downward price movement.
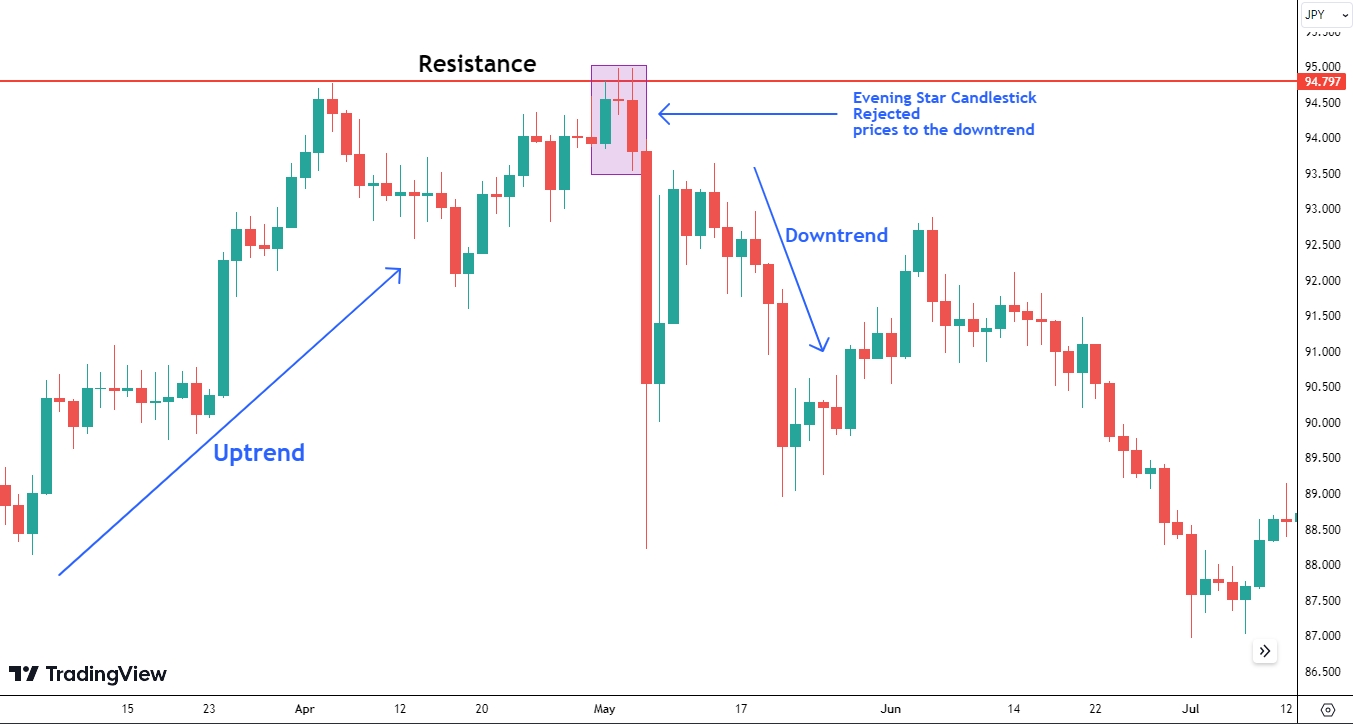
Evening Star
The Evening Star pattern consists of three candlesticks, with the first being a long green candle, followed by a small-bodied candle (either green or red) that displays a higher gap, and finally a lengthy red candle that closes within the range of the first candle. This pattern suggests a weakening uptrend, with the small-bodied candle indicating market indecision and the powerful red candle implying a bearish reversal.
How to trade candlestick patterns effectively?
Successful candlestick trading is based on several key principles. By mastering these principles, you can identify high-probability trades and improve your trading performance. Here are some essential factors to consider when trading candlestick patterns, as suggested by our experts:
Consider context and location: To effectively trade candlestick patterns, it's crucial to always compare the current candlestick to the most recent price action and analyze the bigger picture. Additionally, you should only trade candlesticks at important price levels.
Size matters: Candle size can reveal a lot about the strength, momentum, and trends in the market. When candles suddenly become larger, it often signals a stronger trend, while small candles after a long rally can suggest a potential reversal or the end of a trend.
Interpret wicks: The length of a candle's wick can also provide valuable insights into potential reversals. Long wicks at key support/resistance levels can indicate rejections and failed attempts to move the price higher or lower. However, do note that not all wicks are reversal signals.
Analyze body: The body of a candlestick represents the distance the price has traveled from the open to the close. Experts suggest that you should interpret the body in the context of the wicks and the size.
Consider support and resistance levels: Support and resistance levels can act as significant price barriers and often provide valuable insights into potential trading opportunities. By combining your analysis of candlestick patterns with your understanding of support and resistance levels, you can make more informed trading decisions and increase your chances of success.
Focus on risk management: While analyzing candlestick patterns is important, it's equally essential to focus on risk management. By setting appropriate stop-loss orders and managing your risk effectively, you can minimize potential losses and increase your chances of long-term success.
Pros and cons of using candlestick patterns
- Pros
- Cons
- Clear visual format — shows price action more clearly than traditional bar charts.
- Market psychology — helps traders understand buyer and seller behavior.
- Easy to read — patterns are simple to identify after basic practice.
- Works with indicators — can be combined with RSI, moving averages, support and resistance.
- Shows market sentiment — helps identify whether bulls or bears are in control.
- Useful for automation — patterns can be coded into algorithmic trading systems.
- False signals — patterns may appear in random price movements.
- Subjective interpretation — traders may read the same chart differently.
- Lagging signals — confirmation usually comes only after the candle closes.
- Data gaps — price gaps can distort pattern analysis.
- Analysis overload — too many patterns and indicators can create confusion.
Best Forex brokers
To effectively apply candlestick strategies in real market conditions, choosing a reliable broker is essential. The table below compares some of the best Forex brokers, helping you evaluate trading conditions, platforms, and key features to find a provider that suits your strategy and experience level.
| zForex | Plus500 | OANDA | Trading.com USA | FOREX.com | |
|---|---|---|---|---|---|
|
Min. deposit, $ |
10 | 100 | No | 50 | 100 |
|
Tradable assets |
80 | 2800 | 129 | 69 | 5500 |
|
Standard EUR/USD spread |
0.3 | 0.7 | 0.3 | 1.1 | 1.0 |
|
Max. leverage |
1:1000 | 1:300 | 1:200 | 1:50 | 1:50 |
|
Max. Regulation Level |
Not regulated | Tier-1 | Tier-1 | Tier-1 | Tier-1 |
|
TU overall score |
8.05 | 7.57 | 6.89 | 6.15 | 6.87 |
|
Open an account |
Go to broker Your capital is at risk.
|
Go to broker 80% of retail CFD accounts lose money. |
Go to broker Your capital is at risk. |
Go to broker Your capital is at risk. |
Study review |
Combine candlestick analysis with discipline and context

Candlestick patterns can be a powerful tool for understanding market sentiment, but they should never be used in isolation. While patterns like the Hammer or Engulfing formations can signal potential reversals, their reliability increases significantly when combined with support and resistance levels, trend analysis, and proper risk management.
Traders should also be cautious of overinterpreting patterns or seeing signals where none exist. The real edge comes from consistency, patience, and the ability to filter high-probability setups rather than reacting to every formation on the chart. Treat candlestick patterns as part of a broader strategy, not a standalone solution.
Conclusion
Mastering candlestick patterns is a crucial skill for Forex traders seeking to gain an edge in the markets, but their true power lies in how they are integrated with broader analysis and disciplined risk management. Patterns like the Hammer or Bearish Engulfing provide valuable clues about potential trend reversals and market sentiment, yet their signals are far more reliable when confirmed by key support and resistance levels or trend context. Relying solely on these formations without a holistic approach or proper money management can lead to false signals or unnecessary losses. Ultimately, successful traders treat candlestick patterns not as shortcuts, but as one of many strategic tools, combining them with patience, context, and a clear trading plan to consistently filter out high-probability opportunities. In trading, it is the disciplined synthesis of tools, not the pattern itself, that paves the way to sustainable success.
FAQs
What are the key differences between bullish and bearish candlestick patterns?
How can traders minimize false signals when using Forex candlestick patterns?
In which market conditions are candlestick patterns most reliable for Forex trading?
Can candlestick patterns be used in algorithmic trading strategies?
Editors' Top Picks and Insights

Is Bitcoin right for you? Five traits shared by many cryptocurrency holders

Chasing hits: Why investors are losing interest in Netflix

Tokenized stocks in the spotlight: How do they work and are they worth trading?

Do politicians make the best stock traders?

Crypto test drive: How automakers are exploring digital assets

Lindsey Graham death: U.S. senator’s crypto legacy
Related Articles
Team that worked on the article
Chinmay Soni is a financial analyst with more than 5 years of experience in working with stocks, Forex, derivatives, and other assets. As a founder of a boutique research firm and an active researcher, he covers various industries and fields, providing insights backed by statistical data.

Dr. BJ Johnson is a PhD in English Language and an editor with over 15 years of experience. He earned his degree in English Language in the U.S and the UK.
Algorithmic trading is an advanced method that relies on advanced coding and formulas based on a mathematical model. However, compared to traditional trading methods, the process differs by being automated.
Forex trading, short for foreign exchange trading, is the practice of buying and selling currencies in the global foreign exchange market with the aim of profiting from fluctuations in exchange rates. Traders speculate on whether one currency will rise or fall in value relative to another currency and make trading decisions accordingly. However, beware that trading carries risks, and you can lose your whole capital.
Bitcoin is a decentralized digital cryptocurrency that was created in 2009 by an anonymous individual or group using the pseudonym Satoshi Nakamoto. It operates on a technology called blockchain, which is a distributed ledger that records all transactions across a network of computers.
A long position in Forex, represents a positive outlook on the future value of a currency pair. When a trader assumes a long position, they are essentially placing a bet that the base currency in the pair will appreciate in value compared to the quote currency.
Uptrend is a market condition in which prices are generally rising. Uptrends can be identified by using moving averages, trendlines, and support and resistance levels.

-
 Afghanistan
-
 Albania
-
 Algeria
-
 Angola
-
 Argentina
-
 Armenia
-
 Australia
-
 Austria
-
 Azerbaijan
-
 Bahamas
-
 Bahrain
-
 Bangladesh
-
 Belarus
-
 Belgium
-
 Bolivia
-
 Botswana
-
 Brazil
-
 Brunei
-
 Bulgaria
-
 Cambodia
-
 Cameroon
-
 Canada
-
 Chile
Chile
-
 China
China
-
 Colombia
-
 Congo
Congo
-
 Costa Rica
-
 Cote d'Ivoire
-
 Croatia
-
 Cuba
Cuba
-
 Cyprus
-
 Czechia
-
 DR Congo
-
 Denmark
-
 Dominican Republic
-
 Ecuador
-
 Egypt
Egypt
-
 El Salvador
-
 Estonia
-
 Eswatini
-
 Ethiopia
-
 Finland
-
 France
-
 Georgia
-
 Germany
-
 Ghana
Ghana
-
 Greece
-
 Haiti
Haiti
-
 Hong Kong
-
 Hungary
-
 India
India
-
 Indonesia
-
 Iran, Islamic republic
-
 Iraq
Iraq
-
 Ireland
-
 Israel
-
 Italy
Italy
-
 Jamaica
-
 Japan
Japan
-
 Jordan
-
 Kazakhstan
-
 Kenya
Kenya
-
 Korea
Korea
-
 Kuwait
-
 Kyrgyzstan
-
 Laos
Laos
-
 Latvia
-
 Lebanon
-
 Lesotho
-
 Libya
Libya
-
 Lithuania
-
 Luxembourg
-
 Madagascar
-
 Malaysia
-
 Malta
Malta
-
 Mauritius
-
 Mexico
-
 Moldova
-
 Mongolia
-
 Montenegro
-
 Morocco
-
 Mozambique
-
 Myanmar
-
 Namibia
-
 Nepal
Nepal
-
 Netherlands
-
 New Zealand
-
 Nigeria
-
 North Macedonia
-
 Norway
-
 Oman
Oman
-
 Pakistan
-
 Palestine
-
 Panama
-
 Papua New Guinea
-
 Paraguay
-
 Peru
Peru
-
 Philippines
-
 Poland
-
 Portugal
-
 Puerto Rico
-
 Qatar
Qatar
-
 Reunion
-
 Romania
-
 Rwanda
-
 Saudi Arabia
-
 Serbia
-
 Singapore
-
 Slovakia
-
 Slovenia
-
 Somalia
-
 South Africa
-
 Spain
Spain
-
 Sri Lanka
-
 Sweden
-
 Switzerland
-
 Syria
Syria
-
 Taiwan
-
 Tajikistan
-
 Tanzania
-
 Thailand
-
 Trinidad and Tobago
-
 Tunisia
-
 Turkey
-
 UAE
UAE
-
 Uganda
-
 Ukraine
-
 United Kingdom
-
United States
-
 Uruguay
-
 Uzbekistan
-
 Venezuela
-
 Vietnam
-
 Yemen
Yemen
-
 Zambia
-
 Zimbabwe
- Forex
- Crypto
