Top 7 Strong Bullish Patterns


Editorial Note: While we adhere to strict Editorial Integrity, this post may contain references to products from our partners. Here's an explanation for How We Make Money. None of the data and information on this webpage constitutes investment advice according to our Disclaimer.
Top strong bullish patterns:
- Ascending triangle – features a flat resistance line and rising support, signaling a potential breakout upward.
- Bullish pennant – a brief consolidation after a strong upward move, often followed by another surge.
- Bullish flag – a downward-sloping channel that forms after a sharp rally, usually leading to trend continuation.
- Morning Star – a three-candle reversal pattern indicating a potential shift from bearish to bullish momentum.
- Three White Soldiers – three consecutive long green candles showing strong and sustained buying pressure.
- Bullish engulfing – a large green candle fully engulfs the prior red one, confirming a potential bullish reversal.
- Hammer – a single candle with a long lower wick and small body, suggesting rejection of lower prices and a bounce.
A candlestick pattern is a technical analysis tool that helps predict further price movement. There are three groups of patterns: bullish, bearish and reversal. The first two groups confirm trend movement during a period of consolidation, while reversal trends warn about a change in the direction of price movement. Pattern trading is considered to be one of the most effective trading strategies, as pattern formation is psychological in nature. Candlestick patterns are formed because of the same actions of the majority. Therefore, you can understand the next actions of the majority using these patterns.
In this review you will learn:
What bullish patterns are and when they are formed.
What bullish patterns are better and how to quickly find them on the chart.
Use cases of patterns in trading.
In this review, we analyze practical examples.
What are bullish patterns and how are they formed?
Bullish patterns are candlestick patterns indicating a start or continuation of an upward movement. They can form in several cases:
On a downward trend. A downward trend that ends with a bullish pattern indicates that the volumes of sellers declined, and the number of traders willing to sell an asset is smaller than the number of those who want to buy it. This is considered a reversal pattern that points to a start of an upward trend.
On an upward movement. There are corrections and consolidation zones on any trend. A bullish pattern indicates that the buyers are still interested and that the pause or correction is temporary. For example, a bullish pattern with the breakout of the resistance level is a signal of renewal of an upward movement.
In a flat. It is not clear which way the price will go, when an asset is in a flat. A breakout of support and resistance levels may be false. However, if a bullish pattern forms at the time of breakout, there is a probability of a start of an upward movement.
The fact of pattern formation depends on the following: the size of the candlestick body and its relationship with previous candles, the size of the shadow and its relationship with the size of the body of the candle, the shape of the candle pattern itself.
Top 7 Best Bullish Candlestick Patterns
Below, we have selected the best bullish candlestick patterns. It is relatively easy to see them and the majority of them have a clear signal interpretation.
Ascending triangle
Ascending triangle pattern is one of the strongest patterns confirming an upward movement. Its signs include:
It is formed at the time of abnormal volatility indicating that a chaotic price movement is shifting into a trend.
Signs of formation: the upper line is close to horizontal; it runs along the swing highs and serves as a resistance level. The lower line runs along the swing lows and serves as a support level. The price moves inside the triangle.
Trend continuation signal – appearance of a long candlestick or series of standard candlesticks that break out the resistance level (the top line of the triangle) upwards.
The pattern forms rather rarely and does not always have clear edges. When the price moves inside the triangle, insignificant moving out of the candlesticks is allowed.
Example
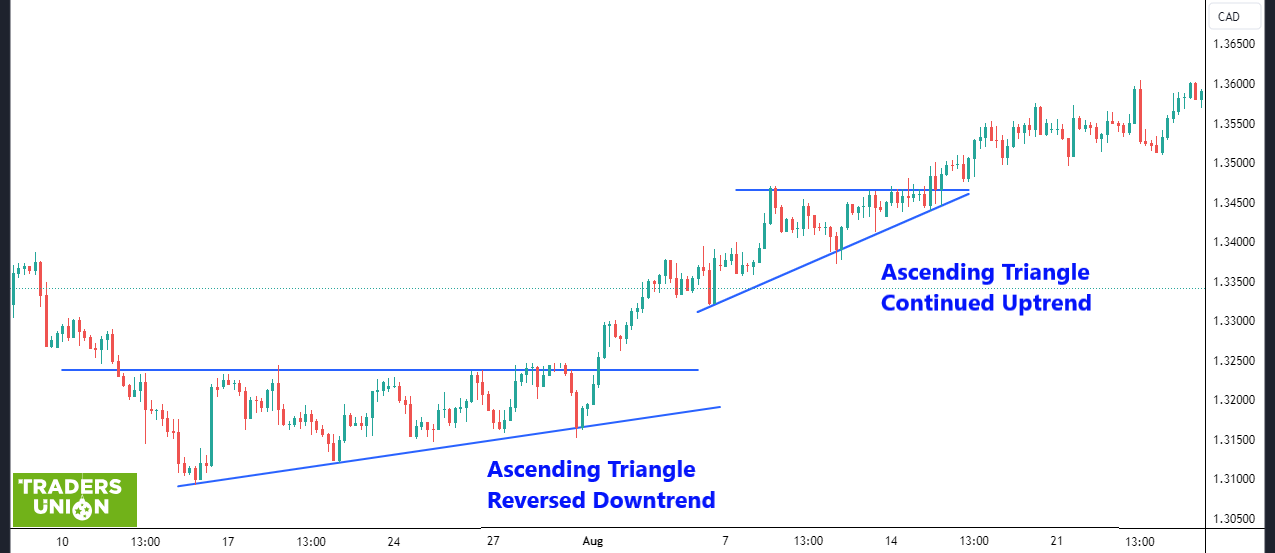 Ascending Triangle
Note that both triangles start with abnormally long downward candlesticks, followed by an upward oscillatory movement with gradual decrease in the candlestick body. Then, at some point, there is a breakout: several upward candlesticks with increasing bodies in a row. The red arrows indicate the candlesticks suitable for opening trades.
Bullish pennant
The pattern is similar to the triangle in terms of how it is formed. Its signs include:
It is formed on an upward trend. Its elements include the flagpole and the pennant. The flagpole is a ‘handle’, which represents several consecutive growing candles. The pennant is a triangle, but unlike the previous pattern, the resistance level is not necessarily horizontal.
The pattern indicates temporary consolidation. The price that is moving upwards temporarily moves sideways. At that, the highs of the sideways channel form resistance, and the lows – support. An additional strong sign is when the bodies of candles that form a sideways trend are gradually decreasing.
Trend continuation signal: breakout of the resistance level.
Consolidation may be followed also by a breakout of the support level downwards. In this case, the pattern is not bullish. However, any breakout of the triangle upwards or downwards is a signal for opening a position.
Example
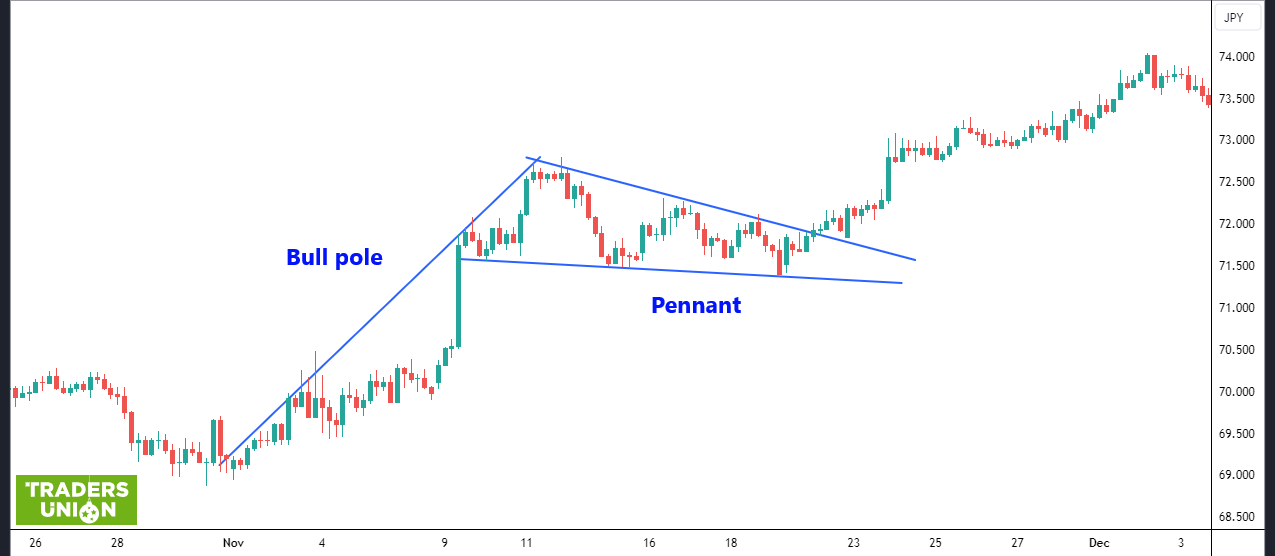 Pennant
Note that in this pattern, it is important that the triangle is pointed downwards and its base is ‘pressed’ to the flagpole. For example, below is an example of incorrect formation of the flag: the triangle is not ‘pressed’ for the base, the number of candlesticks is low and without clear highs.
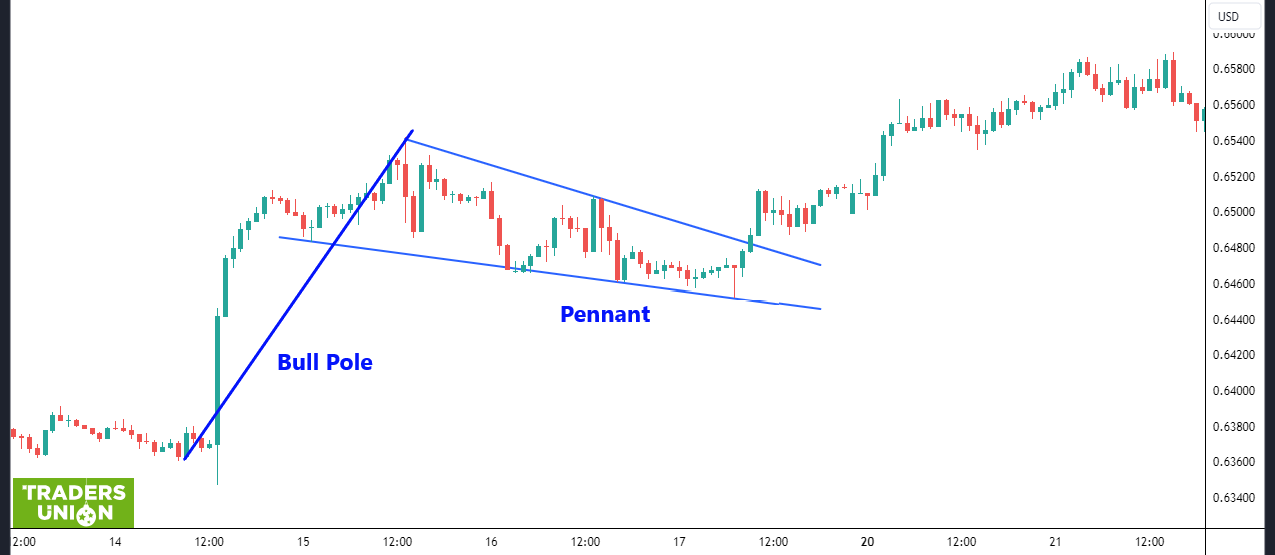 Example of unsuccessful Pennant pattern
Bullish flag
It is a pattern similar to the Pennant, only instead of a triangle, a rectangle is formed. It also has to tilt down.
Example
 Flag
FlagPatterns rarely form ideally in the real market, and therefore they don’t always provide effective signals. It is also almost impossible to build clear triangles or draw parallel lines of channels. On the chart above, we can see two patterns that are relatively similar to the Flag. The first one is stronger, as its top line turned from resistance into support. The price brough out of it, returned and bounced, marking continuation of an upward trend.
Morning Star
This is a bullish pattern that is also a reversal one. Its signs:
It is formed at the end of a downward trend.
It is a three-candle pattern. The first candle can be both bullish and bearish. The second candle is the same, but with a small body. A Doji candle with a big downward shadow indicates a strong signal. It shows that the sellers tried to push the price downwards, but by the end of the interval, the price returned to its initial level. The third candle is bullish.
The appearance of the next growing candle after the pattern is a signal for opening a position.
Example
 Morning Star
Signals 1, 2, 3 and 6 are weak, with the pattern not fully formed. Both side candles must be much bigger than the central candle. In terms of this principle, pattern 4 is formed correctly and pattern 5 – relatively correctly. The long shadow of the central candle downwards strengthens the signal.
Three White Soldiers
This pattern is called White Soldiers for the white color of upward candles that the majority of platforms set as default. This is a reversal pattern that indicates the end of a downward trend or appearance of an upward trend after the flat. The pattern consists of three consecutive upward candles. Additional strengthening signals include:
The body of each subsequent candle is longer than that of the previous one. This shows that the buyer’s power is growing.
Bullish candles practically don’t have shadows.
There is a combination of patterns on the chart: triple rising candles are preceded by a pin bar, Doji or Morning Star.
Example
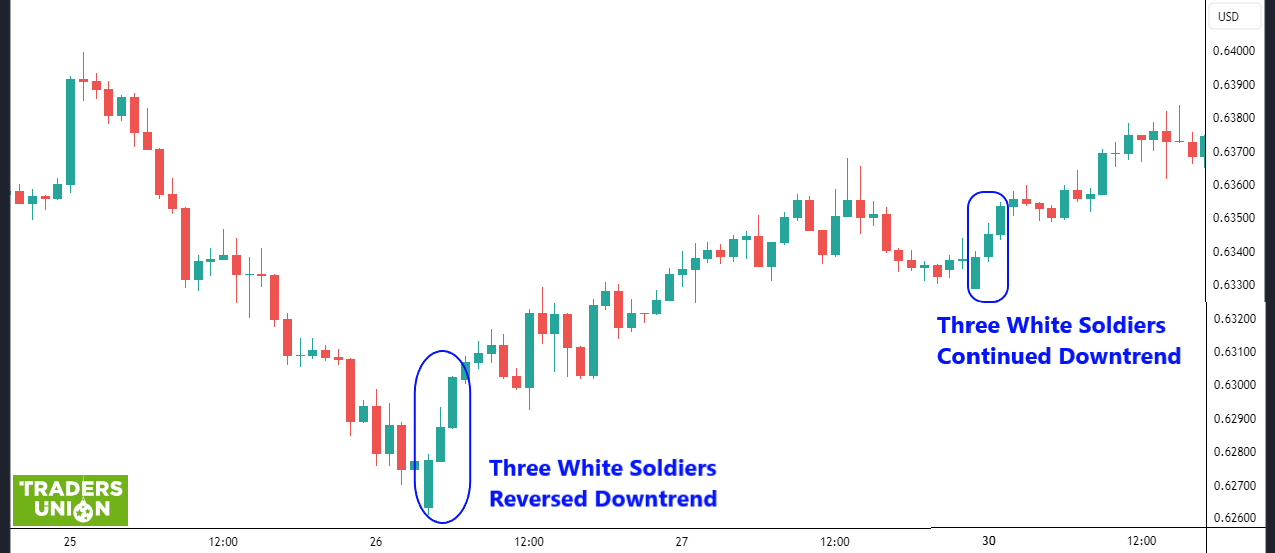 Three White Soldiers
In the first case, the pattern is weak due to abnormally different sizes of candle bodies. Then, the price moves sideways and three ideal “Soldiers” form (on MT4, the bullish candles are transparent by default): the second candle is longer than the first one and the third one is longer than the second; the candles practically don’t have shadows.
Bullish engulfing
Bullish engulfing is a reversal pattern. It is based on the idea of a bearish trend fading. The lower the price, the fewer people willing to sell an asset; therefore, the bearish candles become smaller and smaller. However, the number of buyers interested in the low price of an asset increases. Appearance of a bullish candle, the body of which completely overlaps or engulfs the body of the previous bearish candlestick, is the turning point.
Example
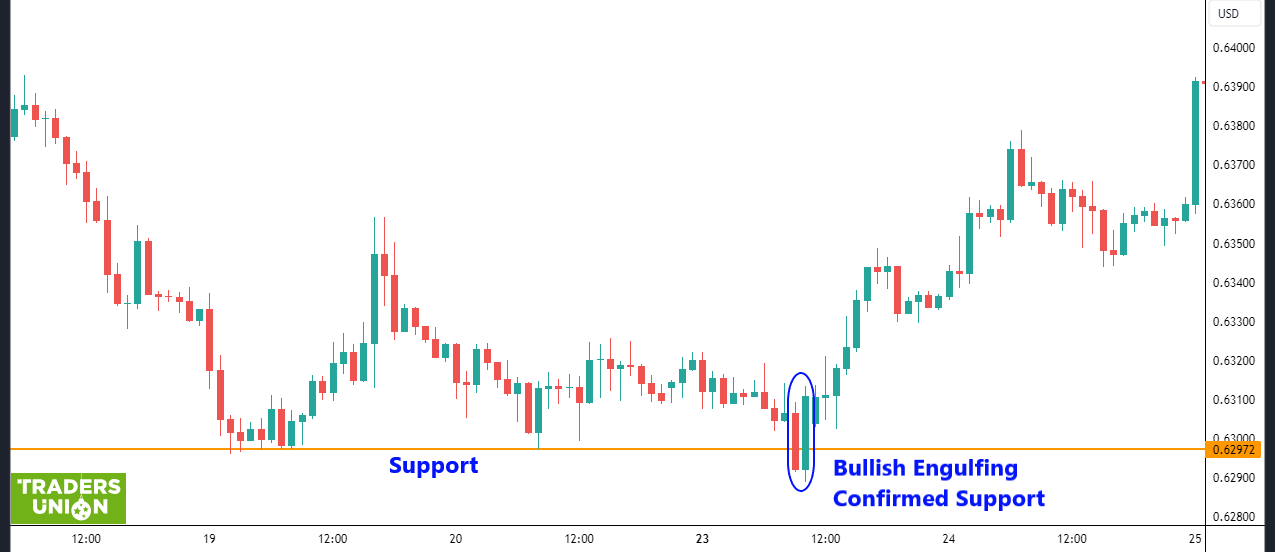 Bullish engulfing
In the first case, the bodies of bearish candles are becoming visibly smaller on the downward movement, after which a long upward candle appears. In the first case, the bearish candles do not become much smaller, but the pattern also gives a good signal of an upward trend.
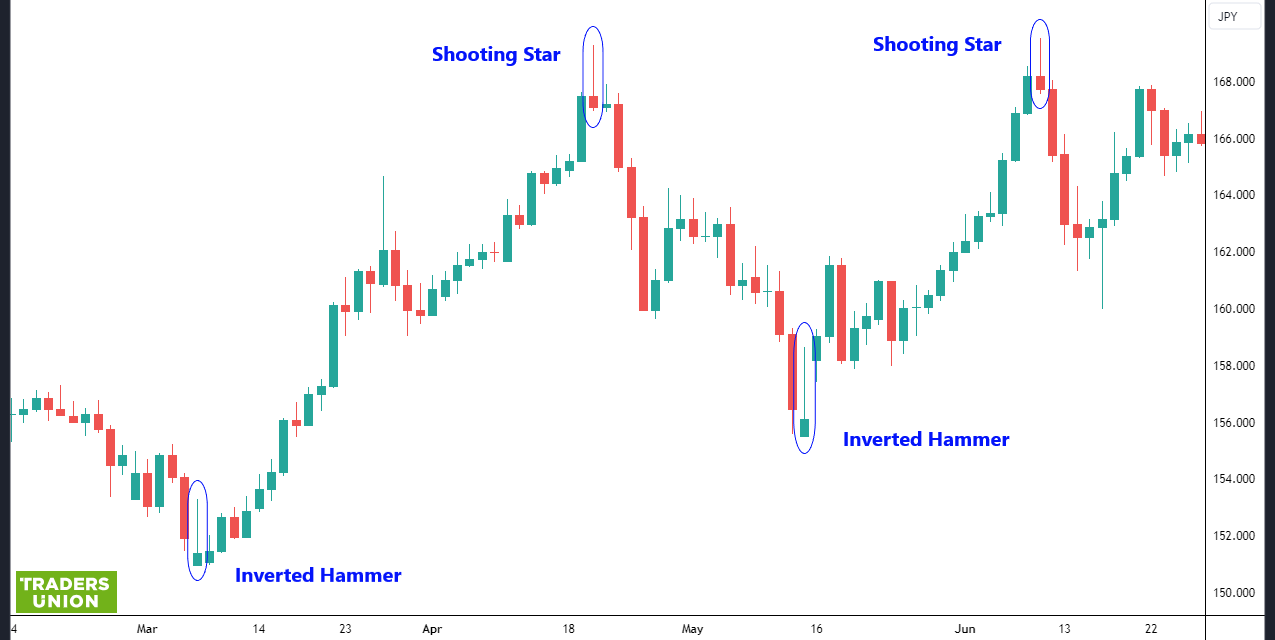
Hammer
Hammer is a candlestick pattern that practically fully repeats the idea of a pin bar. It is a reversal bullish pattern with a hammer-shaped candle with a long downward shadow on a bearish trend as a key element. The shadow must be at least twice bigger than the candle’s body. Strengthening signals:
The candle’s body is small. This means that the price was moving down under the pressure of sales volumes, but the buyers’ bids were enough to balance the supply.
Growth of volumes, indicating a market revival and showing that price reversal upwards is justified.
Upward signal candle. This means that the buyers not only satisfied the supply, but also created additional demand by raising the price.
Additional signal: an upward candle appears after the signal candle and the Hammer pattern gradually turns into the Three White Soldiers.
Example
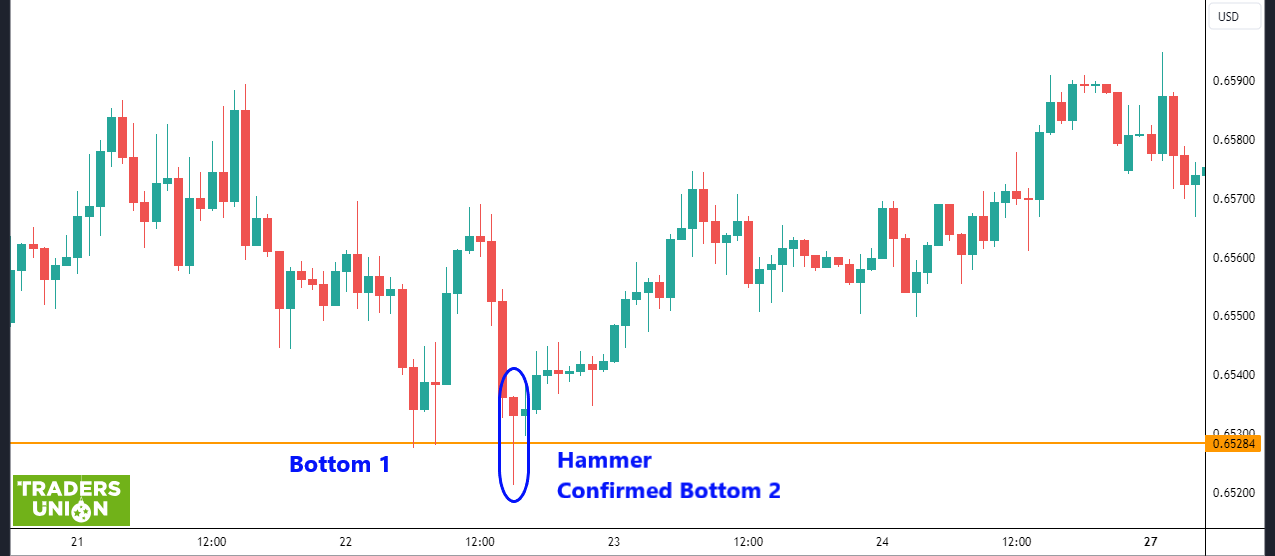
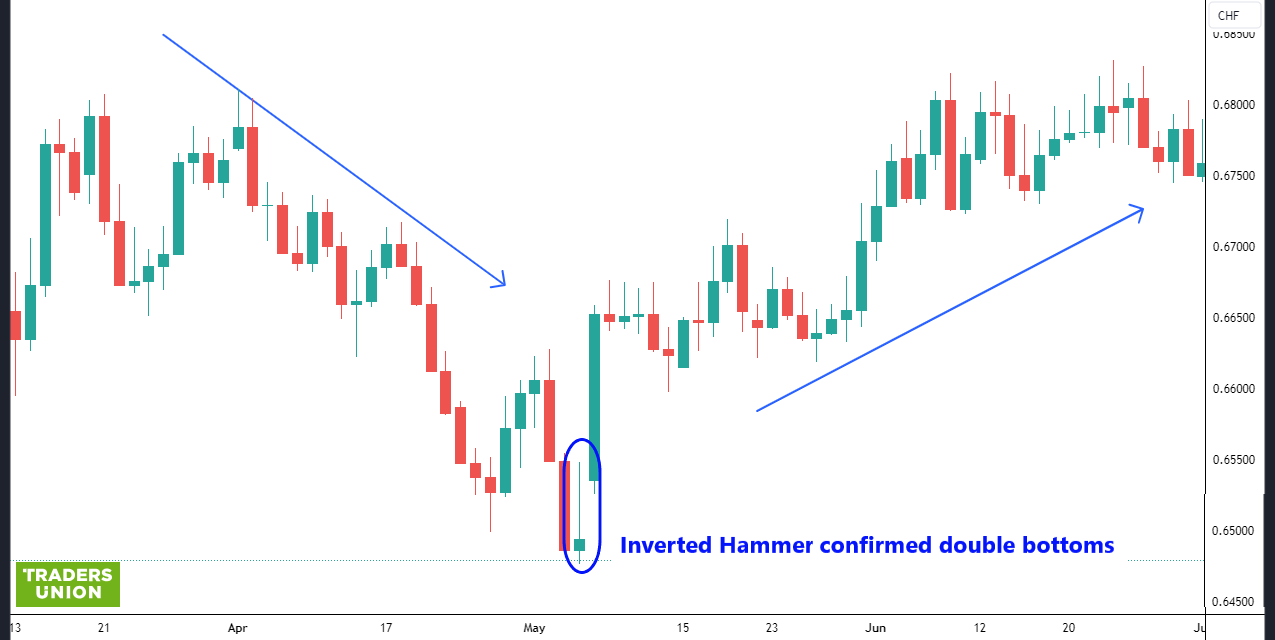 Hammer
The pattern forms only on trending markets. The chart shows a strong downward movement that is broken by a pin bar indicating that the buyers are ready to seize the initiative. After the pin bar, which in this case is a Hammer, three consecutive upward candles with growing bodies appear – the Three White Soldiers pattern.
Tips for using patterns
Pattern trading is also called Price Action. There are strategies built exclusively on candlestick patterns and chart analysis without the use of technical indicators, for example Sniper scalping strategy. However, these strategies are considered professional. If you are a novice trader, here are some tips for you:
Use candlestick patterns as a confirming instrument. Formation of a bullish pattern at the time when the price breaks the resistance level or a trend line is a strong signal.
Do not rush to open a position. A pattern must not only be fully formed, but also confirmed by the next candle.
Be careful when analyzing patterns during news releases. On the one hand, a fundamental factor pushes the majority towards one and the same action, which is why the candlestick patterns form quickly, clearly and will have a logical confirmation. On the other hand, volatility increases during these moments, and pattern formation may turn out to be false.
You need to learn to see the formation of patterns visually. It comes with experience, which is best gained on a demo account.
Best Brokers 2026


Conclusion
Candlestick patterns form under the influence of the psychology of the majority and in most cases predetermine further price movement.
Bullish patterns consist of one or several candles that confirm upward trend movement. They can be reversal patterns, forming on a downward movement. Or they can be trend patterns, forming on the consolidation of upward movement at the exit from the flat.
Bullish patterns that are easily found on the chart and have clear interpretation include the Morning Star, Hammer and Bullish Engulfing. The patterns that are more complicated due to different interpretation approaches include Hammer, Pennant and Flag.
Many patterns have similarities. For example, on a downward trend, decrease of the body of downward candles and appearance of Doji candle or a pin bar followed by a bullish candle is a common sign. Therefore, do not stick to the names of the patterns too much. Learn to quickly identify their formation and search for confirming signals.
FAQs
How do bullish patterns work?
Bullish patterns are candlestick patterns indicating the growing power of buyers after correction, flat or downward movement. They are preceded by uncertain chaotic movement or downward movement with the decreasing body of candles. Appearance of a bullish pattern with the breakout of the resistance level or a trend line is a strong signal for opening a position.
How effective are bullish patterns in trading strategies?
This is one of the most effective instruments of chart analysis in trend strategies. Patterns are formed on the basis of the “crowd psychology”, when the conduct of the said crowd in certain situations is predictable. Bullish patterns warn traders about upward movement after a flat or bearish trend. They can also be used to evaluate the power of the buyers.
What combines the best with patterns?
It’s all individuals. In chart analysis, patterns are combined with support and resistance levels and trend lines. They confirm the signals of trend indicators and, to an extent, can be very effective at the time of fundamental volatility, confirming the market sentiment.
Is Price Action strategy suitable for beginners?
Yes, pattern trading can be recommended to novice traders under the conditions that the strategies are applied to the timeframe from H1. Formation of patterns on short-term intervals is not recommended due to the local influence of market makers and price noise.
Editors' Top Picks and Insights

Hunting crypto owners: Why criminals have gone offline

BitMEX is shutting down: Why Trump could not save the exchange

Do governments need crypto workers?

Brent nears $100: Why oil prices are rising

Gram Wallet launch: Can Telegram bring crypto to the masses?

AI without limits: How dangerous are neural networks?
Related Articles
Team that worked on the article
Andrey Mastykin is an experienced author, editor, and content strategist who has been with Traders Union since 2020. As an editor, he is meticulous about fact-checking and ensuring the accuracy of all information published on the Traders Union platform.
Chinmay Soni is a financial analyst with more than 5 years of experience in working with stocks, Forex, derivatives, and other assets. As a founder of a boutique research firm and an active researcher, he covers various industries and fields, providing insights backed by statistical data.
Mirjan Hipolito is a journalist and news editor at Traders Union. She is an expert crypto writer with five years of experience in the financial markets.
Cryptocurrency is a type of digital or virtual currency that relies on cryptography for security. Unlike traditional currencies issued by governments (fiat currencies), cryptocurrencies operate on decentralized networks, typically based on blockchain technology.
Volatility refers to the degree of variation or fluctuation in the price or value of a financial asset, such as stocks, bonds, or cryptocurrencies, over a period of time. Higher volatility indicates that an asset's price is experiencing more significant and rapid price swings, while lower volatility suggests relatively stable and gradual price movements.
Forex indicators are tools used by traders to analyze market data, often based on technical and/or fundamental factors, to make informed trading decisions.
Price action trading is a trading strategy that relies primarily on the analysis of historical price movements and patterns in financial markets, such as stocks, currencies, or commodities. Traders who use this approach focus on studying price charts, candlestick patterns, support and resistance levels, and other price-related data to make trading decisions.
Day trading involves buying and selling financial assets within the same trading day, with the goal of profiting from short-term price fluctuations, and positions are typically not held overnight.

-
 Afghanistan
-
 Albania
-
 Algeria
-
 Angola
-
 Argentina
-
 Armenia
-
 Australia
-
 Austria
-
 Azerbaijan
-
 Bahamas
-
 Bahrain
-
 Bangladesh
-
 Belarus
-
 Belgium
-
 Bolivia
-
 Botswana
-
 Brazil
-
 Brunei
-
 Bulgaria
-
 Cambodia
-
 Cameroon
-
 Canada
-
 Chile
Chile
-
 China
China
-
 Colombia
-
 Congo
Congo
-
 Costa Rica
-
 Cote d'Ivoire
-
 Croatia
-
 Cuba
Cuba
-
 Cyprus
-
 Czechia
-
 DR Congo
-
 Denmark
-
 Dominican Republic
-
 Ecuador
-
 Egypt
Egypt
-
 El Salvador
-
 Estonia
-
 Eswatini
-
 Ethiopia
-
 Finland
-
 France
-
 Georgia
-
 Germany
-
 Ghana
Ghana
-
 Greece
-
 Haiti
Haiti
-
 Hong Kong
-
 Hungary
-
 India
India
-
 Indonesia
-
 Iran, Islamic republic
-
 Iraq
Iraq
-
 Ireland
-
 Israel
-
 Italy
Italy
-
 Jamaica
-
 Japan
Japan
-
 Jordan
-
 Kazakhstan
-
 Kenya
Kenya
-
 Korea
Korea
-
 Kuwait
-
 Kyrgyzstan
-
 Laos
Laos
-
 Latvia
-
 Lebanon
-
 Lesotho
-
 Libya
Libya
-
 Lithuania
-
 Luxembourg
-
 Madagascar
-
 Malaysia
-
 Malta
Malta
-
 Mauritius
-
 Mexico
-
 Moldova
-
 Mongolia
-
 Montenegro
-
 Morocco
-
 Mozambique
-
 Myanmar
-
 Namibia
-
 Nepal
Nepal
-
 Netherlands
-
 New Zealand
-
 Nigeria
-
 North Macedonia
-
 Norway
-
 Oman
Oman
-
 Pakistan
-
 Palestine
-
 Panama
-
 Papua New Guinea
-
 Paraguay
-
 Peru
Peru
-
 Philippines
-
 Poland
-
 Portugal
-
 Puerto Rico
-
 Qatar
Qatar
-
 Reunion
-
 Romania
-
 Rwanda
-
 Saudi Arabia
-
 Serbia
-
 Singapore
-
 Slovakia
-
 Slovenia
-
 Somalia
-
 South Africa
-
 Spain
Spain
-
 Sri Lanka
-
 Sweden
-
 Switzerland
-
 Syria
Syria
-
 Taiwan
-
 Tajikistan
-
 Tanzania
-
 Thailand
-
 Trinidad and Tobago
-
 Tunisia
-
 Turkey
-
 UAE
UAE
-
 Uganda
-
 Ukraine
-
 United Kingdom
-
United States
-
 Uruguay
-
 Uzbekistan
-
 Venezuela
-
 Vietnam
-
 Yemen
Yemen
-
 Zambia
-
 Zimbabwe
- Forex
- Crypto
