Bull Flag Pattern Review
If you’re interested in technical analysis trading strategies to identify low-risk market entry prices, then you probably know about the bull flag pattern.
This pattern lets traders know about the bullish consistency of an existing uptrend of higher prices. While its opposite, the bearish flag pattern shows a consistent downtrend in prices.
By identifying these patterns, traders can derive good day and swing trading strategies. But, how can you determine the bull flag pattern to devise your plan accordingly?
In this discourse, we will walk you through all the details regarding a bull flag pattern. Read along to know how to identify, trade, and differentiate between bullish and bearish flag patterns. Let’s dive in.
Start trading Forex right now with eToro!Bull Flag Pattern Review
For those who are new to the concept, working with flag patterns can seem like a magnanimous task in itself. However, if you know the trick to identifying flag patterns, you can figure out trading techniques quite quickly and generate ample revenue.
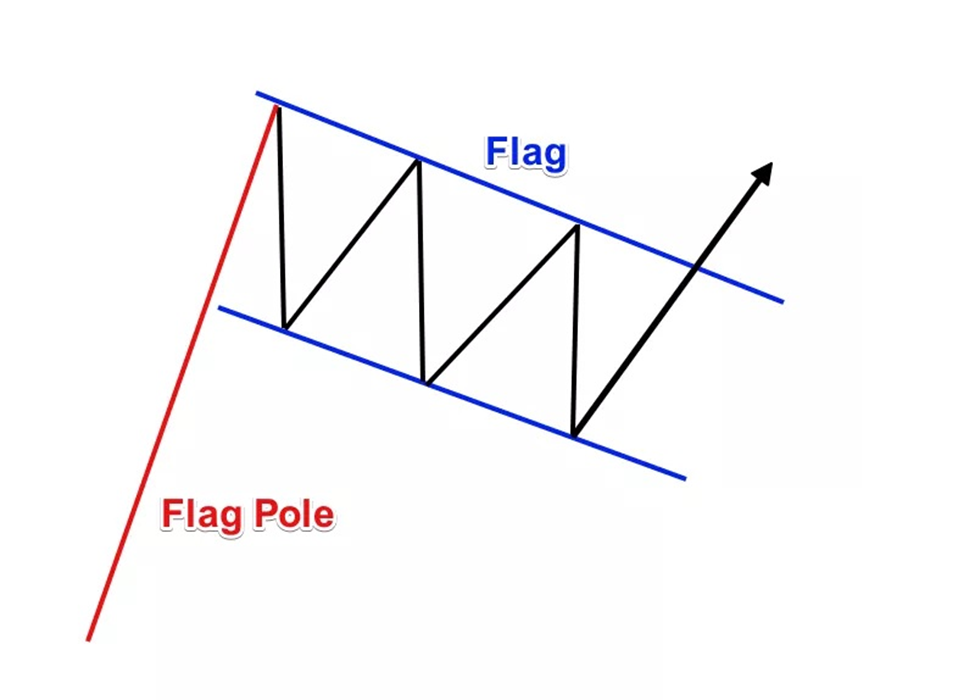
For that, you’ll have to know what a flag pattern is and how it received its name. Mainly, bullish and bearish flag patterns received their names from their appearance.
As the current price trend continuing for a short period moves in the opposite direction, it ends up looking just like a flag extending from a flagpole. The flagpole represents a rise or decline in the price, while the flag represents a period of consolidation.
Thus, the flagpole, the flag, and the continuation are the three main components of identifying bullish and bearish flag patterns.
While the components remain the same, a bull flag pattern and a bear flag pattern represent opposite market trends. Meaning, according to technical analysis, traders should buy and spot losses differently in both situations.
So, if a trader makes a mistake while identifying a bull flag pattern correctly, it can lead to substantial losses. That’s where this detailed review comes in. This article will clearly explain both flag patterns and how to identify them and trade correctly.
What is a Bull Flag Pattern?
Bull Flag pattern
For traders, flag patterns are excellent indicators of continuation in the market that benefit from existing trends. While trading according to patterns is not always reliable and often brings adverse results, it does work when you have a correct identification method and entry-exit strategy.
That’s why it is essential to understand the connotation of each pattern to navigate them successfully to generate revenue.
A bull flag pattern represents a strong bullish trend, a flagpole, that later stabilizes to form a flag. As the bullish trending rises almost vertically, it is a sign for traders to get ready for a long position.
However, unlike other minor fluctuations in the market, during a flag pattern, the market shoots up. If the move is not strong enough, you will soon see a retrace in the graph. But, an accumulation in the upward trend means that buyers are holding out any selling of the asset, making it a bullish scenario.
As more buyers jump into the market, situations become tense for short-sellers. The sudden rise in prices leads to a pullback parallel of highs and lows. That’s why, in a bullish flag pattern, you will see a rectangle sloping downwards, showing parallel lines.
How to Identify a Bull Flag Pattern?
As mentioned, entering and exiting a bull flag pattern can be highly beneficial for traders if done correctly. So, the first step is to identify and confirm the market trend before jumping in.
Bull Flag pattern
The most crucial aspect of identifying and confirming any flag pattern is to analyze its three main components. If these three aspects are placed correctly, your trade strategy will work flawlessly and generate your expected fruits.
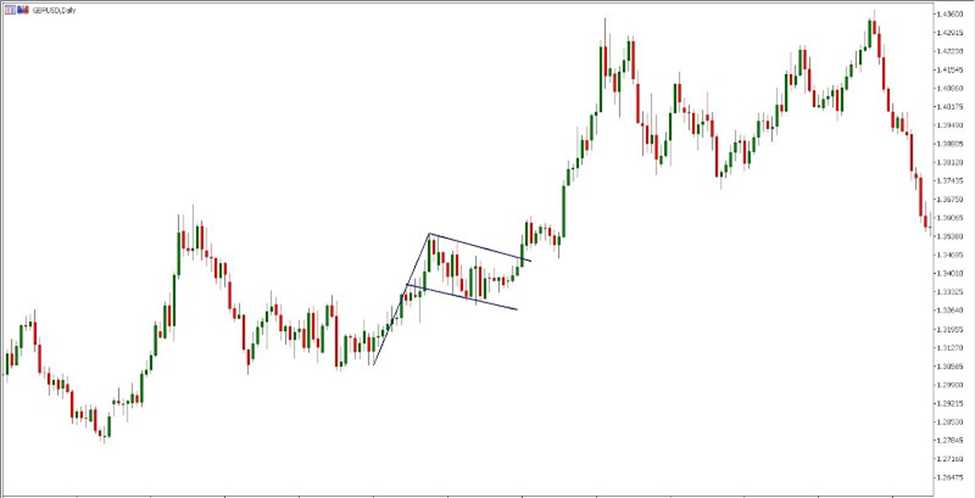
First, you should look for a sharp rise in price forming a flagpole. Remember, this rise should extend the asset or stock to a new near-term high compared to its recent price ranges.
Secondly, in a bullish flag formation, the market consolidates towards a retracement to the downside. This formed a sloping consolidation that confirms a bull flag pattern.
Remember, not all sloping trends showing retracements confirm a bullish trend. Make sure the retracement remains below 38% of the original movement. If it goes anywhere below 50%, the slope is probably not a bull flag pattern.
After the temporary corrective retracement, the market continues its upward trend to high prices. This is where the trader should enter the trend. Mainly, a trader should enter either here or at the bottom of the flag when the price becomes equal to the flagpole in height.
Another telltale component of a bullish trend is the formation of candlesticks. If the flagpole shows one or multiple candlesticks denoting a period of sharply rising prices, then it is a legitimate bull flag pattern.
In a nutshell, the flag pattern should slope downwards towards the right and move up gradually after a retracement. Ultimately, the flag continues until the price breaks and carries on towards a newly established uptrend. Now, the price is higher than the original length of the flagpole, displaying an evident bullish trend.
How to Trade a Bull Flag Pattern?
Bull flag pattern
After identifying a bull flag pattern, the next step is to trade it correctly for your benefit. While identifying a bullish trend is quite tricky, trading it afterward is simple.
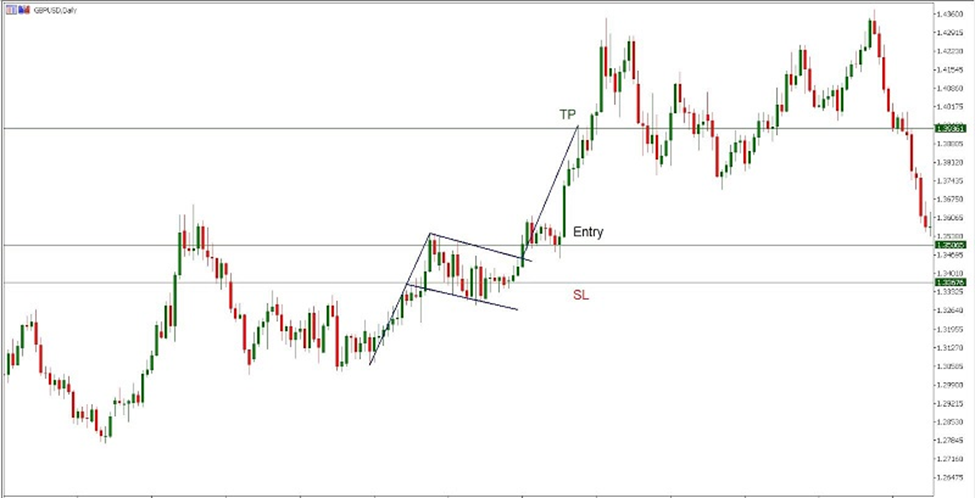
When you notice a consolidation in the price trends of a particular asset after a considerable rise, you should continue monitoring it until you notice a breakout. If the prices break out higher than the original flagpole after consolidation, then that is the time for you to open the deal.
While conducting a stop loss, make sure to place a stop order below the lowest level of the consolidation pattern. Again, it is good to go with the right balance of risk and reward in this situation. So, while your profit stands at around 50 cents from your entry price, you’ll be risking 25 cents to get your skin in the game.
To tell whether your entry will be successful, you should check the volume of the pattern. If the flag has an ascending trend of high volume, then the breakout will give you ample profits.
Remember one thing, even if statistics say otherwise, entering a bullish market setup might fail even if the pattern is identified correctly. So to avoid losing a lot of money, you should know how to tell if the setup is not going to pay out so you can exit it immediately.
The best way is to stop below the consolidation area. If the market trend does not rise upwards, you should withdraw your funds with a loss.
An easy way is to wait for at least 20 days to see how the market trend unfolds. If the prices move downwards after consolidation, you should close out your position.
What is a Bear Flag Pattern?
Now that you know all the details about identifying a bullish flag pattern and trading it correctly, you’re probably ready to part with your money. However, it is equally important to know all about its counterpart, the bear flag pattern, to avoid catastrophic confusion.
Understanding the bear flag pattern is relatively easy if you know how the bullish trend works. It is the exact opposite. While the bullish flag pattern moves from a low price level to a higher one with a strong, vertical ascend, a bear flagpole moves downwards.
This indicates that sellers are in complete control of the market instead of buyers. After the sudden drop in price ranges, the consolidation or corrective retracement goes upward. These upwards and downwards trends, when held parallel to each other, form a bear flag pattern.
How To Trade a Bear Flag?
Just like its definition and appearance, the trading technique for a bear flag pattern is opposite from that of a bull flag pattern. Simply put, both market trends are exact mirror images of each other.
If you wish to benefit from a bear flag pattern, all you have to do is reverse your technique. For example, you would look for an upward trend after consolidation during a bullish market trend. However, in case of a bearish trend, you should look for swing lows after a corrective retracement to see if the trend will work for your benefit.
Best Brokers to Consider
With the number of online brokers available these days, it is easy to enter financial markets even with limited experience. However, it can get tricky to select the right broker while trading patterns with the plethora of options available.
While looking for the right online broker, you shouldn’t necessarily go for the most popular or expensive online brokerage. Instead, each broker provides tailor-made services to its respective clients, so you should go with one that fits your needs.
Besides that, you should assess aspects like security regulation, account protection, and brokerage offerings that work for you. Below, we’ve provided a quick analysis of two popular online brokerage platforms to give you some insight.
IG


IG is one of the most popular multi-asset brokers online. This platform is publicly traded and regulated worldwide and provides an all-encompassing experience to its clients.
With a minimum deposit requirement of £250, IG provides some of the best investing tools in the industry. Besides that, the platform caters to a diverse clientele by offering more than 19,000 tradable instruments. So if you want to trade multiple patterns, this platform can work well for you.
Furthermore, IG is one of the pioneering online platforms that bought options trading and futures trading into the US market. However, on the downside, the platform lacks any sort of predefined layouts to make trading patterns easy for newbies. So, you’ll have to get some consultation and configure the platform manually to suit your needs if you have minimal knowledge of the market.
eToro

eToro is a well-known investment trading platform that provides more than 3000 tradeable symbols for its clients. These options include CFDs, exchange-traded securities, and forex.
With a minimum deposit range of $100, eToro is a good option for beginners looking to trade in patterns. However, its high fees can be a drawback for those who find it difficult to part with their hard-earned revenue.
But, multiple aspects of the platform justify its high fee. Namely, it is one of the safest brokers for making low-risk investments in forex and CFDs. Similarly, it has a user-friendly website and mobile app to facilitate clients on the go.
Summary
In a nutshell, a bull flag pattern occurs when an asset shows a sudden upward trend then consolidates for a retracement before further rising more than its initial price hike. In this situation, buyers control the market, meaning traders can benefit by investing at the breakthrough point after the consolidation.
On the other hand, a bearish pattern appears when an opposite phenomenon is seen in the market. If there is a sudden plummet seen in the price of an asset, then the sellers are in control, and traders can benefit by investing in the asset if a downward trend continues after consolidation.
Either way, trading in patterns can go wrong if identified incorrectly or entered at the wrong time. To help you out, you can sign up for online brokerage platforms to lower the risk factor when investing in patterns.
FAQs
If you still have some questions regarding the bull flag pattern or bear flag pattern, don’t worry. We’ve answered a few common questions right here to help you out.
What is a Flag Pattern?
A flag pattern is an identifiable trend usually used for technical analysis. These patterns help investors determine market trends and conduct profitable trades accordingly. Mainly, the flag pattern gets its name from its appearance resembling a flagpole and a flag.
What Are The Components of a Bull Flag Pattern?
A bull flag pattern consists of a flagpole denoting a considerable, almost vertical rise in price. After that, as the market consolidates in retracement before another price hike, the phenomenon forms the flag extending from the flagpole. Moreover, a bull flag pattern shows candlestick projections within the consolidation period.
Can You Rely On A Bull Flag Pattern?
If identified correctly, trading on a bull flag pattern brings good returns. However, like other patterns, it is subject to risks and fallacies. Therefore, it is a good idea to consult expert brokers if you’re unsure about entering a pattern.
When is a Bull Flag Considered Profitable?
A bull flag pattern is considered legitimate and profitable only when the bull trend rises after consolidation. If it does not, it is an indicator for the investor to close his investment.
Glossary for novice traders
-
1
Short selling
Short selling in trading involves selling an asset the trader doesn't own, anticipating its price will decrease, allowing them to repurchase it at a lower price to profit from the difference.
-
2
Options trading
Options trading is a financial derivative strategy that involves the buying and selling of options contracts, which give traders the right (but not the obligation) to buy or sell an underlying asset at a specified price, known as the strike price, before or on a predetermined expiration date. There are two main types of options: call options, which allow the holder to buy the underlying asset, and put options, which allow the holder to sell the underlying asset.
-
3
Investor
An investor is an individual, who invests money in an asset with the expectation that its value would appreciate in the future. The asset can be anything, including a bond, debenture, mutual fund, equity, gold, silver, exchange-traded funds (ETFs), and real-estate property.
-
4
Long position
A long position in Forex, represents a positive outlook on the future value of a currency pair. When a trader assumes a long position, they are essentially placing a bet that the base currency in the pair will appreciate in value compared to the quote currency.
-
5
Futures contract
A futures contract is a standardized financial agreement between two parties to buy or sell an underlying asset, such as a commodity, currency, or financial instrument, at a predetermined price on a specified future date. Futures contracts are commonly used in financial markets to hedge against price fluctuations, speculate on future price movements, or gain exposure to various assets.


Team that worked on the article

Oleg Tkachenko is an economic analyst and risk manager having more than 14 years of experience in working with systemically important banks, investment companies, and analytical platforms. He has been a Traders Union analyst since 2018. His primary specialties are analysis and prediction of price tendencies in the Forex, stock, commodity, and cryptocurrency markets, as well as the development of trading strategies and individual risk management systems. He also analyzes nonstandard investing markets and studies trading psychology.
Also, Oleg became a member of the National Union of Journalists of Ukraine (membership card No. 4575, international certificate UKR4494).

Olga Shendetskaya has been a part of the Traders Union team as an author, editor and proofreader since 2017. Since 2020, Shendetskaya has been the assistant chief editor of the website of Traders Union, an international association of traders. She has over 10 years of experience of working with economic and financial texts. In the period of 2017-2020, Olga has worked as a journalist and editor of laftNews news agency, economic and financial news sections. At the moment, Olga is a part of the team of top industry experts involved in creation of educational articles in finance and investment, overseeing their writing and publication on the Traders Union website.

Mirjan Hipolito is a journalist and news editor at Traders Union. She is an expert crypto writer with five years of experience in the financial markets. Her specialties are daily market news, price predictions, and Initial Coin Offerings (ICO).
