Best tips and strategies for Forex technical analysts


Editorial Note: While we adhere to strict Editorial Integrity, this post may contain references to products from our partners. Here's an explanation for How We Make Money. None of the data and information on this webpage constitutes investment advice according to our Disclaimer.
Technical analysis in Forex trading involves analyzing historical price data, charts, and indicators to identify patterns and anticipate future price movements, helping traders make more informed decisions and refine their strategies.
In the world of foreign exchange, traders rely on a variety of tools and techniques to make informed decisions and optimize their profitability. Technical analysis is one such technique, which involves analyzing historical price movements and trends to identify patterns and forecast future market behavior.
Through the use of charts and indicators, technical analysis can provide traders with valuable insights into market trends and help them identify potential entry and exit points for trades. As a result, it has become an essential tool for traders looking to make informed decisions in the fast-paced and dynamic world of Forex trading.
This guide takes a closer look at the principles and techniques of technical analysis, and explains how traders can use this approach to refine their strategies and work toward their financial goals.
What is Forex technical analysis?
Forex technical analysis involves studying past price movements to identify patterns, trends, and determine probabilities of future market behavior. It utilizes technical studies, indicators, and other analysis tools to make informed trading decisions. It is important to note that while technical analysis is commonly associated with Forex trading, it is also used across all asset classes, including stocks, commodities, and bonds.
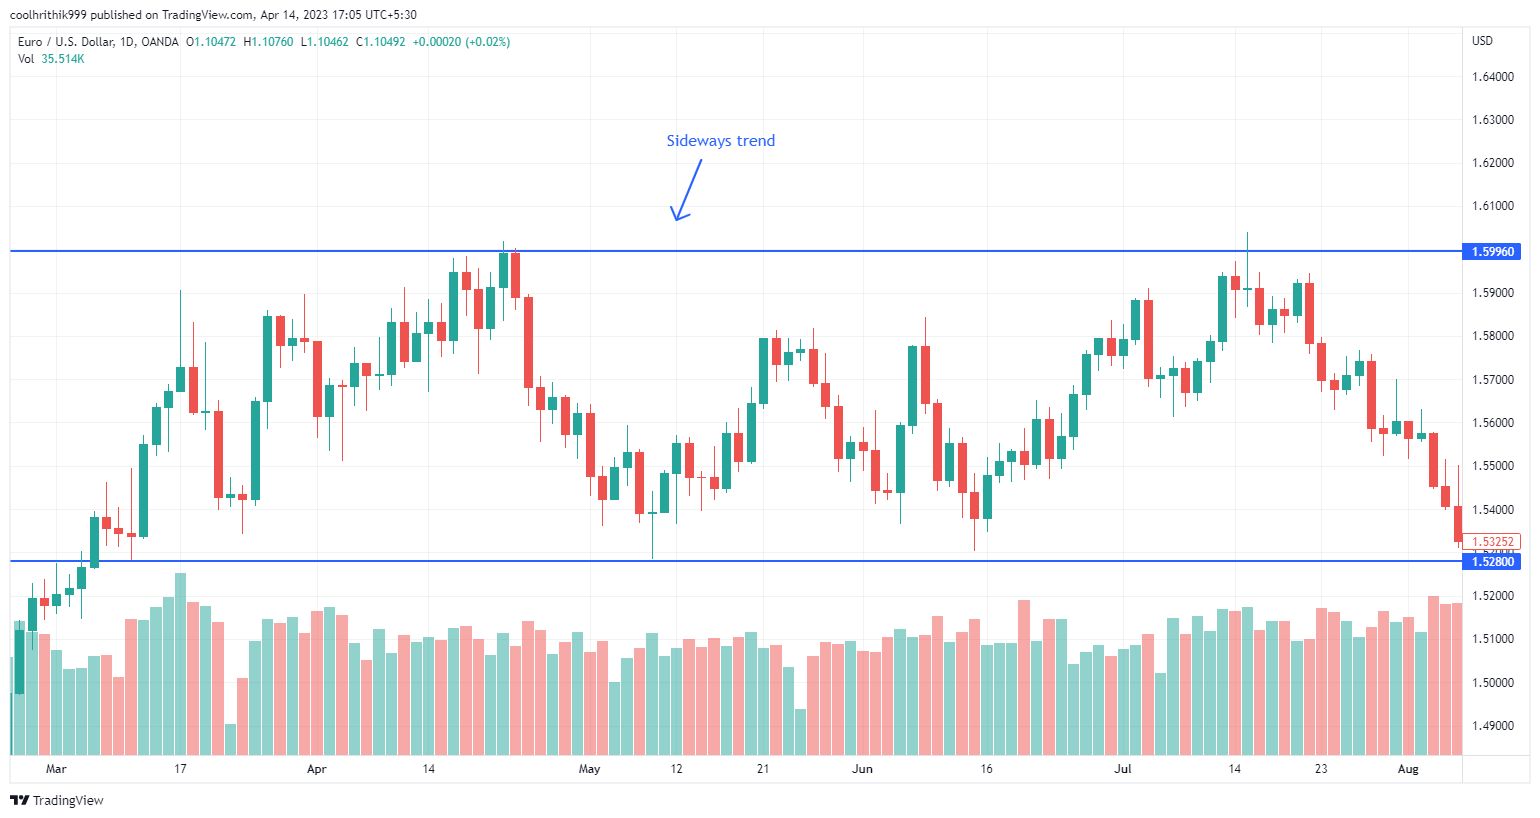
Technical analysis comprises two key components: identifying trends and identifying support/resistance through the use of price charts and/or timeframes. Markets move in three directions: up, down, or sideways, and price action typically moves in a zigzag pattern, creating two states: Range, when prices move sideways, and Trend, when prices either move up or down.
Why is technical analysis important?
Technical analysis is important because it helps traders determine not only when and where to enter a market but more importantly, when and where to exit a market. Analyzing historical price data can provide valuable insights into market trends and assist traders in making informed decisions about their trades.
Traders use technical analysis by assuming that markets are chaotic but not entirely random. Within a state of chaos, identifiable patterns tend to repeat themselves, an observation that is also replicated in nature through weather forecasts. So, while predicting exact price movements is not possible, technical analysis can help traders determine the probabilities of certain outcomes and make trades when the odds are in their favor.
In addition to technical analysis, successful trading also requires good risk management, discipline, and emotional control. There is no secret formula or combination of technical indicators that guarantees success in trading. Instead, it involves a thorough understanding of technical analysis, coupled with a commitment to good risk management and discipline. By managing risk and controlling emotions, traders can remain profitable over time.
Understanding the value of technical analysis is only the first step – applying it effectively requires the right trading environment.
That’s why choosing a broker with reliable charting tools, accurate data feeds, and low spreads is crucial.
The table below shows the best Forex brokers for technical analysis, selected by our experts for their functionality, performance, and trader support.
| zForex | Plus500 | Trading.com USA | OANDA | FOREX.com | |
|---|---|---|---|---|---|
|
Tradable assets |
80 | 2800 | 69 | 129 | 5500 |
|
Currency pairs |
50 | 60 | 69 | 68 | 80 |
|
Min. deposit, $ |
10 | 100 | 50 | No | 100 |
|
Standard EUR/USD spread |
0.3 | 0.7 | 1.1 | 0.3 | 1.0 |
|
Standard GBP/USD spread |
0.4 | 0.8 | No | 0.3 | 1.2 |
|
Deposit fee, % |
No | No | No | No | No |
|
Withdrawal fee, % |
No | No | No | No | No |
|
Daily volume, $ bn |
No | No | 5,000 | 12,84 | 18,6 |
|
TU overall score |
7.89 | 7.52 | 6.81 | 6.8 | 6.74 |
|
Open an account |
Go to broker Your capital is at risk.
|
Go to broker 80% of retail CFD accounts lose money. |
Go to broker Your capital is at risk. |
Go to broker Your capital is at risk. |
Study review |
Does Technical Analysis work in Forex trading?
While there is debate surrounding the efficacy of technical analysis in Forex trading, some evidence suggests that it can be a useful tool when utilized correctly. However, it is essential to keep in mind that no method guarantees 100% accuracy.
Some academic studies have criticized technical analysis, pointing out that certain strategies may have worked in the past but are no longer as effective. For instance, David Aronson's research, which examined 6,402 technical rules, found that none outperformed the S&P 500.
Nevertheless, other studies have produced more favorable results. Notable quantitative expert Andrew Lo's research at MIT, for example, supports the effectiveness of momentum strategies. This finding aligns with the ideas of 1920s Wall Street legend Jesse Livermore, who famously said, "prices are never too high to begin buying or too low to begin selling."
Critics argue that studies often fail to account for the combination of technical rules that analysts use in practice. Moreover, the most successful strategies may be closely guarded secrets, making it difficult to evaluate their true impact. One way to assess the effectiveness of technical analysis is by examining the performance of investors who employ these methods.
A study analyzing the portfolios of over 10,000 fund managers across 20 years found that those utilizing technical analysis offered meaningful advantages to investors compared to those relying solely on fundamentals. However, the story is different for ordinary investors. Research on Dutch investors over six years revealed that those using technical analysis inclined to overtrading and speculating, underperforming their non-technical counterparts by 8.4 percentage points annually.
Ultimately, the accuracy of technical analysis depends on factors like the strategy's historical win rate and the risk-reward (RR) ratio. Traders can determine the effectiveness of their chosen approach by conducting a "backtest" to analyze how the market would have responded in the past. In general, a win rate above 65% with a positive RR ratio, where the targeted profit is twice the amount risked, indicates a potentially successful strategy.
To conclude, technical analysis can be a beneficial tool for Forex trading, but its effectiveness varies depending on the strategies and methods applied. Traders should carefully evaluate their chosen approach, considering historical win rates and risk-reward ratios to maximize their chances of success.
Do traders use Technical Analysis in Forex?
It is evident that technical analysis plays a significant role in Forex trading, with a considerable percentage of professional traders incorporating these methods into their strategies. According to studies, about 80% of professional traders rely on technical analysis, while the remaining 20% prefer alternative techniques, such as fundamental analysis.
The widespread adoption of technical analysis among professional traders highlights its perceived value in the Forex market. However, it is crucial for traders to remember that no single approach guarantees success, and combining different methods, such as technical and fundamental analysis, can potentially lead to more informed decision-making.
Technical analysis basics
Let us now go through some basics of technical analysis in Forex:
Types of trends:
Uptrend: An uptrend occurs when the market is making higher highs and higher lows. This means that the price is trending upwards over time. Traders look for opportunities to buy during an uptrend, as they expect the price to continue to rise. Uptrends can be identified using trendlines, moving averages, or other technical indicators.

Downtrend: A downtrend occurs when the market is making lower highs and lower lows. This means that the price is trending downwards over time. Traders look for opportunities to sell during a downtrend, as they expect the price to continue to fall. Downtrends can also be identified using trendlines, moving averages, or other technical indicators.

Sideways trend: A sideways trend occurs when the market is trading in a range, with no clear direction. During a sideways trend, traders look for opportunities to buy low and sell high within the range. Sideways trends can be identified using support and resistance levels, Bollinger Bands, or other technical indicators.
Types of strategies:
Day Trading: Day trading is a trading strategy that involves opening and closing trades within the same day. Technical analysis is commonly used to identify potential trading opportunities, and a range of technical indicators can be used to make trading decisions. Day trading can be highly stressful and risky, but it can also be highly profitable if executed correctly.
Swing Trading: Swing trading is a medium-term trading strategy where trades are held for several days or weeks. Swing traders also use technical analysis to identify potential trading opportunities and may use multiple technical indicators to make trading decisions. Although swing trading is less stressful and involves lower risk compared to day trading, it requires patience and discipline to hold trades for extended periods.
Scalping: Scalping is a high-frequency trading strategy that involves opening and closing trades within seconds or minutes. Scalpers typically use technical analysis to identify potential trading opportunities and may use a variety of technical indicators to make trading decisions. Scalping can be very profitable, but it requires quick reflexes and a high level of skill to execute trades at such a fast pace.
Buy and Hold: Buy and hold is a long-term trading strategy that involves buying assets and holding them for an extended period of time. Buy and hold traders typically use fundamental analysis to identify potential investments, and they may hold their positions for months or even years. Buy and hold trading can be less stressful and lower risk than short-term trading strategies, but it requires a long-term outlook and a willingness to withstand market volatility.
Position Trading: Position trading is a long-term trading strategy that involves holding positions for several weeks or months. Position traders typically use a combination of technical and fundamental analysis to identify potential trading opportunities, and they may use a variety of technical indicators to make trading decisions. Position trading can be less stressful and lower risk than short-term trading strategies, but it requires patience and discipline to hold positions for longer periods of time.
| Day Trading | Swing Trading | Scalping | Buy and Hold | Position Trading | |
|---|---|---|---|---|---|
Risk | High | Moderate | High | Low | Moderate |
Capital | High | Moderate | Low | Low | Moderate |
Duration | Short-term | Medium-term | Short-term | Long-term | Long-term |
Skills Required | Advanced | Intermediate | Advanced | Beginner | Intermediate |
Frequency of Trades | High | Low | Very High | Very Low | Low |
Time Commitment | High | Moderate | High | Low | Moderate |
Market Sensitivity | High | Moderate | High | Low | Moderate |
Technical Analysis | Essential | Essential | Essential | Helpful | Essential |
Fundamental Analysis | Less Crucial | Important | Less Crucial | Crucial | Important |
Emotional Control | Essential | Important | Essential | Helpful | Important |
Leverage Usage | Moderate | Moderate | High | Low | Moderate |
Commissions Impact | High | Low | High | Low | Low |
Types of indicators:
Leading Indicators: Leading indicators are used to predict future price movements. They are designed to identify potential trading opportunities before they occur. Some common leading indicators include the Relative Strength Index (RSI), Stochastic Oscillator, and Moving Average Convergence Divergence (MACD). Leading indicators can be used to identify overbought or oversold conditions, potential trend reversals, or momentum shifts in the market.
Lagging Indicators: Lagging indicators are used to confirm trends. They are designed to identify potential trading opportunities after they occur. Some common lagging indicators include moving averages, Bollinger Bands, and Ichimoku Clouds. Lagging indicators can be used to confirm the direction of the trend, identify key support and resistance levels, or determine the strength of a trend.
Top indicators in technical analysis
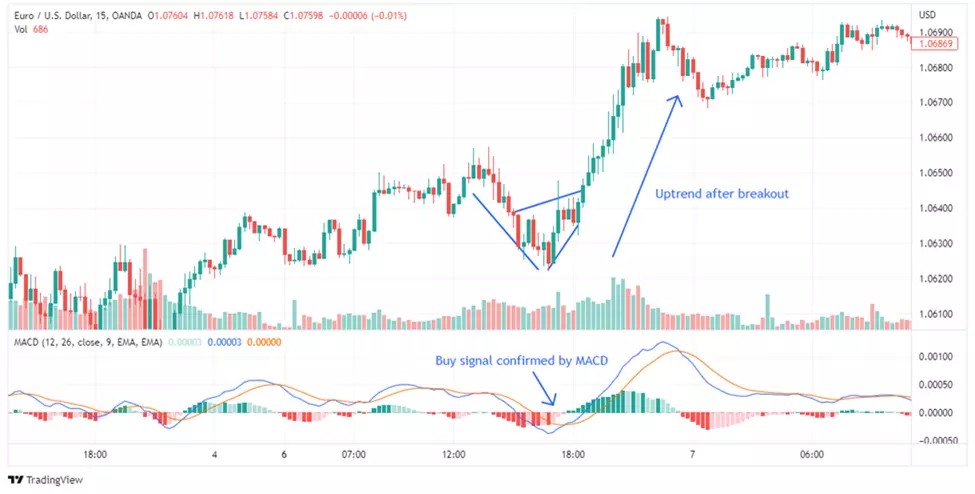
Moving Average Convergence Divergence (MACD):
The Moving Average Convergence Divergence (MACD) is a technical indicator that helps traders identify trends. It measures the difference between two exponential moving averages (a 26-period and a 12-period). A 9-period exponential moving average is then plotted on top of the MACD line to create a signal line. Traders use this indicator to determine trend reversals and the strength of a trend. If the MACD line crosses above the signal line, it is a bullish signal indicating that prices may go up. Conversely, if the MACD line crosses below the signal line, it is a bearish signal suggesting that prices may go down.
Relative Strength Index (RSI):
The RSI is a momentum indicator that measures the strength of a trend by comparing the magnitude of recent price gains to recent price losses. It is calculated using a formula that takes into account the average gain and average loss over a specified period of time, typically 14 periods.
The RSI is plotted on a scale of 0 to 100, with overbought conditions typically occurring when the RSI is above 70 and oversold conditions occurring when the RSI is below 30. Traders use the RSI to identify potential trend reversals and to confirm the strength of a trend.
Parabolic SAR:
The Parabolic SAR is a trend-following indicator that is used to identify potential trend reversals. SAR stands for Stop and Reverse, as the indicator is designed to help traders enter and exit trades based on the direction of the trend.
It is calculated by plotting a series of dots on the chart, with each dot representing a potential reversal point. When the price is rising, the dots are plotted below the price, indicating a bullish trend. When the price is falling, the dots are plotted above the price, indicating a bearish trend.
Bollinger Bands:
Bollinger Bands are a volatility indicator that is used to identify potential trend reversals and to measure the strength of a trend. The bands consist of three lines: a simple moving average (typically 20 periods), an upper band (typically two standard deviations above the moving average), and a lower band (typically two standard deviations below the moving average).
When the price is trading within the bands, it is considered to be in a range-bound market. When the price breaks above the upper band, it is a bullish signal, indicating that prices may be poised to rise. When the price breaks below the lower band, it is a bearish signal, indicating that prices may be poised to fall.
Forex strategies: Top 3 Forex chart patterns
Chart patterns are distinct formations that appear on price charts, which traders use to identify potential trading opportunities. These patterns are created by the movement of price over time and can be used to identify potential trend reversals or continuation patterns. Some common chart patterns include head and shoulders, double top, double bottom, triangle, and flag patterns. Traders use chart patterns in conjunction with other technical indicators and fundamental analysis to make informed trading decisions.
1. Head and Shoulders Pattern
The Head and Shoulders pattern is a popular trading strategy used to identify potential trend reversals. This pattern consists of a central peak (the head) flanked by two lower peaks (the shoulders), forming a distinct shape on the chart.
Entry Point: To identify the entry point in the Head and Shoulders pattern, traders look for a break below the neckline, which is a support level drawn by connecting the lows between the head and the shoulders. Traders may wait for additional confirmation, such as a decline in volume, before entering a short position.
Exit Point: To determine exit points using the Head and Shoulders pattern, traders typically measure the distance between the head's highest point and the neckline. They then project this distance downward from the neckline to establish a price target for exiting the trade. Traders may also use Fibonacci retracement levels or other technical indicators to identify potential take-profit levels and to set stop-loss orders to minimize potential losses.

2. Flag Pattern Strategy
The Flag Pattern strategy is a dynamic trading approach used to capture continuation patterns within an ongoing trend. This strategy relies on the formation of a flag pattern, which indicates that the current trend is likely to resume after a temporary pause in price movement.
Entry Point: To identify the entry point for the Flag Pattern strategy, traders should observe the breakout of the flag formation. In the case of a bullish flag, traders may initiate a long position when the price breaks above the upper boundary of the flag formation, signalling a likely continuation of the upward trend. Alternatively, traders may wait for additional confirmation, such as a surge in trading volume, before entering the trade.
Exit Point: To establish the exit points for this strategy, traders should start by measuring the length of the flagpole, which represents the initial price movement before the consolidation phase. They can then project this length from the breakout point of the flag formation to determine a price target and an appropriate exit point for their trade.
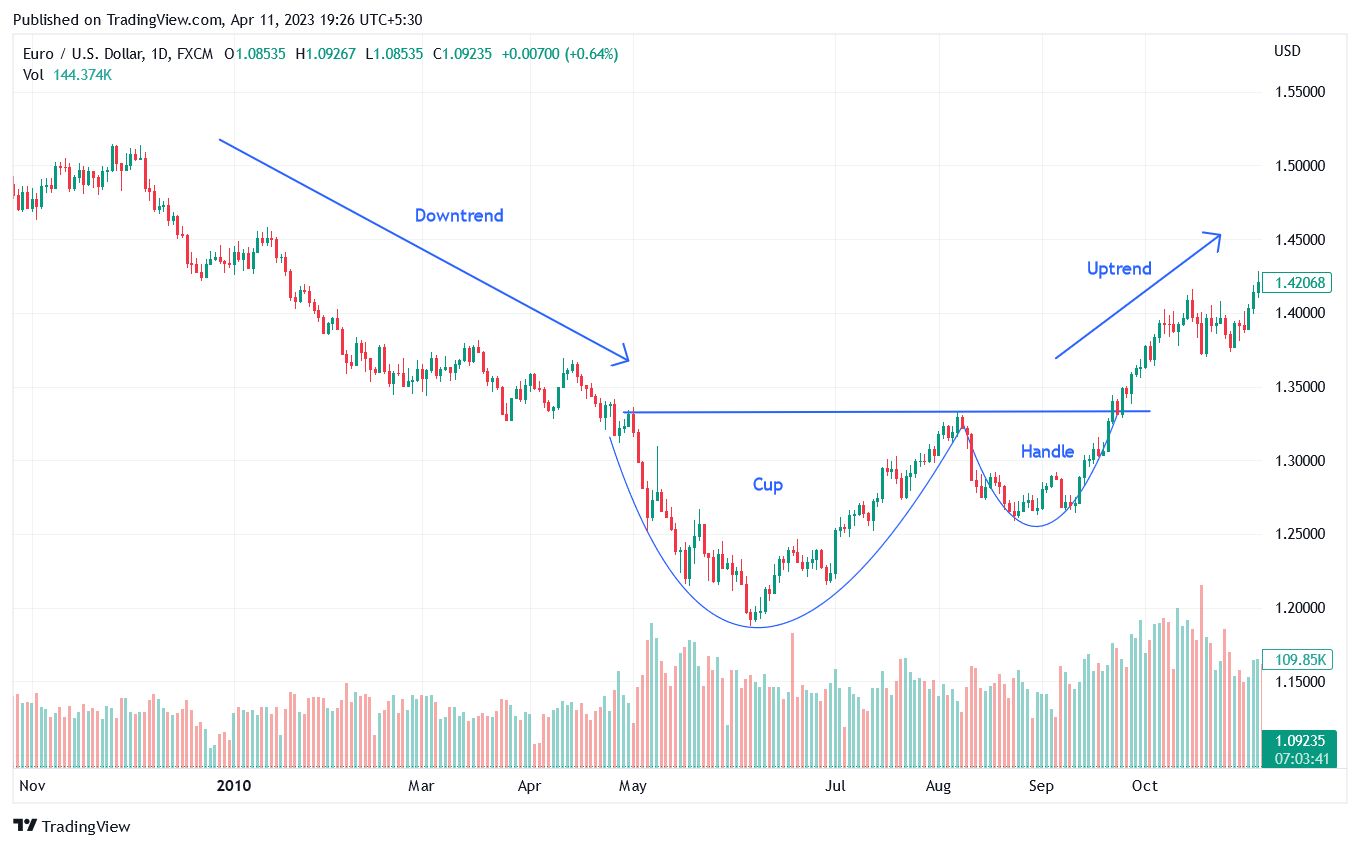
3. Cup and Handle Pattern
The Cup and Handle pattern is a well-known bullish continuation pattern used by traders to identify potential buying opportunities. This pattern typically indicates that an asset's current uptrend is likely to continue after a period of consolidation.
Entry Point: To identify the entry point in the Cup and Handle pattern, traders should look for a breakout above the upper trend line of the handle. They can place a stop buy order slightly above the trend line or wait for the price to close above it before placing a limit order slightly below the breakout level. Traders may also look for additional confirmation, such as a surge in trading volume or a bullish crossover in technical indicators like the Moving Average Convergence Divergence (MACD) or the Relative Strength Index (RSI).
Exit Point: To establish an exit point for this pattern, traders should measure the distance between the bottom of the cup and the pattern's breakout level and then project this distance upward from the breakout. For example, if the distance is 20 points, traders may set a profit target 20 points above the handle.
Forex strategies: Top 3 Forex candlestick patterns
Candlestick patterns are a type of technical analysis used by traders to evaluate potential market trends and make informed trading decisions. They are formed by the price movements of an asset over a specific time period and are represented by individual candles on a price chart. Each candle represents the opening, closing, high, and low prices of an asset for a given period. Different candlestick patterns can indicate potential trend reversals or continuation patterns, providing traders with valuable insights into future price action.
1. Bullish Engulfing: A Bullish Engulfing pattern occurs when a small red candle is followed by a larger green candle that completely covers the previous day's candle. This pattern suggests that buying pressure has surpassed selling pressure, leading to a change in market sentiment that could result in an upward price movement.

2. Morning Star: The Morning Star pattern consists of three candlesticks: a long red candle, a small-bodied candle (either red or green) with a lower gap, and a long green candle that closes within the first candle's range. This pattern indicates a potential reversal of a downtrend, as the small-bodied candle reflects market indecision followed by a strong green candle that suggests a bullish turnaround.

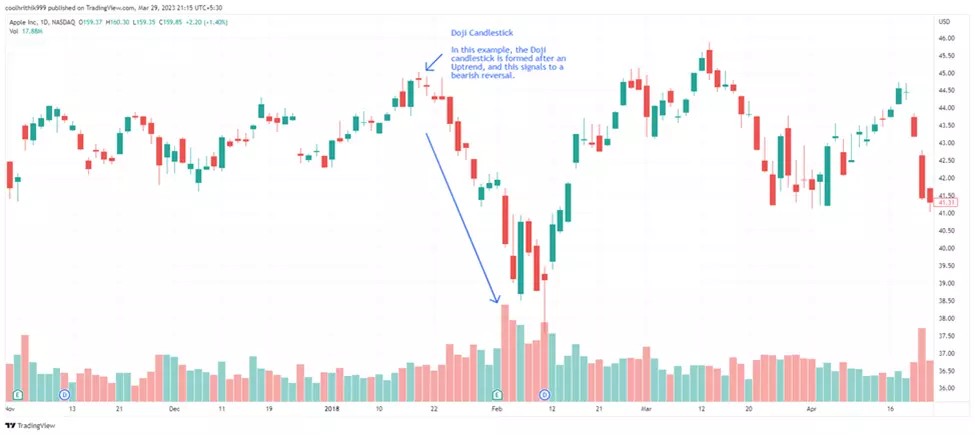
3. Doji: A Doji candlestick pattern forms when a security's opening and closing prices are nearly identical, resulting in a small or non-existent body with potentially long shadows. This pattern represents market indecision and may indicate a potential trend reversal or continuation, depending on the context of the preceding candles and overall market trend.
Charts alone are not enough for successful trading

First, remember that charts only tell part of the story - it's important to consider broader market and economic factors as well that could impact price movements. Technical indicators alone won't make you money; you still need a solid strategy for identifying levels to enter and exit trades.
When looking at support and resistance levels, don't get too married to exact price points on the chart. Market forces can cause these levels to be broken, so keep a close eye out for changes in momentum. Moving averages are useful for identifying trends, but be aware of timeframes - shorter durations may give more false signals.
Technicals can highlight buying or selling opportunities, but you have to understand why the price is doing what it's doing. Sector strength, earnings reports, and macro factors need to be considered too for a well-rounded view.
Conclusion
In conclusion, mastering technical analysis is essential for anyone seeking consistent success in Forex trading. By effectively utilizing chart patterns and indicators such as moving averages or RSI, traders can gain valuable insights into market trends and potential turning points. For example, recognizing a head-and-shoulders pattern or a bullish divergence can significantly elevate your decision-making. Ultimately, technical analysis empowers traders not just to react to market movements, but to anticipate them—transforming uncertainty into opportunity.
FAQs
What are common mistakes to avoid when using technical analysis in Forex trading?
How do different timeframes affect the reliability of technical analysis in Forex?
What role does emotional control play in applying technical analysis to Forex trading?
Can combining technical analysis with other methods improve Forex trading outcomes?
Editors' Top Picks and Insights

BitMEX is shutting down: Why Trump could not save the exchange

Do governments need crypto workers?

Brent nears $100: Why oil prices are rising

Gram Wallet launch: Can Telegram bring crypto to the masses?

AI without limits: How dangerous are neural networks?

Worldcoin on Wall Street: From iris scans to ETF
Related Articles
Team that worked on the article
Ivan is a financial expert and analyst specializing in Forex, crypto, and stock trading. He prefers conservative trading strategies with low and medium risks, as well as medium-term and long-term investments.
Chinmay Soni is a financial analyst with more than 5 years of experience in working with stocks, Forex, derivatives, and other assets. As a founder of a boutique research firm and an active researcher, he covers various industries and fields, providing insights backed by statistical data.
Mirjan Hipolito is a journalist and news editor at Traders Union. She is an expert crypto writer with five years of experience in the financial markets.
Swing trading is a trading strategy that involves holding positions in financial assets, such as stocks or forex, for several days to weeks, aiming to profit from short- to medium-term price swings or "swings" in the market. Swing traders typically use technical and fundamental analysis to identify potential entry and exit points.
Price action trading is a trading strategy that relies primarily on the analysis of historical price movements and patterns in financial markets, such as stocks, currencies, or commodities. Traders who use this approach focus on studying price charts, candlestick patterns, support and resistance levels, and other price-related data to make trading decisions.
Bollinger Bands (BBands) are a technical analysis tool that consists of three lines: a middle moving average and two outer bands that are typically set at a standard deviation away from the moving average. These bands help traders visualize potential price volatility and identify overbought or oversold conditions in the market.
A long position in Forex, represents a positive outlook on the future value of a currency pair. When a trader assumes a long position, they are essentially placing a bet that the base currency in the pair will appreciate in value compared to the quote currency.
CFD is a contract between an investor/trader and seller that demonstrates that the trader will need to pay the price difference between the current value of the asset and its value at the time of contract to the seller.

-
 Afghanistan
-
 Albania
-
 Algeria
-
 Angola
-
 Argentina
-
 Armenia
-
 Australia
-
 Austria
-
 Azerbaijan
-
 Bahamas
-
 Bahrain
-
 Bangladesh
-
 Belarus
-
 Belgium
-
 Bolivia
-
 Botswana
-
 Brazil
-
 Brunei
-
 Bulgaria
-
 Cambodia
-
 Cameroon
-
 Canada
-
 Chile
Chile
-
 China
China
-
 Colombia
-
 Congo
Congo
-
 Costa Rica
-
 Cote d'Ivoire
-
 Croatia
-
 Cuba
Cuba
-
 Cyprus
-
 Czechia
-
 DR Congo
-
 Denmark
-
 Dominican Republic
-
 Ecuador
-
 Egypt
Egypt
-
 El Salvador
-
 Estonia
-
 Eswatini
-
 Ethiopia
-
 Finland
-
 France
-
 Georgia
-
 Germany
-
 Ghana
Ghana
-
 Greece
-
 Haiti
Haiti
-
 Hong Kong
-
 Hungary
-
 India
India
-
 Indonesia
-
 Iran, Islamic republic
-
 Iraq
Iraq
-
 Ireland
-
 Israel
-
 Italy
Italy
-
 Jamaica
-
 Japan
Japan
-
 Jordan
-
 Kazakhstan
-
 Kenya
Kenya
-
 Korea
Korea
-
 Kuwait
-
 Kyrgyzstan
-
 Laos
Laos
-
 Latvia
-
 Lebanon
-
 Lesotho
-
 Libya
Libya
-
 Lithuania
-
 Luxembourg
-
 Madagascar
-
 Malaysia
-
 Malta
Malta
-
 Mauritius
-
 Mexico
-
 Moldova
-
 Mongolia
-
 Montenegro
-
 Morocco
-
 Mozambique
-
 Myanmar
-
 Namibia
-
 Nepal
Nepal
-
 Netherlands
-
 New Zealand
-
 Nigeria
-
 North Macedonia
-
 Norway
-
 Oman
Oman
-
 Pakistan
-
 Palestine
-
 Panama
-
 Papua New Guinea
-
 Paraguay
-
 Peru
Peru
-
 Philippines
-
 Poland
-
 Portugal
-
 Puerto Rico
-
 Qatar
Qatar
-
 Reunion
-
 Romania
-
 Rwanda
-
 Saudi Arabia
-
 Serbia
-
 Singapore
-
 Slovakia
-
 Slovenia
-
 Somalia
-
 South Africa
-
 Spain
Spain
-
 Sri Lanka
-
 Sweden
-
 Switzerland
-
 Syria
Syria
-
 Taiwan
-
 Tajikistan
-
 Tanzania
-
 Thailand
-
 Trinidad and Tobago
-
 Tunisia
-
 Turkey
-
 UAE
UAE
-
 Uganda
-
 Ukraine
-
 United Kingdom
-
United States
-
 Uruguay
-
 Uzbekistan
-
 Venezuela
-
 Vietnam
-
 Yemen
Yemen
-
 Zambia
-
 Zimbabwe
- Forex
- Crypto
