How To Use Moving Averages To Map Price Behavior With Precision


Editorial Note: While we adhere to strict Editorial Integrity, this post may contain references to products from our partners. Here's an explanation for How We Make Money. None of the data and information on this webpage constitutes investment advice according to our Disclaimer.
Moving averages help traders smooth out price data to identify trends and key reaction zones. Instead of using them as buy or sell signals, the real value is in spotting where price consistently respects the same average across timeframes. This reveals levels where buyers or sellers may step in again — turning simple lines into high-probability zones.
Moving averages are not supposed to forecast prices. They show you how the market has been responding over time. What makes them useful is not just the slope or the crossover. It is when and where price shows respect for the same level across multiple timeframes. A 20-period average on a 15-minute chart might not matter by itself. But if it lines up with the 50 on a one-hour chart and price reacts there again, that is worth noticing.
Most traders miss it because they treat moving averages like buy and sell signals. But they are really a way to map price behavior. And that is where you can find real trades. In this article, we’ll take a detailed look into using moving averages for trading, covering key aspects any trader should know.
Introduction to moving averages
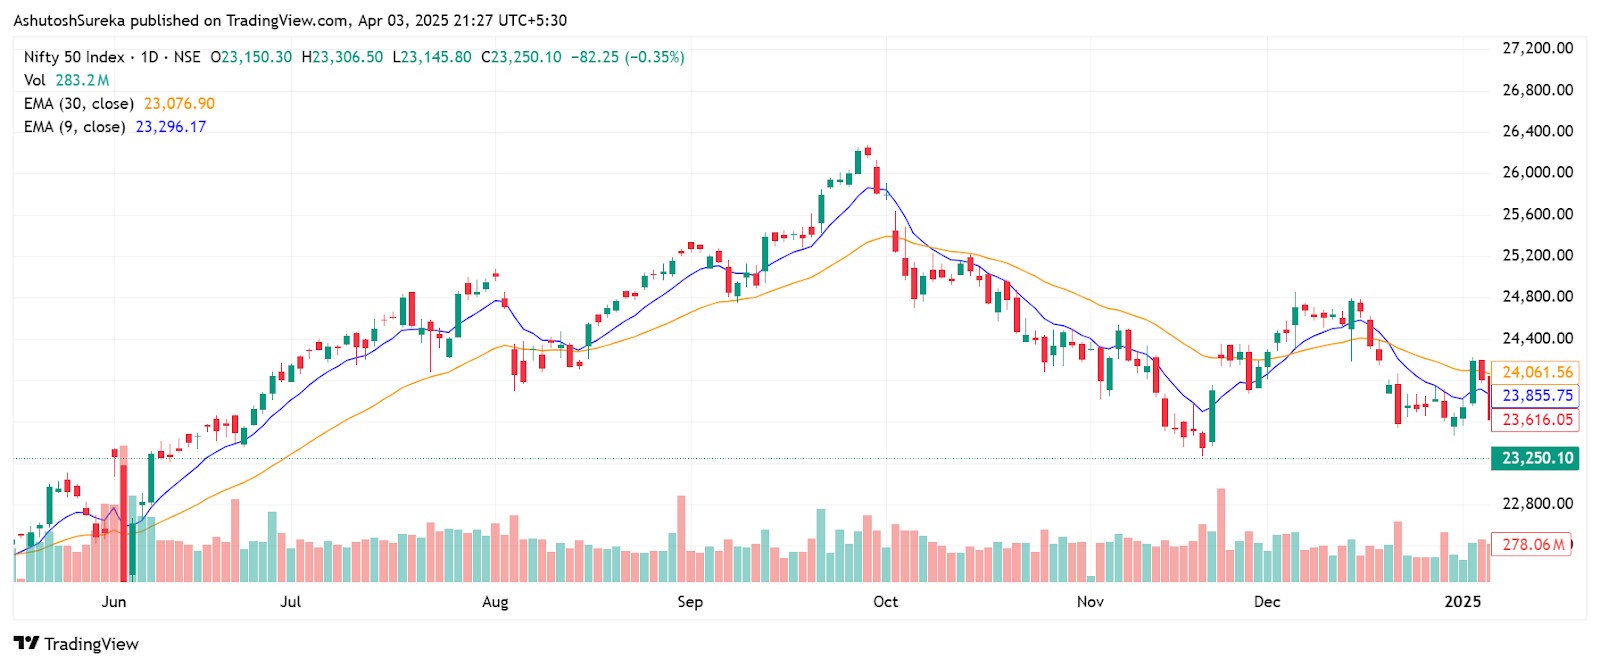
Moving averages are among the most widely used tools in technical analysis. They help smooth out price data, making it easier to spot trends and understand the overall direction of the market. Whether you’re a beginner or an experienced trader, moving averages are one of the first indicators worth learning.
What moving averages do
Simplify price action. By averaging out the highs and lows over a certain number of periods, moving averages strip away short-term noise.
Help identify trend direction. If the price is above the moving average, the trend is generally considered up. If the price is below, it is usually seen as a downtrend.
Work as dynamic support and resistance. Moving averages often act as levels where price bounces or finds resistance.
Types of moving averages
There are several kinds of moving averages, and each one reacts to price in its own way. Some are slow and steady, others move quickly to keep up with the market. Picking the right type depends on your goals and the style of trading you prefer.
Simple moving average
This is the classic version — it just takes the average of recent closing prices.
Why it’s useful
Easy to understand and widely used.
Gives a clean, steady line that shows the bigger trend.
Slower to react, so it’s good for long-term views.
Exponential moving average
This version gives more weight to the most recent candles, so it reacts faster.
Why it’s useful
Great for spotting short-term shifts.
Used in a lot of crossover strategies.
Popular with day traders and swing traders who want to stay close to the price.
Weighted moving average
Like the EMA, this also gives more importance to recent prices, but in a straight-line fashion.
Why it’s useful
A bit faster than SMA, slightly different from EMA.
Good for traders who want something in between.
Less common, but handy for fine-tuning a system.
Smoothed moving average
This one spreads its calculation out over more candles, so it reacts very slowly.
Why it’s useful
Great for filtering out noise.
Helps traders who only care about the major trend.
Often used on higher timeframes like the daily or weekly chart.
Adaptive and custom moving averages
Some newer tools adjust themselves based on how the market is moving.
Why they’re different
They try to stay smooth in calm markets and speed up when things get volatile.
Used mostly in advanced strategies or automated systems.
Helpful if you want to build a more responsive setup without switching between multiple indicators.
Origin and development of moving averages
Moving averages have their roots in basic statistical analysis and were later adapted for trading purposes. They became a key part of modern technical analysis during the rise of computerized charting in the mid-20th century.
Where they come from
First used in statistics and economics. Before trading, moving averages were used to analyze business cycles and financial data trends.
Adapted by technical analysts. Traders began using them to identify market direction and to filter out minor fluctuations.
How they evolved
From hand-drawn charts to real-time trading. In the early days, traders would plot moving averages manually. Now, they’re calculated and updated automatically on every trading platform.
Used in nearly every strategy. From crossover systems to momentum trading and even algorithmic models, moving averages are found in almost every type of trading setup.
Understanding the moving average formula
At its core, a moving average just finds the average price over a certain number of candles. It smooths out the chart and helps you focus on the bigger picture instead of short-term price spikes. Different types use slightly different math, but they all follow the same basic idea.
Simple moving average
This version takes the average of the last few closing prices — all of them count equally.
The formula
SMA = Total of closing prices / Number of periods
So if the last five candles closed at 100, 102, 101, 104, and 103, the SMA would be:
{100 + 102 + 101 + 104 + 103} / 5 = 102
That 102 gets plotted as one point on the moving average line.
Exponential moving average
The EMA does something a little smarter. It still uses the average, but it gives more weight to recent prices so it reacts faster when the market changes.
The formula
It uses a multiplier that’s based on how many candles you want to include:
Multiplier = 2 / (n+1)
Then it calculates each new EMA value like this.
EMA = (Current Price × Multiplier) + (Previous EMA × (1 − Multiplier))
You usually start by using an SMA for the first value, then keep updating it from there.
Weighted moving average
The WMA is similar to the EMA but does the math in a straight line — the most recent price gets the most weight, and it drops gradually from there.
The formula
Multiply the most recent price by the highest number.
Multiply the second-most recent by the next lower number.
Keep going, then divide by the total of the weights.
If you’re using 5 candles, the weights are 5, 4, 3, 2, 1 — which adds up to 15.
How to set up moving averages
Moving averages are available by default on almost every charting platform, and setting them up takes just a few clicks. Once applied, they appear as a smooth line that follows price — giving you a visual view of the trend. You can customize the type, length, and color depending on your strategy and chart setup.
Access the indicator
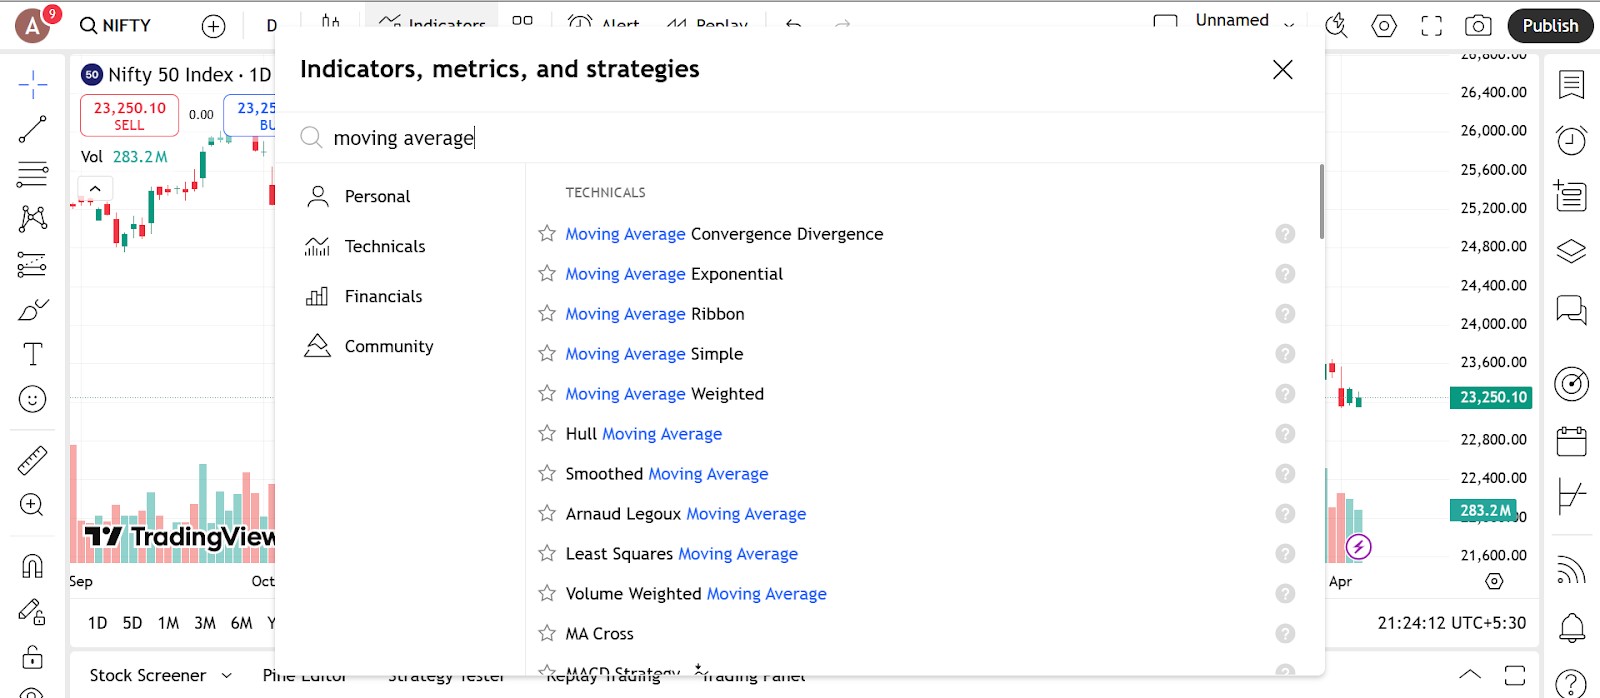
To start using a moving average, all you need to do is find it in your charting tool’s indicator library.
Where to find it
Open the indicators menu on your trading platform.
Search for moving average, SMA, or EMA.
Click to apply — the default is usually a 9 or 14 period SMA.
It will show as a line that moves along with the price on your chart.
Supported platforms
TradingView, MetaTrader, ThinkorSwim, NinjaTrader, and most other platforms include it as a built-in option.
Most platforms also support multiple moving averages on one chart.
Configure the parameters
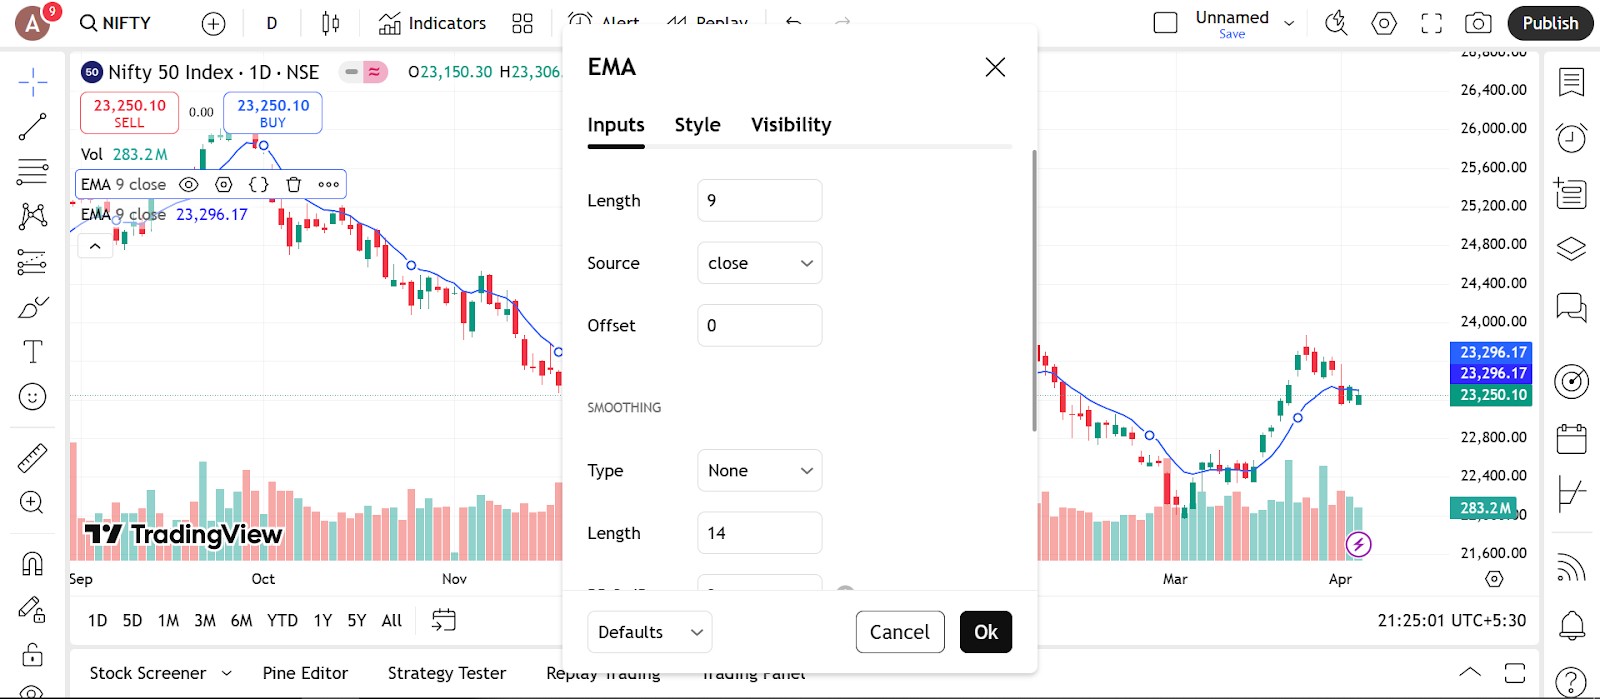
Once the moving average is on your chart, you can adjust the settings to match your timeframe and trading goals.
Choose the type
Simple moving average (SMA) for steady long-term trends.
Exponential moving average (EMA) for faster short-term reaction.
Weighted or smoothed if you want more fine-tuned adjustments.
Set the period
Short-term settings like 9, 10, or 20 respond quickly and are used for scalping or day trading.
Medium-term settings like 50 help catch bigger moves or trend reversals.
Long-term settings like 100 or 200 are popular for spotting major trends and overall market bias.
Customize the visuals
Change the color to make it easy to see — use green for short-term, blue for mid-term, and red for long-term if you’re using multiple lines.
Adjust line thickness so the average stands out from the price.
On some platforms, you can even add alerts when price crosses the moving average.
Combine more than one moving average
You can add multiple moving averages to the same chart to build a full system.
Example setup
20 EMA for short-term entries.
50 EMA for trend confirmation.
200 SMA to define the overall direction.
When the shorter average crosses above the longer one, that can signal a potential trend shift.
Trading strategies using moving averages
Now let’s discover the top moving averages trading strategies:
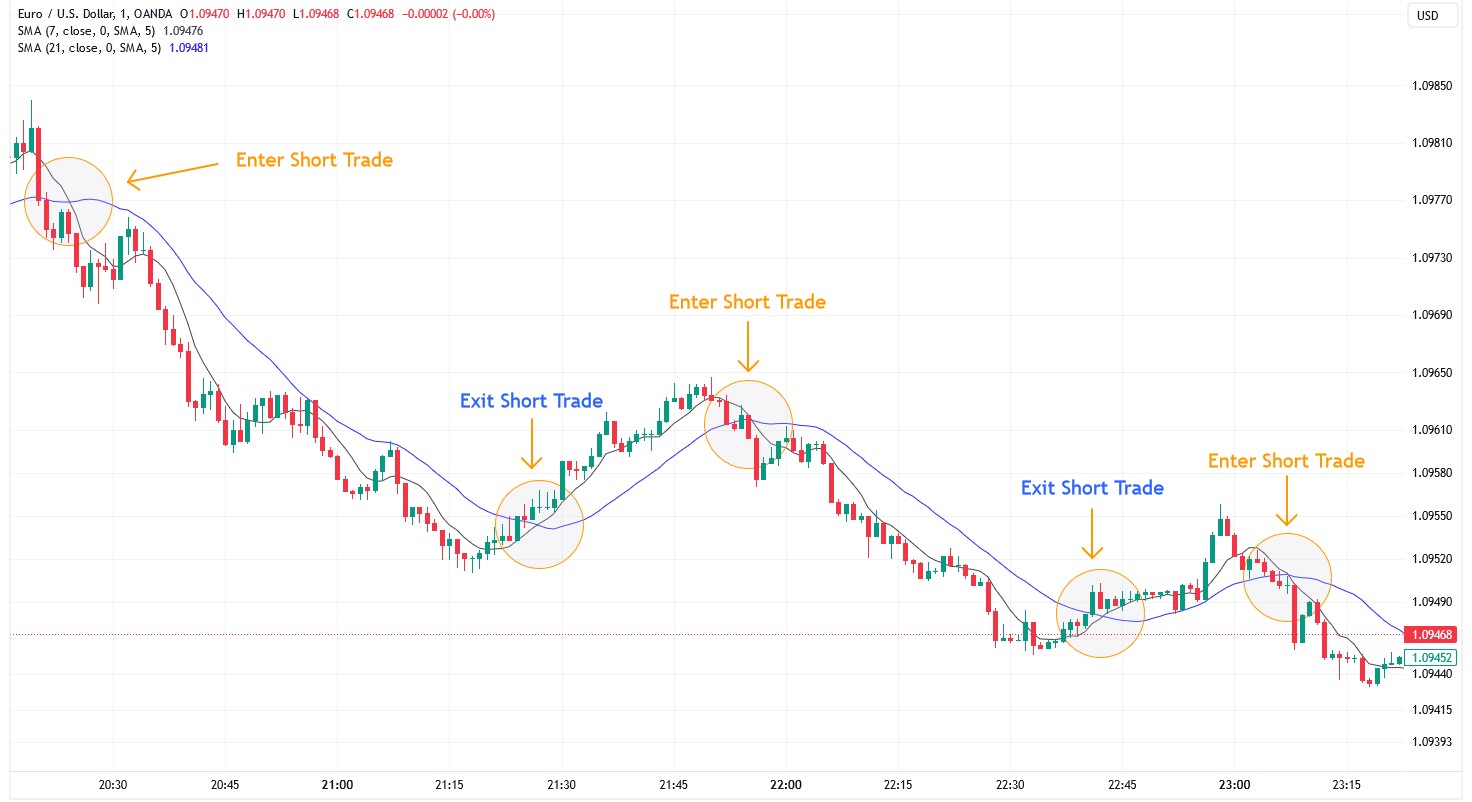
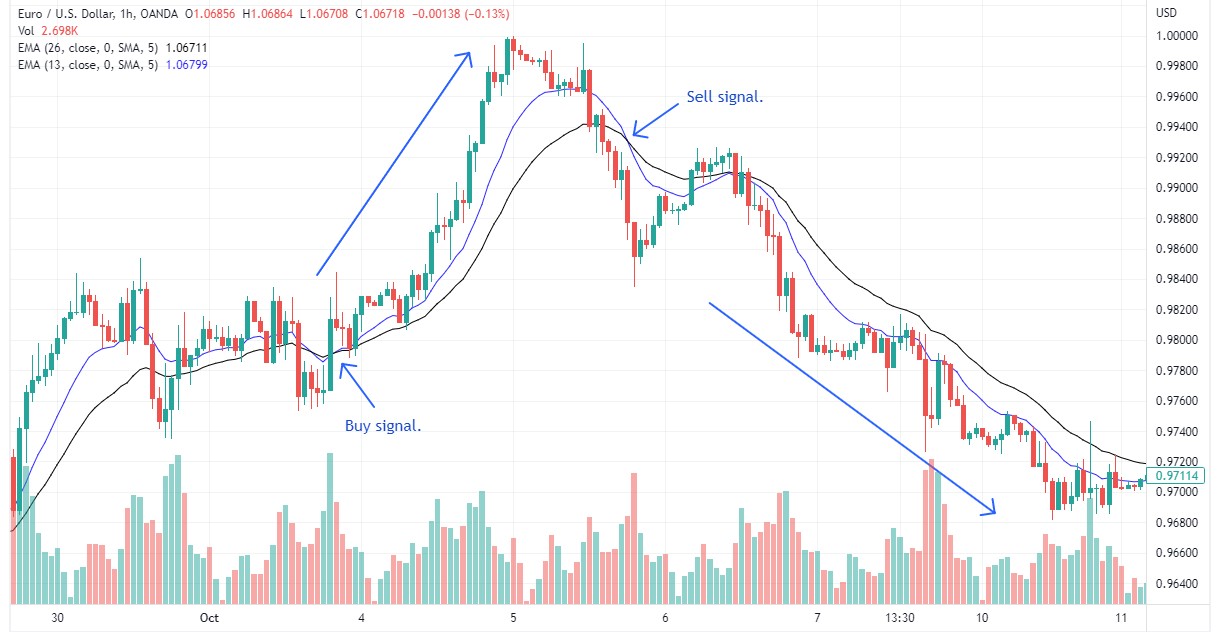
Crossover strategy
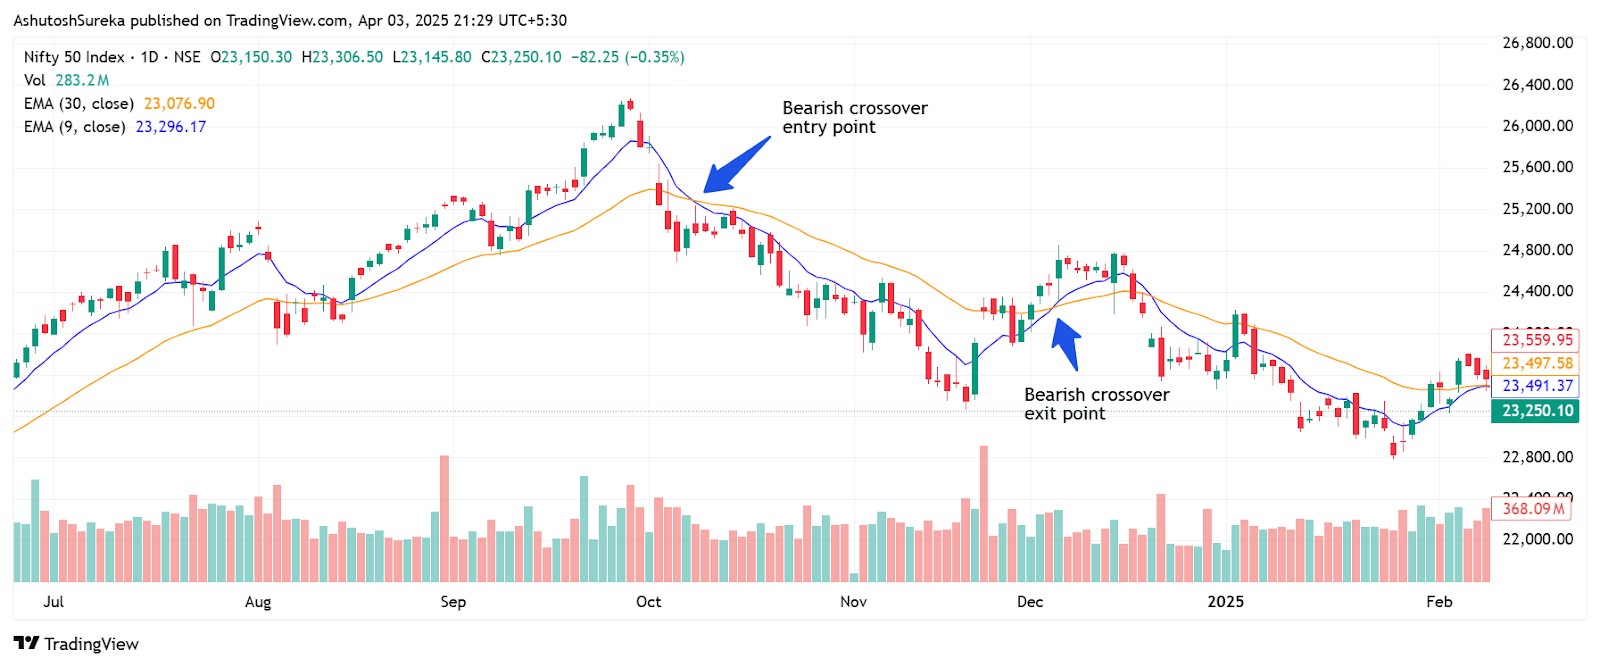
This is one of the most well-known ways to use moving averages. It involves watching for one average to cross over another — a signal that a trend may be starting or reversing.
How it works
Bullish signal. A short-term moving average crosses above a longer-term one.
Bearish signal. A short-term moving average crosses below a longer-term one.
Example setup
Use a 9 EMA and a 30 EMA.
Buy when the 9 EMA crosses above the 30 EMA.
Sell or short when it crosses below.
Why it works
Helps catch trend shifts without needing price patterns.
Simple to automate or backtest for consistency.
Trend filter strategy
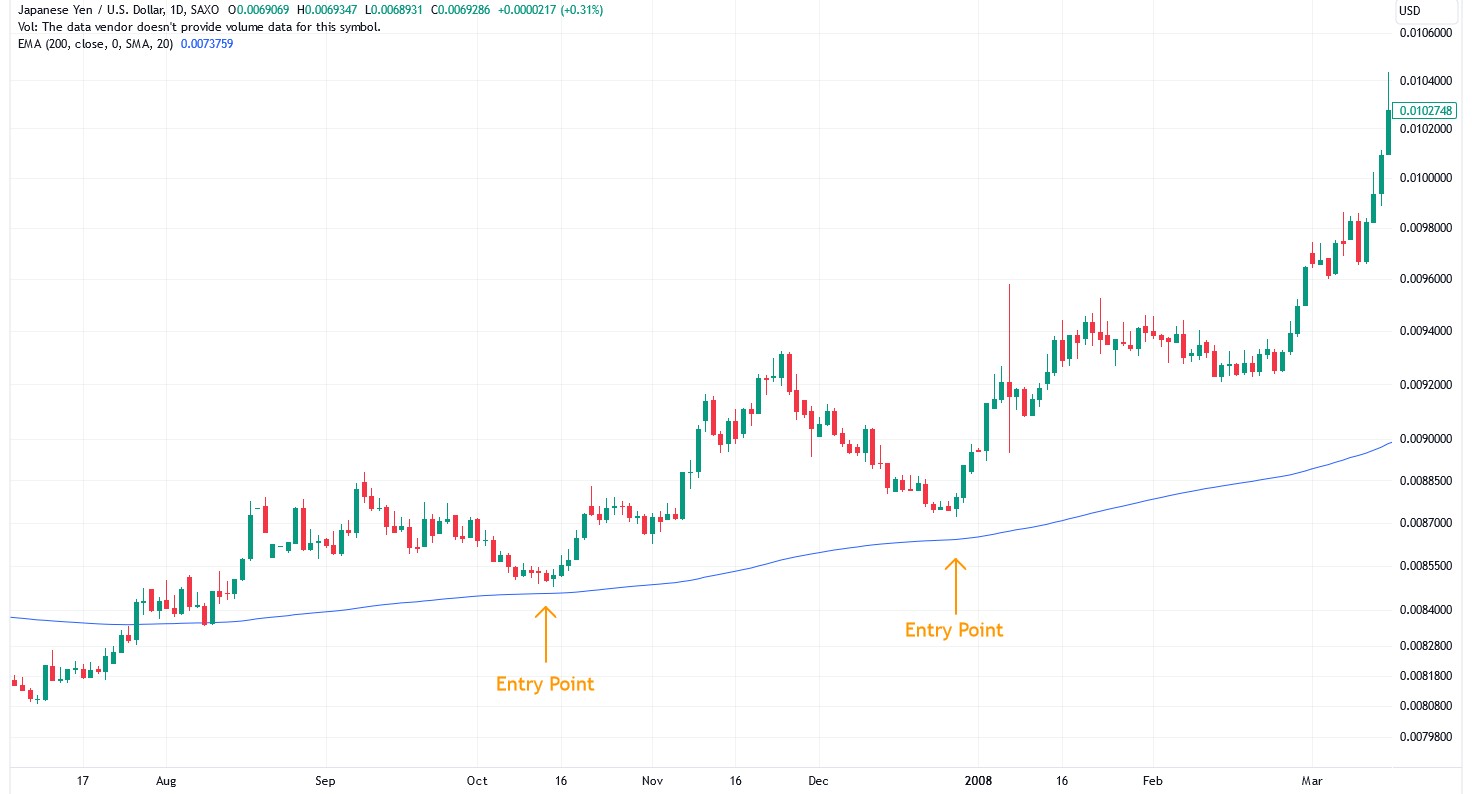
Moving averages can be used to filter trades so you only trade in the direction of the broader trend.
How it works
Add a long-term moving average like the 100 SMA or 200 SMA.
Only take buy trades when price is above the average.
Only take sell trades when price is below it.
Why traders use it
Reduces the chance of trading against the main trend.
Works well when combined with other setups like breakouts or candlestick patterns.
Dynamic support and resistance

Moving averages often act like support in uptrends or resistance in downtrends. This makes them useful for timing entries or exits around key areas.
How it works
In an uptrend, price often bounces from the 20 or 50 EMA.
In a downtrend, price may find resistance at those same levels.
Traders look for confirmation signals at those points to enter or add to positions.
If your trading strategy requires the use of many technical indicators, using a broker that supports TradingView, MT5, or cTrader can make your life easier. These tools provide access to a wide range of technical tools, covering almost all the strategies you can think of. In the table below, we have presented the top brokers with access to the abovementioned platforms. You can compare them and choose the best one for yourself:
| zForex | Plus500 | Trading.com USA | OANDA | FOREX.com | |
|---|---|---|---|---|---|
|
Tradable assets |
80 | 2800 | 69 | 129 | 5500 |
|
Min. deposit, $ |
10 | 100 | 50 | No | 100 |
|
Max. leverage |
1:1000 | 1:300 | 1:50 | 1:200 | 1:50 |
|
TradingView |
No | Yes | Yes | Yes | Yes |
|
MT5 |
Yes | No | Yes | Yes | Yes |
|
cTrader |
No | No | No | No | No |
|
TU overall score |
7.89 | 7.52 | 6.81 | 6.8 | 6.74 |
|
Open an account |
Go to broker Your capital is at risk.
|
Go to broker 80% of retail CFD accounts lose money. |
Go to broker Your capital is at risk. |
Go to broker Your capital is at risk. |
Study review |
Why trust us
15+ years of independent market analysis
140+ evaluation criteria, reviewed by 50+ experts
Data-driven reviews of 200+ platforms, updated regularly
20+ industry awards & a wide network of global media partners
Learn more about our methodology and editorial policies.


Advantages of moving averages
Moving averages are favored by traders of all levels because of their simplicity, reliability, and adaptability.
Make trends easier to see
Smooth out price action so you can focus on the big picture.
Help reduce noise from short-term price swings.
Make it easier to stay in a trade during a trending move.
Provide structure to trading
Can act as support or resistance levels.
Useful for setting trailing stops or spotting pullbacks.
Help traders build clear, rule-based systems.
Work across timeframes and assets
Can be used on any chart — from one minute to weekly.
Suitable for stocks, Forex, crypto, and commodities.
Easily adjusted for short-term or long-term strategies.
Combine well with other tools
Fit easily into momentum or volume-based setups.
Work well with price action patterns and breakout strategies.
Commonly used in crossover systems for entry and exit signals.
Limitations of moving averages
Despite their usefulness, moving averages are not perfect and should not be used in isolation.
Lag behind price
All moving averages are based on past data.
They respond slowly, especially during sudden reversals.
By the time the average changes direction, the move may already be underway.
Perform poorly in sideways markets
Can generate false signals when the market is flat or range-bound.
Crossovers and pullbacks may trigger entries that go nowhere.
May lead to frustration if used without a trend filter.
Depend on settings
The effectiveness changes based on the period chosen.
Shorter averages may react too quickly and give whipsaws.
Longer averages can be too slow and miss good entries.
Need confirmation
Moving averages alone do not confirm trend strength or momentum.
Best results come when paired with other indicators or price confirmation.
Should not be the only factor in a trading decision.
Use moving averages to gauge momentum, not trigger entries

One habit that will instantly change your view of moving averages is to stop using them for entries and start using them as areas where price tends to react. A rising 21 EMA is not an automatic buy. It is a place where buyers might support the move. Let the price come to it. If it bounces and volume picks up, that tells you buyers are still stepping up. But if it breaks through and stalls underneath, the trend is likely fading. The average itself does not create the move. It just shows where the fight is happening.
Here is a trick most traders never use. Put both a 20-period exponential and a 20-period simple on the same chart. They do not track the same way. When the EMA pulls away from the SMA, the market is speeding up. When they start pinching together, the move is slowing. You are not using them to enter. You are watching the space between them to feel how fast the market is moving. This keeps you from jumping into tired setups and helps you catch dips before the bounce actually comes.
Conclusion
The key takeaway from the Moving Averages Trading Strategy article is the transformative power of using moving averages as dynamic support and resistance levels rather than mere entry signals. This approach allows traders to adapt to changing market conditions, filtering out noise and identifying genuine price reversals. For example, a trader might observe how the 50-day moving average reliably acts as a support level in an uptrend, guiding more informed trade management decisions. Similarly, recognizing a moving average as resistance during a downtrend helps to avoid false breakouts. Ultimately, reimagining moving averages as flexible market barriers empowers traders to refine their strategies and stay ahead in volatile markets.
FAQs
What factors should be considered when choosing the period length for a moving average?
How do different types of moving averages impact trend analysis?
Can moving averages be effectively used on various asset classes beyond Forex?
What limitations should traders be aware of when interpreting moving average crossovers?
Editors' Top Picks and Insights

Brent nears $100: Why oil prices are rising

Gram Wallet launch: Can Telegram bring crypto to the masses?

AI without limits: How dangerous are neural networks?

Worldcoin on Wall Street: From iris scans to ETF

Mark Cuban's wealth philosophy: Why stocks matter more than salary or crypto

Dangerous but indispensable: Why the crypto market needs bridges
Related Articles
Team that worked on the article
Rinat Gismatullin is an entrepreneur and a business expert with 9 years of experience in trading. He focuses on long-term investing, but also uses intraday trading.
Dan Blystone began his trading career in 1998 as an arbitrage clerk on the floor of the Chicago Mercantile Exchange (CME). He later traded bond and Eurex futures at proprietary firms such as Altea Trading, gaining valuable experience in high-frequency trading and risk management.
Chinmay Soni is a financial analyst with more than 5 years of experience in working with stocks, Forex, derivatives, and other assets. As a founder of a boutique research firm and an active researcher, he covers various industries and fields, providing insights backed by statistical data.
Day trading involves buying and selling financial assets within the same trading day, with the goal of profiting from short-term price fluctuations, and positions are typically not held overnight.
Forex leverage is a tool enabling traders to control larger positions with a relatively small amount of capital, amplifying potential profits and losses based on the chosen leverage ratio.
Index in trading is the measure of the performance of a group of stocks, which can include the assets and securities in it.
Trend trading is a trading strategy where traders aim to profit from the directional movements of an asset's price over an extended period.
Copy trading is an investing tactic where traders replicate the trading strategies of more experienced traders, automatically mirroring their trades in their own accounts to potentially achieve similar results.

-
 Afghanistan
-
 Albania
-
 Algeria
-
 Angola
-
 Argentina
-
 Armenia
-
 Australia
-
 Austria
-
 Azerbaijan
-
 Bahamas
-
 Bahrain
-
 Bangladesh
-
 Belarus
-
 Belgium
-
 Bolivia
-
 Botswana
-
 Brazil
-
 Brunei
-
 Bulgaria
-
 Cambodia
-
 Cameroon
-
 Canada
-
 Chile
Chile
-
 China
China
-
 Colombia
-
 Congo
Congo
-
 Costa Rica
-
 Cote d'Ivoire
-
 Croatia
-
 Cuba
Cuba
-
 Cyprus
-
 Czechia
-
 DR Congo
-
 Denmark
-
 Dominican Republic
-
 Ecuador
-
 Egypt
Egypt
-
 El Salvador
-
 Estonia
-
 Eswatini
-
 Ethiopia
-
 Finland
-
 France
-
 Georgia
-
 Germany
-
 Ghana
Ghana
-
 Greece
-
 Haiti
Haiti
-
 Hong Kong
-
 Hungary
-
 India
India
-
 Indonesia
-
 Iran, Islamic republic
-
 Iraq
Iraq
-
 Ireland
-
 Israel
-
 Italy
Italy
-
 Jamaica
-
 Japan
Japan
-
 Jordan
-
 Kazakhstan
-
 Kenya
Kenya
-
 Korea
Korea
-
 Kuwait
-
 Kyrgyzstan
-
 Laos
Laos
-
 Latvia
-
 Lebanon
-
 Lesotho
-
 Libya
Libya
-
 Lithuania
-
 Luxembourg
-
 Madagascar
-
 Malaysia
-
 Malta
Malta
-
 Mauritius
-
 Mexico
-
 Moldova
-
 Mongolia
-
 Montenegro
-
 Morocco
-
 Mozambique
-
 Myanmar
-
 Namibia
-
 Nepal
Nepal
-
 Netherlands
-
 New Zealand
-
 Nigeria
-
 North Macedonia
-
 Norway
-
 Oman
Oman
-
 Pakistan
-
 Palestine
-
 Panama
-
 Papua New Guinea
-
 Paraguay
-
 Peru
Peru
-
 Philippines
-
 Poland
-
 Portugal
-
 Puerto Rico
-
 Qatar
Qatar
-
 Reunion
-
 Romania
-
 Rwanda
-
 Saudi Arabia
-
 Serbia
-
 Singapore
-
 Slovakia
-
 Slovenia
-
 Somalia
-
 South Africa
-
 Spain
Spain
-
 Sri Lanka
-
 Sweden
-
 Switzerland
-
 Syria
Syria
-
 Taiwan
-
 Tajikistan
-
 Tanzania
-
 Thailand
-
 Trinidad and Tobago
-
 Tunisia
-
 Turkey
-
 UAE
UAE
-
 Uganda
-
 Ukraine
-
 United Kingdom
-
United States
-
 Uruguay
-
 Uzbekistan
-
 Venezuela
-
 Vietnam
-
 Yemen
Yemen
-
 Zambia
-
 Zimbabwe
- Forex
- Crypto
