Best Moving Average Strategies
The best moving average strategies are:
- 1
The Single MA Cross – Based on interaction between price and a single moving average line.
- 2
The Double MA Cross – Based on interaction between two moving average lines.
- 3
The MACD Strategy – Based on signals generated by the MACD indicator.
- 4
The Envelope Strategy – Combines single MA cross with a confirmation band for more accurate signals.
- 5
The Ribbon Strategy – Combines three moving averages of varied periods for a holistic view of price movement.
In Forex trading, one of the most essential tools is the Moving Average (MA). In this review, the experts at TU explore the top 5 Forex Moving Average strategies, providing traders of all levels with a comprehensive understanding of how to use MAs for confident and informed decision-making in the fast-paced world of Forex trading.
Top 5 moving average strategies
Experts have identified the following to be the 5 best moving average strategies:
The Single MA Cross
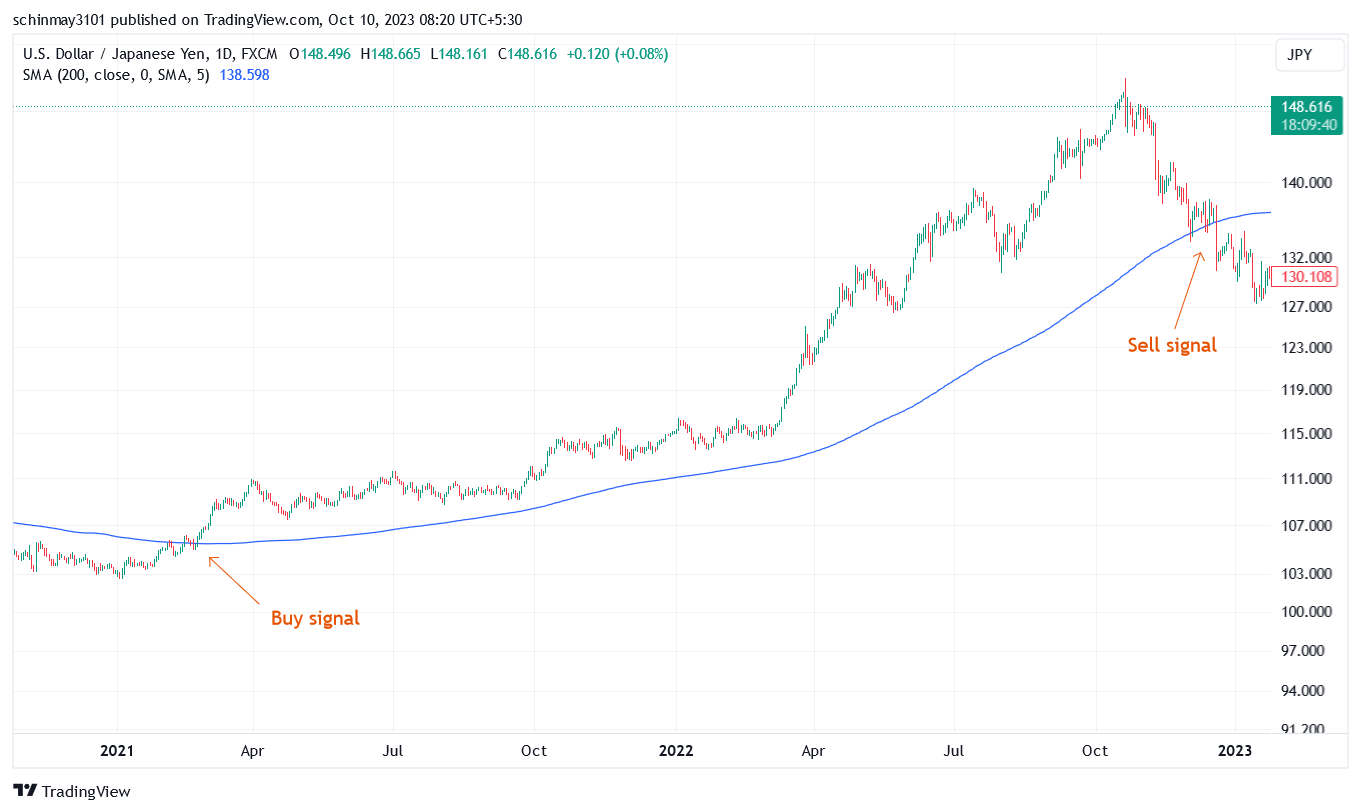
The Single MA Cross strategy
The Single MA Cross strategy is a straightforward yet effective approach for beginners in the Forex market. It harnesses the power of moving averages (MAs) to provide traders with visual cues and clear entry and exit points. To implement this strategy, traders select a single MA line and a specific time period, such as 10, 20, 50, 100, or 200 periods. This results in a single MA line displayed on the trading chart, alongside the current market price.
The key principle behind this strategy revolves around crossovers. When the current price of a Forex pair crosses the MA line from below, it triggers a bullish cross. This signals a potential buying opportunity as it suggests that the market is in an upward trend. Conversely, when the price crosses the MA line from above, it creates a bearish cross, indicating a potential selling opportunity as the market may be in a downward trend.
The Single MA Cross strategy offers simplicity and ease of use, making it accessible even to novice traders. However, it's important to note that this approach does not take into account broader market factors or current news events that can influence price movements. While it's a valuable tool for identifying trends, traders should complement it with other forms of analysis to make informed trading decisions.
The Double MA Cross
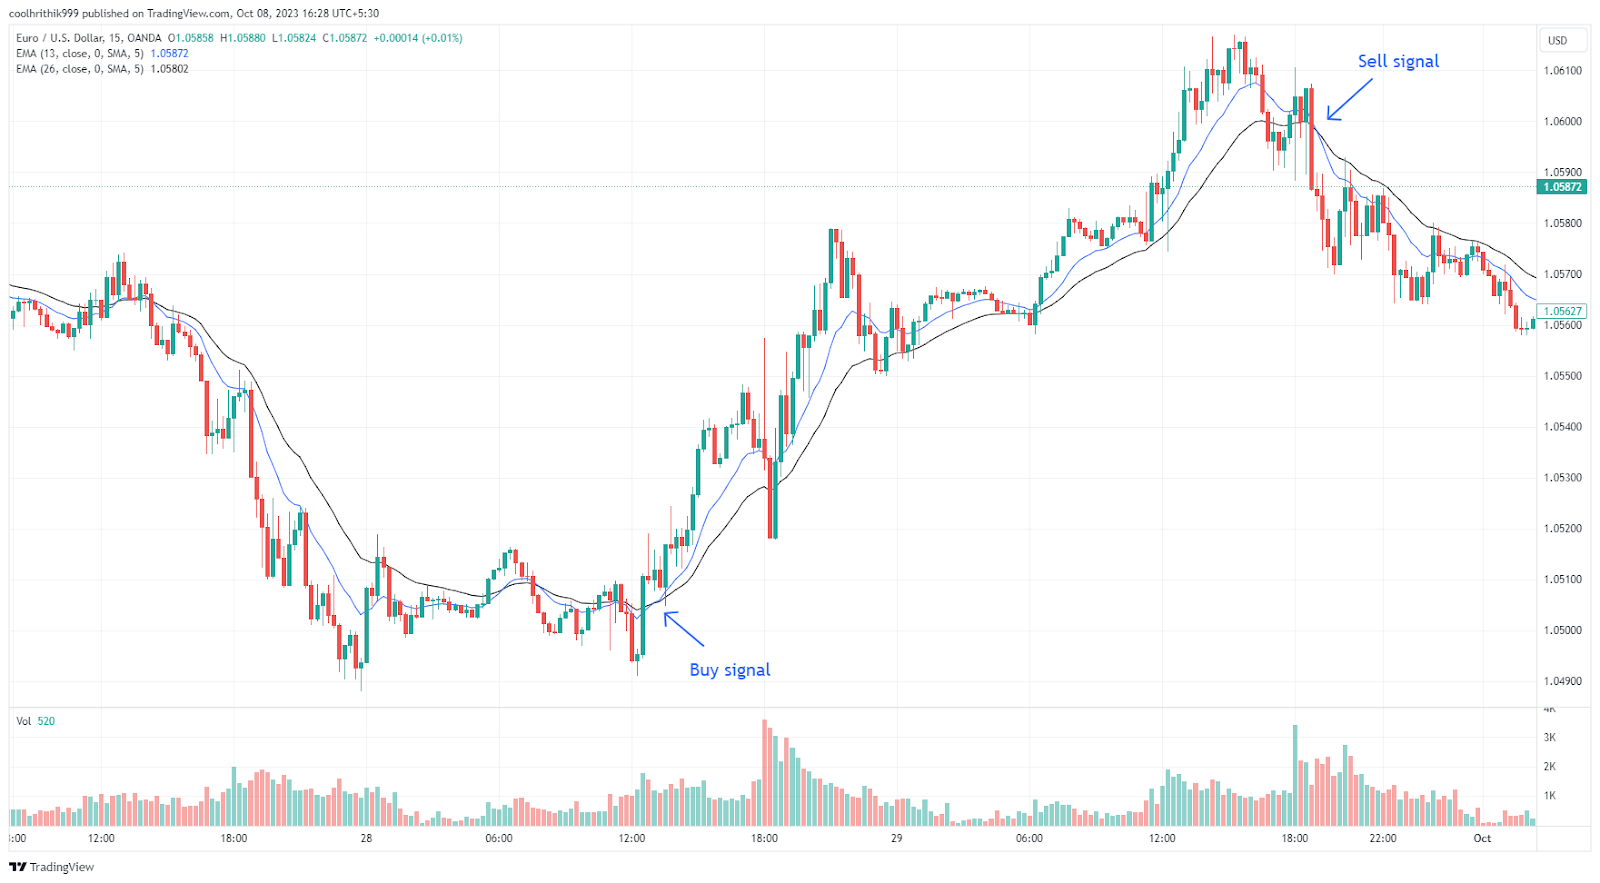
The Double MA Cross strategy
The Double MA Cross strategy is an extension of the Single MA Cross, designed to provide traders with a more comprehensive view of the market. It involves the use of two MA lines—one representing a longer time frame and the other a shorter time frame. By combining these two MAs, traders gain insights into both long-term and short-term price trends.
In this strategy, traders still focus on crossovers, but instead of comparing the price to a single MA, they monitor crossovers between the two MA lines. When the shorter MA crosses above the longer MA, it generates a “golden cross”, indicating a potential bullish trend. This serves as a signal to buy, as it suggests that short-term price movements are trending upwards. Conversely, when the shorter MA crosses below the longer MA, it creates a “death cross”, signaling a potential bearish trend and a selling opportunity.
The Double MA Cross strategy is particularly useful for traders seeking to factor in current events and market context that can impact short-term price fluctuations. It provides a more nuanced understanding of price movements and helps traders make informed decisions based on a combination of short-term and long-term trends. However, like any strategy, it has its limitations and should be used in conjunction with other analytical tools for a comprehensive trading approach.
The MACD Strategy
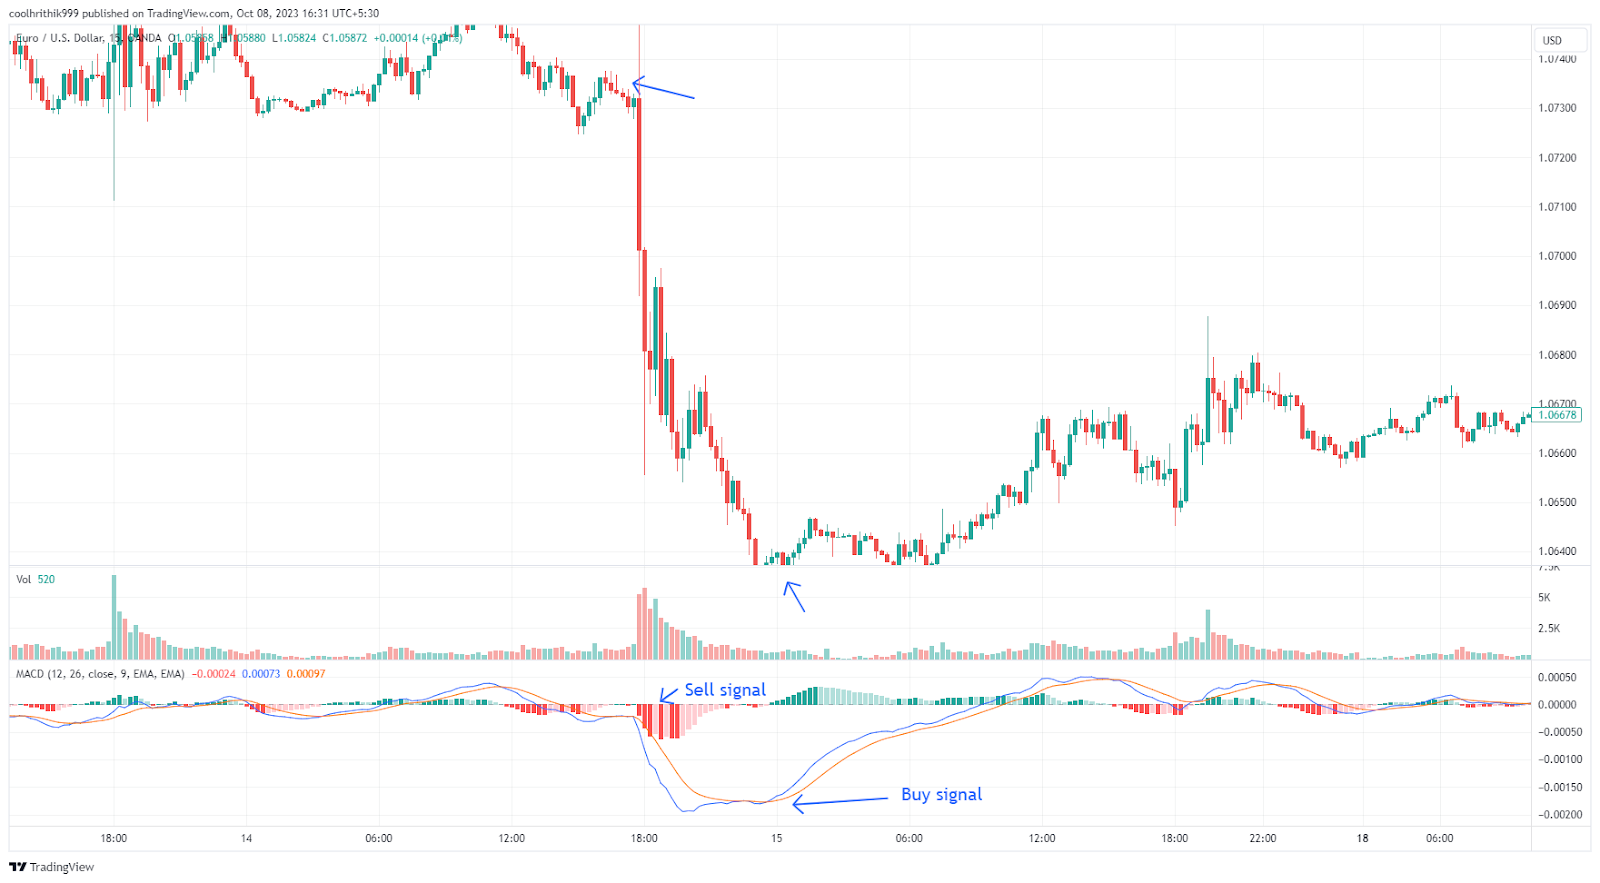
The MACD strategy
The Moving Average Convergence Divergence (MACD) strategy is a popular and versatile approach for trading MAs in the Forex market. The MACD is a momentum indicator that combines two Exponential Moving Averages (EMAs) and a histogram to help traders identify potential trend reversals and market momentum.
One of the key aspects of the MACD strategy is to look for instances of convergence and divergence between the two EMAs. Convergence occurs when the two EMA lines intersect, indicating a potential shift in market momentum. Conversely, divergence happens when the two EMA lines move away from each other, signaling strong momentum in the market.
Within the MACD strategy, traders can employ various techniques, including the crossover strategy. This approach is similar to the Single MA Cross strategy, where traders buy when the shorter MACD line crosses above the longer signal line, creating a bullish cross. This suggests a potential bullish trend and a buying opportunity. Conversely, when the MACD line crosses below the signal line, forming a bearish cross, it indicates a potential bearish trend and a selling opportunity.
The MACD strategy provides traders with flexibility and a deeper understanding of market momentum. It can be customized to suit different trading styles and time frames. However, it's important to note that the MACD is just one tool in a trader's toolbox, and it should be used in conjunction with other forms of analysis to make well-rounded trading decisions. Traders should also be aware of the limitations and potential false signals that can occur with any strategy.
The Envelope Strategy
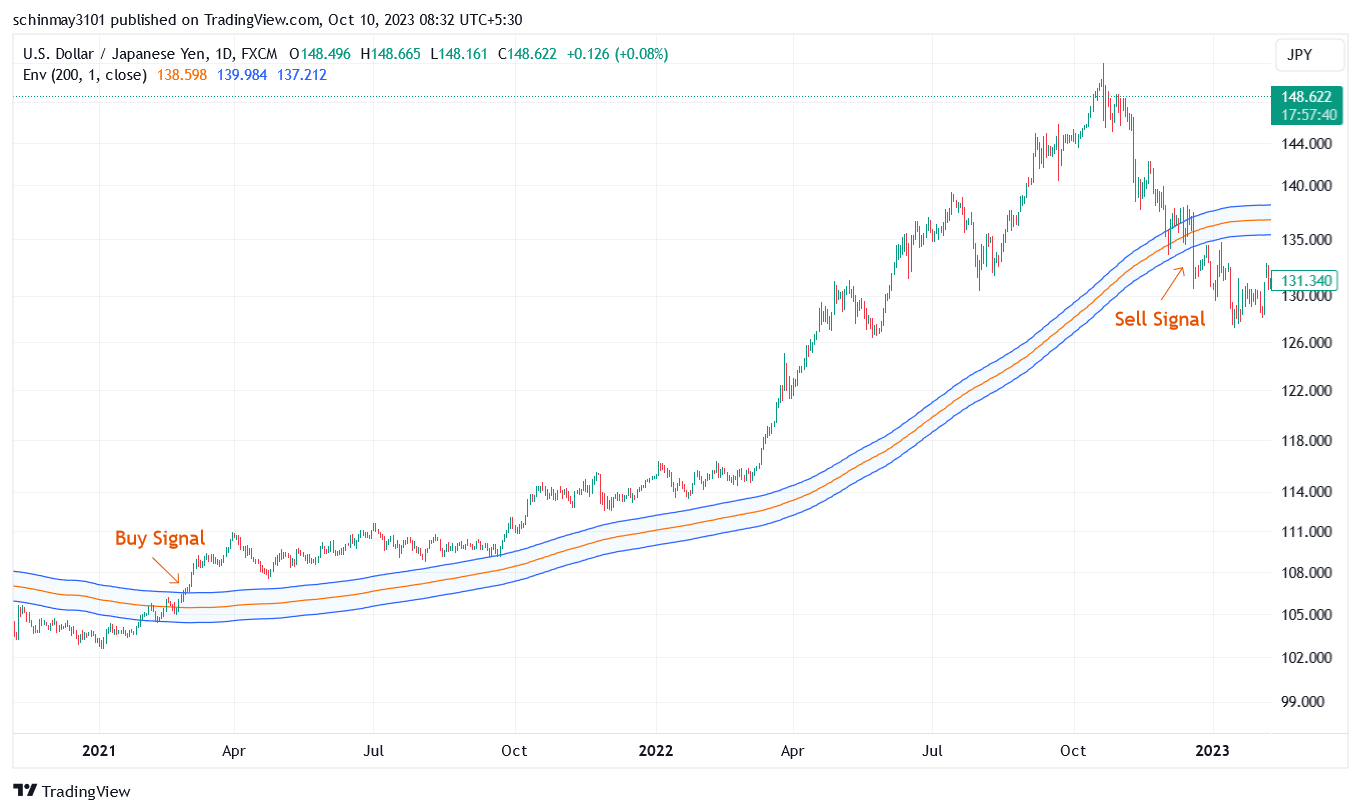
The Envelope strategy
The Envelope strategy is designed to address the challenge of false signals by introducing additional bands or "filters" around the Moving Average (MA) line. With this approach, traders add two filters at calculated levels above and below the MA line, typically at percentages like 1% or 5%. These filters create supplementary support and resistance lines that the current price must break through, providing insight into the strength and longevity of a trend.
In the Envelope strategy, traders often wait for a bullish or golden cross to occur only if the price also crosses above the upper filter line of the MA. Conversely, for a bearish cross, they look for the price to cross beneath the lower filter line. This strategy helps traders make more informed decisions by adding a layer of confirmation to their trading signals, reducing the impact of sudden trend reversals.
The Ribbon Strategy
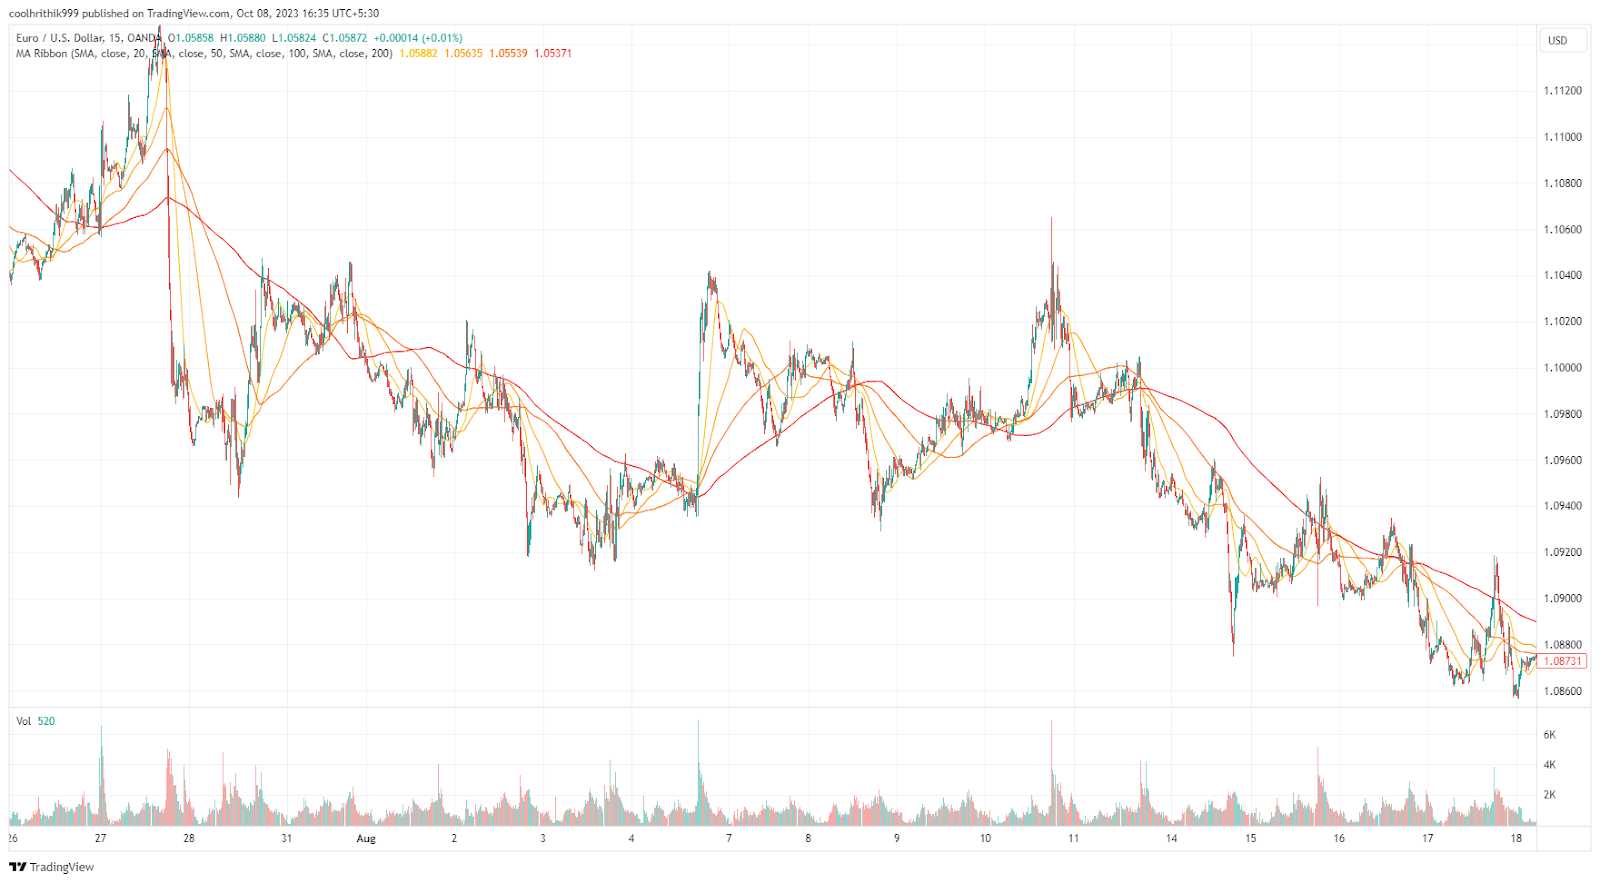
The Ribbon strategy
For traders seeking a more comprehensive view of market trends, the Ribbon strategy is an excellent option. It involves plotting multiple Exponential Moving Average (EMA) or Simple Moving Average (SMA) lines, typically around ten, with varying time frames on the same chart. This arrangement creates a ribbon-like chart that offers valuable insights into trend strength and potential longevity.
The Ribbon strategy is particularly useful when using EMAs, as it provides a clear visualization of how different MA lines of varying periods react to price movements. For instance, while shorter-term EMAs may signal the beginning of a trend, the longer-term lines can confirm or cast doubt on its sustainability. Traders have the flexibility to customize their ribbon by choosing the number of MA lines and whether to use SMAs or EMAs.
However, it's worth noting that the Ribbon strategy can generate a high number of crossovers, especially with multiple lines, which may be overwhelming for inexperienced traders. Despite this complexity, it can be a powerful tool for those who want a deeper understanding of market dynamics.
Trading with moving averages pros and cons
The experts have delved into the merits and drawbacks of incorporating moving averages into your trading strategy:
👍 Pros:
•Smoothing the price
Moving averages offer a smoothed-out portrayal of a currency’s historical price movement, shedding light on its trajectory over time. This smoothing effect contributes to a clearer understanding of past price trends.
•Predictive strategy
These averages serve as insightful crystal balls, peering into the future potential of a stock's price movement. By discerning patterns, they aid traders in forecasting likely directions before they manifest.
•Eliminating the noise
Market turbulence can cause high price fluctuations. Moving averages act as noise-cancelling headphones, enabling investors to filter out the daily market commotion and concentrate on more substantial trends.
•Trend identification
They act as trusty guides, pointing out trends and potential zones of support or resistance. This guidance is invaluable for traders seeking profitable entry and exit points.
•User-friendly
The beauty of moving averages lies in their simplicity. They are accessible tools for traders of all levels of expertise.
👎 Cons
•Lagging indicator
Moving averages trail behind the current price, making them lagging indicators. This means the information they provide reflects past events rather than current market dynamics.
•Not reliant on fundamentals
Moving averages solely rely on historical price data, overlooking shifts in fundamental factors that can profoundly influence a security's future performance. They're like historians who miss the breaking news.
•Vulnerability to volatility
In the face of wildly fluctuating securities, moving averages may lose some of their effectiveness. The jagged nature of volatile assets can make trend identification less reliable.
How to set up a MA for different trading strategies
Setting up moving averages (MAs) is a pivotal task for traders, especially those pursuing different trading strategies like day trading and swing trading. Here's a breakdown of how to tailor MAs to various trading styles.
For day traders
Day traders operate on a fast-paced battlefield, demanding moving average indicators that swiftly respond to price gyrations. Since they execute trades within short timeframes, MAs need to keep pace. If you’re day trading with moving averages, don’t just focus on the crossover itself — pay close attention to the angle of the slope before entering a trade.
9 or 10 period
These ultra-short MAs react promptly to rapid price changes, aligning with the high-speed world of day trading. However, these are vulnerable to noisy movements to a large extent.
21 period
Slightly longer but still agile, the 21-period MA helps capture short-term trends while filtering out some of the noise.
50 period
A more stable option within the day trader's toolkit, the 50-period MA offers a broader perspective on price movements.
For swing traders
Swing traders march to a different beat, focusing on more extended periods and smoother trends. Simple Moving Averages (SMA) shine in this domain, minimizing premature signals and market noise. Consider these moving average options:
20/21 period
This relatively short SMA suits swing traders seeking moderate-term trends. It balances responsiveness with stability.
50 period
A favorite among swing traders, the 50-period SMA provides a broader outlook, helping capture more extended swings in the market.
100 period
For those who prefer even lengthier trends, the 100-period SMA offers a slower, yet more encompassing view of price movements.
200/500 period
Reserved for the patient swing traders, these long-period SMAs serve as anchors, tracking substantial trends over extended timeframes.
How to use moving average with other indicators
Leveraging moving averages alongside various technical indicators and analytical methods can empower traders to make well-informed decisions. Here's a breakdown of how moving averages can confluence with other tools.
Moving Averages and trendlines
When you couple moving averages with trendlines, a clearer picture of potential support and resistance zones emerges. If the price soars above the moving average while the trendline slopes upward, it's often a signal of a bullish trend. Conversely, if the price plunges below the moving average while the trendline slants downward, it may indicate a bearish trend is in play.
Moving averages and bollinger bands
Bollinger Bands, renowned for measuring volatility, consist of a moving average flanked by two standard deviation bands. Using moving averages with Bollinger Bands can uncover breakout opportunities and trend reversals. When the price cozies up to the upper Bollinger Band while the moving average climbs, it often points to a bullish trend. On the flip side, when the price hovers near the lower Bollinger Band while the moving average descends, it may foreshadow a bearish trend.
Moving averages and relative strength index (RSI)
The RSI, a momentum gauge, assesses the strength of a security's price action. Integrating moving averages with RSI can be done to spot potential overbought and oversold conditions. When the price surges above the moving average and the RSI touches 70, it often signifies an overbought scenario. Conversely, when the price dips below the moving average and the RSI drops below 30, it may hint at an oversold condition.
How to use MAs correctly?
Using moving averages effectively can significantly enhance a trader's toolkit. Here are key pointers on how to wield moving averages correctly.
Spotting the trend
Moving averages excel at trend identification. When the price trajectory rests above the moving average, it often signals a bullish trend. Conversely, when prices dip below the moving average, it frequently indicates a bearish trend may be underway.
Use multiple time frames
To solidify your grasp on the prevailing trend and pinpoint potential trade opportunities, consider employing various time frames. A more extended moving average can help define the overall trend, while a shorter one aids in identifying optimal entry and exit points.
Use with other indicators
Maximizing moving averages involves coupling them with other technical indicators and analysis methods. For instance, teaming up moving averages with tools like trendlines, Bollinger Bands, RSI, and MACD can unveil critical support and resistance zones, predict trend reversals, and pinpoint shifts in market momentum.
Choosing the right MA
Know your moving averages. Generally, Simple Moving Averages (SMA) and Exponential Moving Averages (EMA) would be at your disposal. SMAs sum up closing prices over a specific duration and divide by the number of periods, while EMAs assign more weight to recent prices. Opting for SMA or EMA hinges on your trading style and the market conditions you navigate.
Time frame
The effectiveness of moving averages is intrinsically linked to the chosen time frame. Common moving average periods include 10, 20, 50, 100, and 200. Tailor your selection to align with your trading horizon, as these periods can be applied across various chart time frames.
Best Forex brokers 2024


FAQs
What is the best moving average strategy in Forex?
The best moving average strategy in Forex can vary depending on your trading style and goals. However, the simple moving average (SMA) crossover strategy, which involves using two different SMAs (e.g., 50-period and 200-period) to identify trend changes, is popular among traders.
What is the most successful moving average strategy?
The most successful moving average strategy often involves combining multiple indicators and factors. The moving average convergence divergence (MACD) strategy is highly regarded, as it combines moving averages with momentum analysis, helping traders identify both trends and potential reversals.
What are the most important moving averages in Forex?
The most important moving averages in Forex include the 50-period and 200-period simple moving averages (SMA). The 50-period SMA is often used to gauge short-term trends, while the 200-period SMA is valuable for identifying long-term trends and potential support or resistance levels.
What are the 4 moving average strategies?
Four common moving average strategies in Forex include
Simple Moving Average (SMA) crossover – Using two different SMAs (e.g., 50-period and 200-period) to identify trend changes.
Exponential Moving Average (EMA) crossover – Similar to SMA crossover but with EMAs, which assign more weight to recent prices.
Moving Average Convergence Divergence (MACD) – Combines multiple EMAs and a histogram to analyze both trends and momentum.
Envelope strategy – Adds bands above and below a moving average to identify potential support and resistance levels in volatile markets.
Glossary for novice traders
-
1
Deviation
The deviation is a statistical measure of how much a set of data varies from the mean or average value. In forex trading, this measure is often calculated using standard deviation that helps traders in assessing the degree of variability or volatility in currency price movements.
-
2
Margin Call
A margin call is a demand made by a broker or a financial institution to a trader or investor who is using margin (borrowed funds) to cover potential losses in a trading account. It occurs when the value of the securities or assets held in the account falls below a certain threshold, known as the maintenance margin or margin requirement, as specified by the broker.
-
3
Index
Index in trading is the measure of the performance of a group of stocks, which can include the assets and securities in it.
-
4
Bollinger Bands
Bollinger Bands (BBands) are a technical analysis tool that consists of three lines: a middle moving average and two outer bands that are typically set at a standard deviation away from the moving average. These bands help traders visualize potential price volatility and identify overbought or oversold conditions in the market.
-
5
Forex Trading
Forex trading, short for foreign exchange trading, is the practice of buying and selling currencies in the global foreign exchange market with the aim of profiting from fluctuations in exchange rates. Traders speculate on whether one currency will rise or fall in value relative to another currency and make trading decisions accordingly. However, beware that trading carries risks, and you can lose your whole capital.
Related Articles


Team that worked on the article

Chinmay Soni is a financial analyst with more than 5 years of experience in working with stocks, Forex, derivatives, and other assets. As a founder of a boutique research firm and an active researcher, he covers various industries and fields, providing insights backed by statistical data. He is also an educator in the field of finance and technology.
As an author for Traders Union, he contributes his deep analytical insights on various topics, taking into account various aspects.

Dr. BJ Johnson is a PhD in English Language and an editor with over 15 years of experience. He earned his degree in English Language in the U.S and the UK. In 2020, Dr. Johnson joined the Traders Union team. Since then, he has created over 100 exclusive articles and edited over 300 articles of other authors.

Mirjan Hipolito is a journalist and news editor at Traders Union. She is an expert crypto writer with five years of experience in the financial markets. Her specialties are daily market news, price predictions, and Initial Coin Offerings (ICO).
