What is Deviation in Forex?


Editorial Note: While we adhere to strict Editorial Integrity, this post may contain references to products from our partners. Here's an explanation for How We Make Money. None of the data and information on this webpage constitutes investment advice according to our Disclaimer.
Deviation in Forex denotes the variance between anticipated and actual price shifts. Traders use it to refine their entry, exit, and risk management tactics.
In Forex trading, deviation stands as a crucial metric that helps in statistically measuring the ever-fluctuating market. This measure of volatility is a valuable tool for traders, providing a means to gauge and respond to the unpredictability of events in the foreign exchange market.
By understanding what deviation is and how to use it effectively, you can unlock opportunities to make well-timed entrances and exits, all while meticulously managing risk. In the following discussion, we'll delve into the concept of deviation in forex and explore how it can be used practically in Forex trading.
What is deviation?
The deviation is a statistical measure of how much a set of data varies from the mean or average value. In forex trading, this measure is often calculated using standard deviation that helps traders in assessing the degree of variability or volatility in currency price movements.
Understanding deviation is crucial as it assists in gauging the market uncertainty and being clear regarding entry and exit points with effective risk management.
What is standard deviation in Forex?
In the context of forex trading, deviation refers to the extent of variance between expected and actual price movements in the currency market. It quantifies the degree to which an asset's price fluctuates from its average over a specific period.
The formula for standard deviation in forex is as follows:
Standard Deviation = √Σ [(X - μ)² / N]
Where:
X represents individual data points (price values)
μ (mu) is the mean (average) of the data
N is the total number of data points
A higher standard deviation indicates greater price variability and risk. It can be applied to various timeframes, from short-term intraday trading to long-term investment analysis.
What is an example of a deviation in Forex?
Let’s understand an example of deviation in forex using the Bollinger Bands indicator, and the Deviation indicator in Metatrader 4.
While using the Bollinger Bands indicator with the "Deviation" setting in the MetaTrader platform, a deviation refers to the number of standard deviations used to calculate the width of the Bollinger Bands.
Bollinger Bands consist of three lines: a middle line (usually a 20-period simple moving average), an upper band, and a lower band. The upper and lower bands are calculated based on the standard deviation of price data.
Here are the basics to interpret the deviation in forex using Bollinger Bands and the Deviation indicator in MetaTrader:
Select the Bollinger Bands Indicator - In MetaTrader, you can add the Bollinger Bands indicator to your Forex chart by selecting it from the list of available indicators
Set the Deviation - When you add the Bollinger Bands indicator, you'll have the option to specify the deviation. Deviation is a parameter that determines the width of the bands. A common value for deviation is 2.0. This means that the upper and lower bands will be drawn two standard deviations away from the middle (20-period SMA) line
Interpreting the Deviation - A deviation of 2.0 standard deviations implies that the Bollinger Bands will encompass approximately 95% of price data within their width. In simple words, when the price approaches or touches the upper band, it's considered relatively overbought, and when it approaches or touches the lower band, it's considered relatively oversold
 Metatrader platform
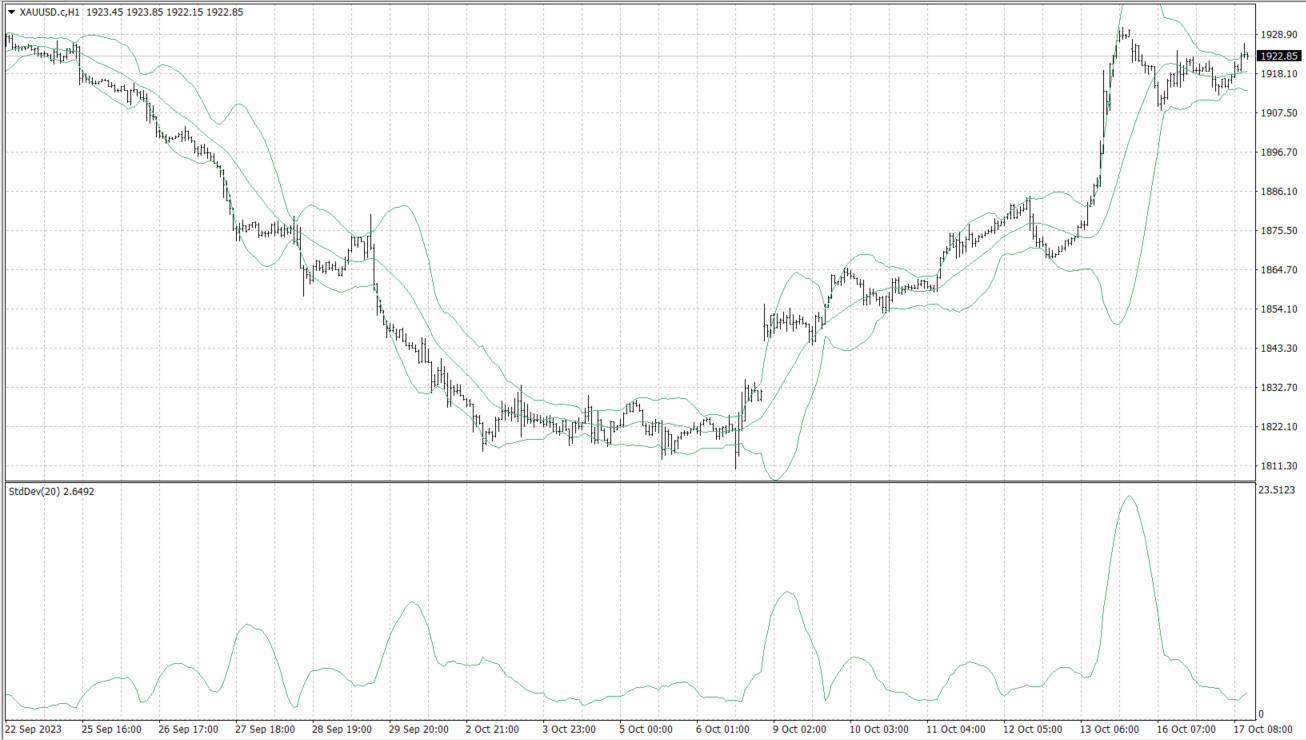
Now that the basics are given, let’s try to interpret this deviation in the above-given forex chart:
Here you have XAU/USD displayed on your MetaTrader chart with Bollinger Bands set to a 17-period SMA and a deviation of 2.6492. If the price of XAU/USD moves to the upper Bollinger Band, it suggests that the currency pair is relatively overextended, and there might be a potential for a reversal or retracement.
If the price touches the lower Bollinger Band, it means the currency pair is relatively oversold, and there might be a potential for a price bounce or reversal to the upside.
Here’s a more detailed article for you on What are Bollinger Bands & How they work.
How to use deviation in Forex?
Identifying Trading Opportunities
Deviation can help traders assess the level of price volatility in the forex market and as mentioned earlier, you can use the deviation setting when applying Bollinger Bands to identify potential entry and exit points. It also assists you with mean reversion strategiesManaging Risk
Deviation can be used to manage risks by adjusting the size of trading positions. In more volatile conditions (higher deviation), smaller positions might be preferred to manage risk. Conversely, in less volatile conditions (lower deviation), larger positions might be considered.Timing Market Entries and Exits:
a. Breakout trading - Deviation can help identify potential breakout points. When the price moves beyond the Bollinger Bands (indicating higher-than-average deviation), it may signal the start of a new trend or a significant price movement, which can be used for entries and exits
b. Reversal trading - Deviation can assist in spotting reversal opportunities. When the price reaches the extreme levels of the Bollinger Bands (high or low deviation), you can consider this as a potential reversal point and plan their entry or exit accordinglyConfirmation of Other Technical Analysis
If a trader identifies a trend reversal pattern or a key support/resistance level and sees that the deviation also indicates overbought or oversold conditions, it can add confidenceRisk Management and Trading Psychology
Understanding deviation and its impact on volatility can help in maintaining discipline and emotional control
Best Forex brokers
Selecting a broker plays an important role in how effectively deviation can be applied in practice. Execution speed, spread stability, and platform reliability directly influence how accurately traders can respond to changes in volatility. In fast-moving conditions, even small delays or slippage can distort outcomes.
From a practical standpoint, traders should consider brokers that provide consistent execution, transparent pricing, and stable platform performance across different market conditions. These factors become especially relevant when trading strategies rely on volatility-based signals and precise entry or exit timing.
The table below compares selected Forex brokers based on key parameters that affect execution quality and overall trading conditions.
| zForex | Plus500 | Trading.com USA | OANDA | FOREX.com | |
|---|---|---|---|---|---|
|
Min. deposit, $ |
10 | 100 | 50 | No | 100 |
|
Tradable assets |
80 | 2800 | 69 | 129 | 5500 |
|
Standard EUR/USD spread |
0.3 | 0.7 | 1.1 | 0.3 | 1.0 |
|
Max. leverage |
1:1000 | 1:300 | 1:50 | 1:200 | 1:50 |
|
Max. Regulation Level |
Not regulated | Tier-1 | Tier-1 | Tier-1 | Tier-1 |
|
TU overall score |
7.89 | 7.52 | 6.81 | 6.8 | 6.74 |
|
Open an account |
Go to broker Your capital is at risk.
|
Go to broker 80% of retail CFD accounts lose money. |
Go to broker Your capital is at risk. |
Go to broker Your capital is at risk. |
Study review |
How deviation affects real trading decisions

In my experience, many traders understand deviation as a concept but fail to apply it in real trading conditions. The key mistake is treating volatility as background noise rather than a core variable that should shape position sizing and timing. Markets do not behave consistently across sessions or conditions, and deviation reflects that shift directly.
I recommend using deviation as a filter before entering any trade. If volatility is elevated, reducing position size and widening stop-loss levels helps maintain stability. In low-deviation environments, forcing trades often leads to poor outcomes due to weak price movement. Consistency comes from adapting to volatility, not ignoring it.
Conclusion
Mastering deviation in Forex is essential for any trader seeking to navigate the market’s inherent volatility with precision. By interpreting standard deviation—such as through indicators like Bollinger Bands—traders can not only identify optimal entry and exit points but also tailor their risk management to prevailing market conditions. For example, increasing deviation signals heightened volatility, prompting cautious position sizing, while low deviation warns against overtrading in stagnant markets. The real edge comes from not just knowing what deviation is, but consistently making it the cornerstone of all trading decisions. Ultimately, those who adapt their strategies to volatility, rather than ignoring it, achieve lasting consistency and success in Forex trading.
FAQs
How does deviation influence the choice of trading strategy in Forex?
What are common mistakes traders make when using deviation in Forex trading?
Can deviation be used together with other technical indicators for better results?
How should position size and stop-loss levels be adjusted based on deviation?
Editors' Top Picks and Insights

Hunting crypto owners: Why criminals have gone offline

BitMEX is shutting down: Why Trump could not save the exchange

Do governments need crypto workers?

Brent nears $100: Why oil prices are rising

Gram Wallet launch: Can Telegram bring crypto to the masses?

AI without limits: How dangerous are neural networks?
Related Articles
Team that worked on the article
Upendra Goswami is a full-time digital content creator, marketer, and active investor. As a creator, he loves writing about online trading, blockchain, cryptocurrency, and stock trading.
Dr. BJ Johnson is a PhD in English Language and an editor with over 15 years of experience. He earned his degree in English Language in the U.S and the UK.
Mirjan Hipolito is a journalist and news editor at Traders Union. She is an expert crypto writer with five years of experience in the financial markets.
Copy trading is an investing tactic where traders replicate the trading strategies of more experienced traders, automatically mirroring their trades in their own accounts to potentially achieve similar results.
Cryptocurrency is a type of digital or virtual currency that relies on cryptography for security. Unlike traditional currencies issued by governments (fiat currencies), cryptocurrencies operate on decentralized networks, typically based on blockchain technology.
An investor is an individual, who invests money in an asset with the expectation that its value would appreciate in the future. The asset can be anything, including a bond, debenture, mutual fund, equity, gold, silver, exchange-traded funds (ETFs), and real-estate property.
CFD is a contract between an investor/trader and seller that demonstrates that the trader will need to pay the price difference between the current value of the asset and its value at the time of contract to the seller.
Volatility refers to the degree of variation or fluctuation in the price or value of a financial asset, such as stocks, bonds, or cryptocurrencies, over a period of time. Higher volatility indicates that an asset's price is experiencing more significant and rapid price swings, while lower volatility suggests relatively stable and gradual price movements.

-
 Afghanistan
-
 Albania
-
 Algeria
-
 Angola
-
 Argentina
-
 Armenia
-
 Australia
-
 Austria
-
 Azerbaijan
-
 Bahamas
-
 Bahrain
-
 Bangladesh
-
 Belarus
-
 Belgium
-
 Bolivia
-
 Botswana
-
 Brazil
-
 Brunei
-
 Bulgaria
-
 Cambodia
-
 Cameroon
-
 Canada
-
 Chile
Chile
-
 China
China
-
 Colombia
-
 Congo
Congo
-
 Costa Rica
-
 Cote d'Ivoire
-
 Croatia
-
 Cuba
Cuba
-
 Cyprus
-
 Czechia
-
 DR Congo
-
 Denmark
-
 Dominican Republic
-
 Ecuador
-
 Egypt
Egypt
-
 El Salvador
-
 Estonia
-
 Eswatini
-
 Ethiopia
-
 Finland
-
 France
-
 Georgia
-
 Germany
-
 Ghana
Ghana
-
 Greece
-
 Haiti
Haiti
-
 Hong Kong
-
 Hungary
-
 India
India
-
 Indonesia
-
 Iran, Islamic republic
-
 Iraq
Iraq
-
 Ireland
-
 Israel
-
 Italy
Italy
-
 Jamaica
-
 Japan
Japan
-
 Jordan
-
 Kazakhstan
-
 Kenya
Kenya
-
 Korea
Korea
-
 Kuwait
-
 Kyrgyzstan
-
 Laos
Laos
-
 Latvia
-
 Lebanon
-
 Lesotho
-
 Libya
Libya
-
 Lithuania
-
 Luxembourg
-
 Madagascar
-
 Malaysia
-
 Malta
Malta
-
 Mauritius
-
 Mexico
-
 Moldova
-
 Mongolia
-
 Montenegro
-
 Morocco
-
 Mozambique
-
 Myanmar
-
 Namibia
-
 Nepal
Nepal
-
 Netherlands
-
 New Zealand
-
 Nigeria
-
 North Macedonia
-
 Norway
-
 Oman
Oman
-
 Pakistan
-
 Palestine
-
 Panama
-
 Papua New Guinea
-
 Paraguay
-
 Peru
Peru
-
 Philippines
-
 Poland
-
 Portugal
-
 Puerto Rico
-
 Qatar
Qatar
-
 Reunion
-
 Romania
-
 Rwanda
-
 Saudi Arabia
-
 Serbia
-
 Singapore
-
 Slovakia
-
 Slovenia
-
 Somalia
-
 South Africa
-
 Spain
Spain
-
 Sri Lanka
-
 Sweden
-
 Switzerland
-
 Syria
Syria
-
 Taiwan
-
 Tajikistan
-
 Tanzania
-
 Thailand
-
 Trinidad and Tobago
-
 Tunisia
-
 Turkey
-
 UAE
UAE
-
 Uganda
-
 Ukraine
-
 United Kingdom
-
United States
-
 Uruguay
-
 Uzbekistan
-
 Venezuela
-
 Vietnam
-
 Yemen
Yemen
-
 Zambia
-
 Zimbabwe
- Forex
- Crypto
