The 7 Best Trend Reversal Indicators for Day Trading


Editorial Note: While we adhere to strict Editorial Integrity, this post may contain references to products from our partners. Here's an explanation for How We Make Money. None of the data and information on this webpage constitutes investment advice according to our Disclaimer.
Best Reversal Indicators And Patterns:
- RSI - is an oscillator for determining overbought and oversold areas of an asset.
- Fibonacci levels - mark the levels of resistance and support.
- Bollinger Bands - is a channel indicator that shows the degree of price deviation from its average value.
- MACD - is an oscillator in the form of a histogram showing the activity of buyers or sellers.
- Alligator - is a trend indicator based on moving averages.
Finding reversals in the financial markets can be highly profitable for traders. While trends do not move in one direction indefinitely, successfully identifying turning points requires skill and experience. This article explores some of the most effective indicators, tools and patterns for spotting potential trend reversals. We will outline 7 of the best reversal indicators used by both beginners and advanced traders alike. Key oscillators like RSI, Stochastic, and MACD that can signal overbought or oversold conditions will be discussed. In addition, popular candlestick patterns such as pin bars, double tops/bottoms and head and shoulders formations that often precede reversals will also be covered. We’ll provide readers with a comprehensive overview of the signals and frameworks that can help identify high probability reversal opportunities across different timeframes. With practice, these strategies may help any trader capture bigger moves in changing markets.
Best reversal indicators for beginners
For a reversal indicator to be certain, it should give off signals without lags and redrawing.
Here is a review of the top 7 reversal indicators
1. RSI
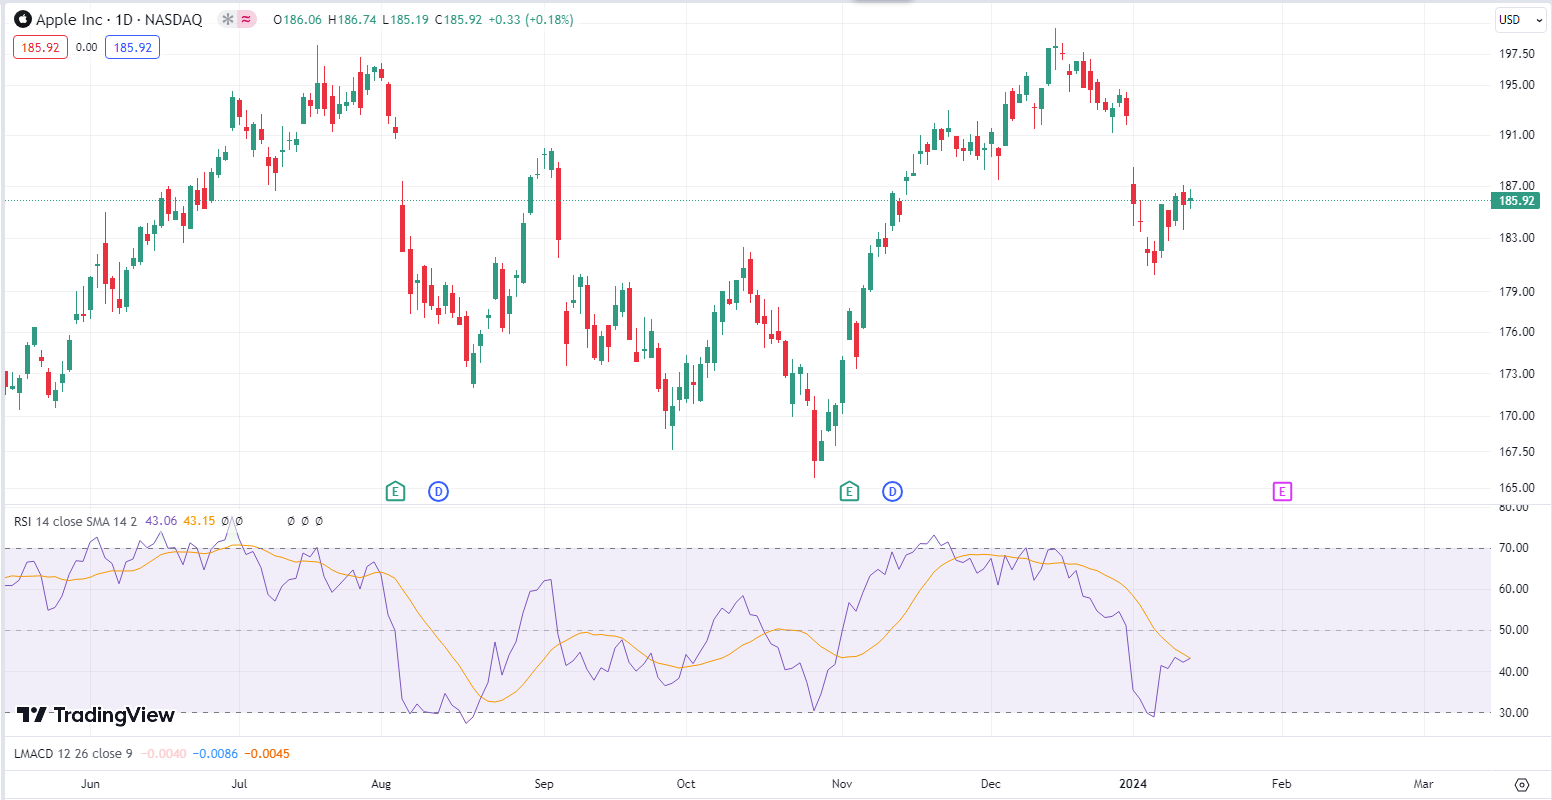
RSI is short for Relative Strength Index (RSI). This is a popular technical indicator used for day trading. It is an oscillator that shows you a currency that has a high buying or high selling frequency. The RSI works by measuring the ratio of up-to-down moves and expressing it in a range of 0-100.
An RSI of 70 and above will indicate an overbought (price has risen more than market expectation) currency, while an RSI of 30 and below will indicate an oversold (price has fallen below market expectation) currency.
In addition to overbought and oversold signals, traders also watch the RSI for potential divergences between the indicator and price action. A bullish divergence forms when the price records a lower low but the RSI forms a higher low. This shows momentum is increasing despite lower prices and can foreshadow a potential bullish reversal. A bearish divergence occurs when the price makes a higher high but the RSI makes a lower high. This indicates waning upside momentum which could lead to a bearish reversal.
Watching for these RSI divergences can help traders spot potential trend reversals before they occur on the price chart itself. However, it's important to wait for confirmation from the price action before acting on divergences, as they can sometimes be misleading. Divergences between momentum oscillators like RSI and price are among the key signals trend traders watch for to anticipate potential changes in direction.
- Pros
- Cons
- It can be easily understood and implemented.
- It is a leading indicator that will help you find key indicators.
- You can track momentum loss using RSI
- It is more functional in non-trending zones
- In trending zones, RSIs provide false signals
- During key reversal levels, the volume is completely ignored.
 RSI
RSI2. Stochastic Oscillator
 Stochastic Oscillator
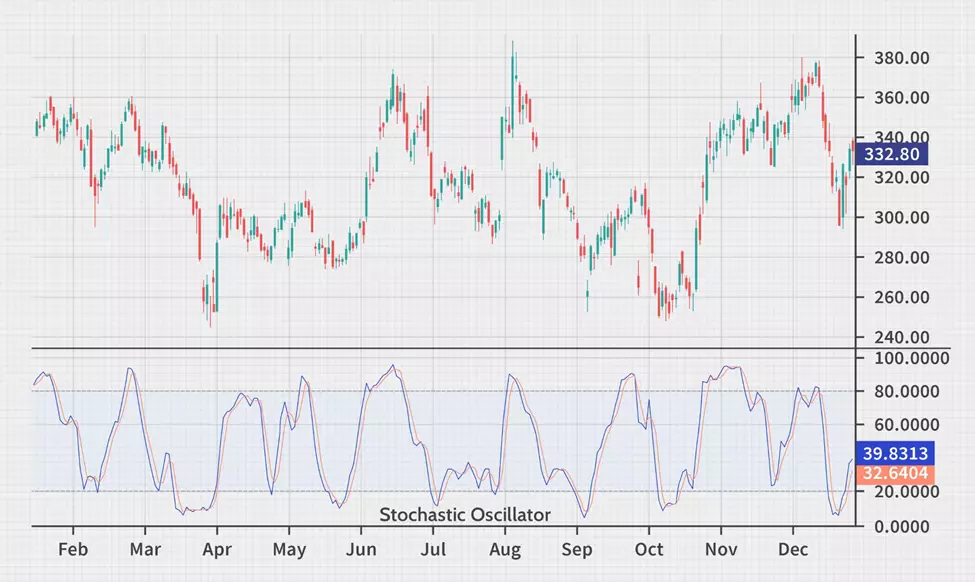
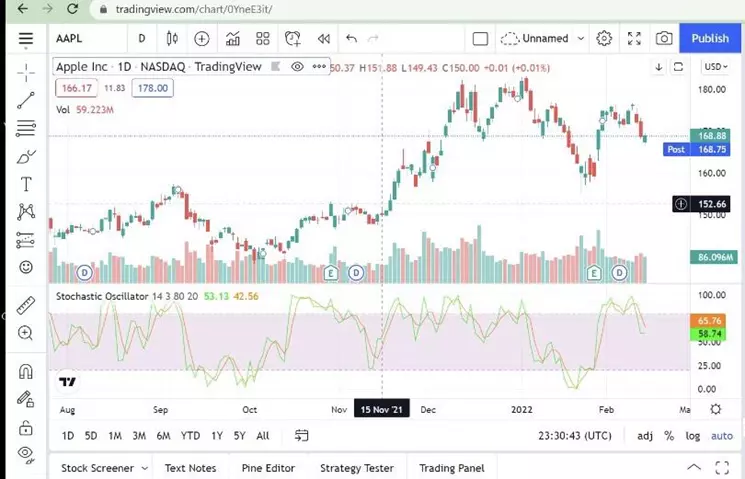
The main function of this tool is finding overbought and oversold currencies. It compares a particular closing price to the range of all its prices over time. A unique feature of this tool is that it follows the momentum of the price. Therefore, analysts use it to gauge momentum based on the price history. It is efficient for showing reversal points.
- Pros
- Cons
- Frequent availability of signals
- Ease of understanding
- Entry and exit signals are very clear
- False signals sometimes appear when it is used incorrectly
- If the trade is done against the trend, prices can stay in the overbought/oversold zone for a long time.
 Stochastic Oscillator
3. Fibonacci Retracement Levels
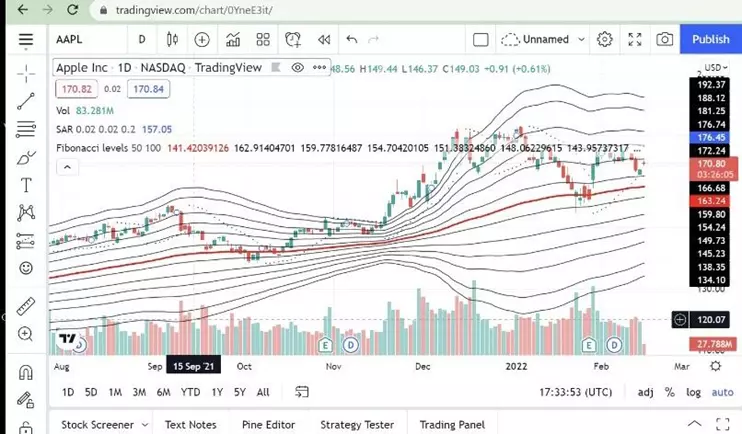
 Fibonacci Retracement Levels
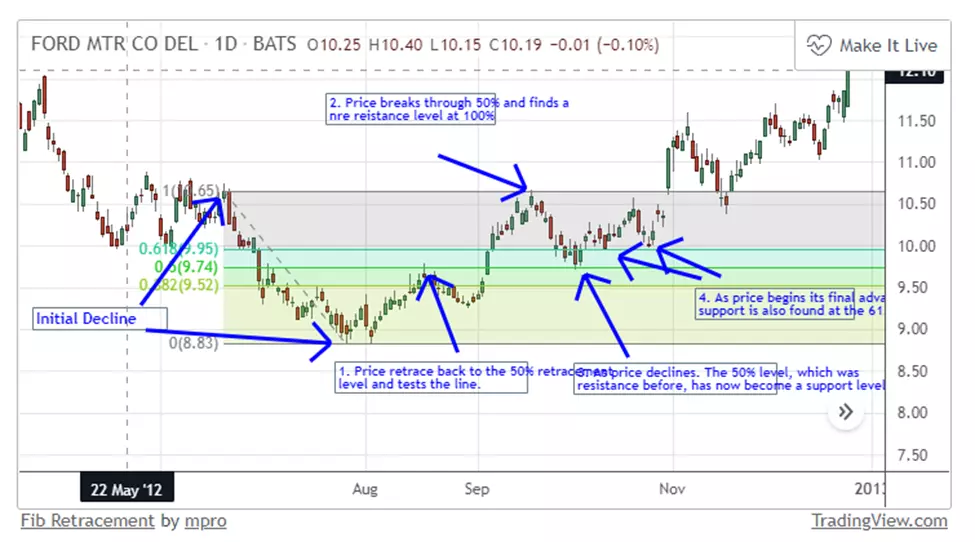
This indicates where support (a price level that an asset does not fall below for a long time) and resistance (where an asset’s price meets resistance while trying to go up, following the increasing number of sellers looking to sell at that price). It can be used to set a target price, determine the stop-loss level, and place entry orders.
- Pros
- Cons
- It is beginner-friendly
- It has been in use for a long time, so it has a lot of helpful resources online.
- Using only Fib levels can reduce the accuracy of your trades.
 Fibonacci Retracement Levels
4. Bollinger bands
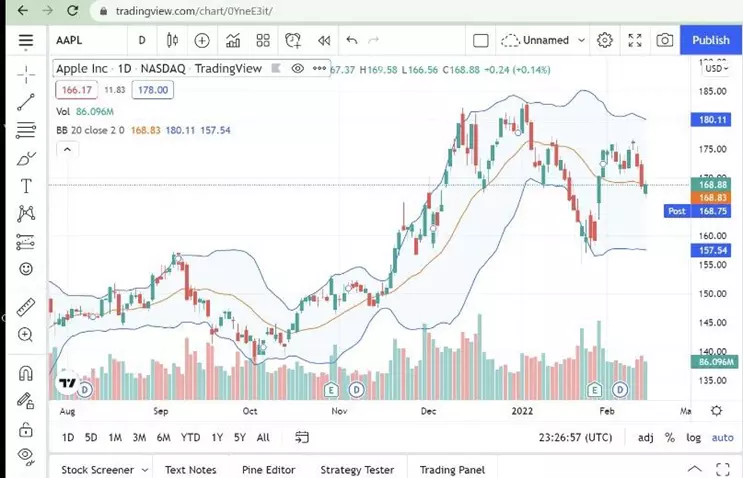
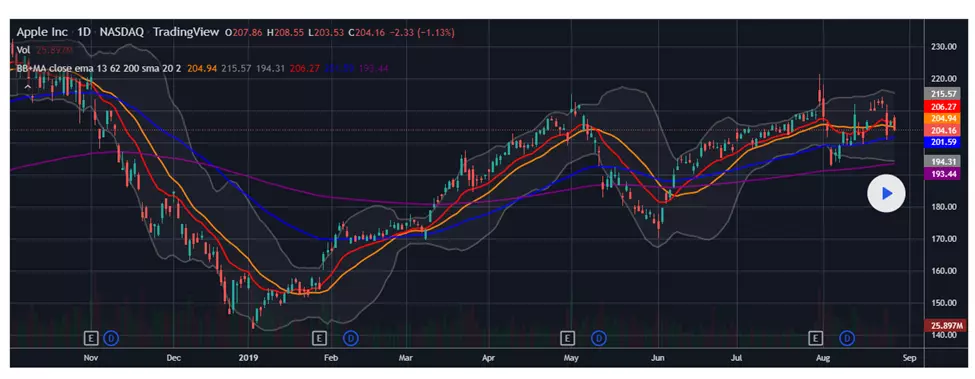 Bollinger bands
This is another technical indicator used to indicate trends. They have a unique application in detailed findings of all of the price data between two bands. They are used to determine the entry and exit points of a trade. They are also used to determine overbought and oversold levels.
- Pros
- Cons
- It is a very simple trading tool
- Trading with only this band can be risky because it considers only price and volatility
 Bollinger bands
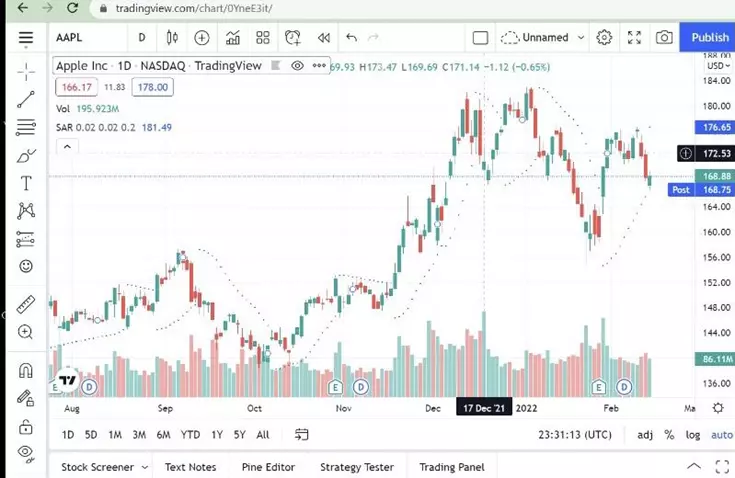
5. Parabolic SAR
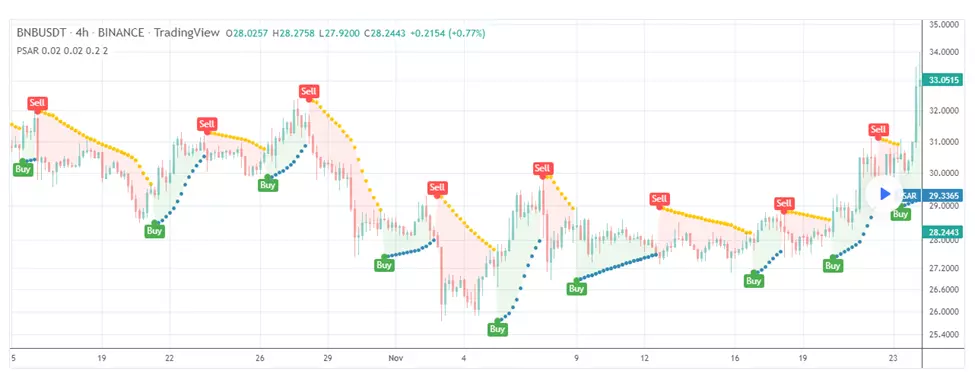 Parabolic SAR
This indicates trend directions and reversal points. This gives traders an added advantage of highlighting the direction of movement of an asset. It uses the Stop and Reverse (SAR) trail method to find entry and exit points. It appears as a series of dots either above or below the price of the asset.
- Pros
- Cons
- It keeps traders in the trending move, by consistently highlighting a trend.
- When there is a sideways market condition, the analytic insights it provides are not very clear.
 Parabolic SAR
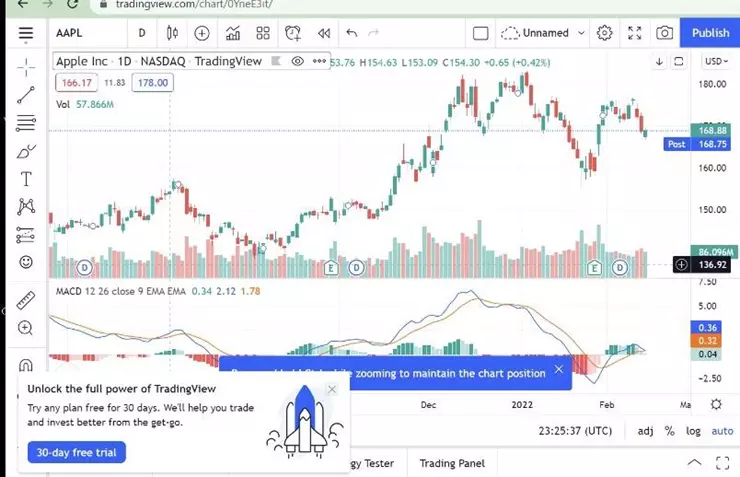
6. MACD
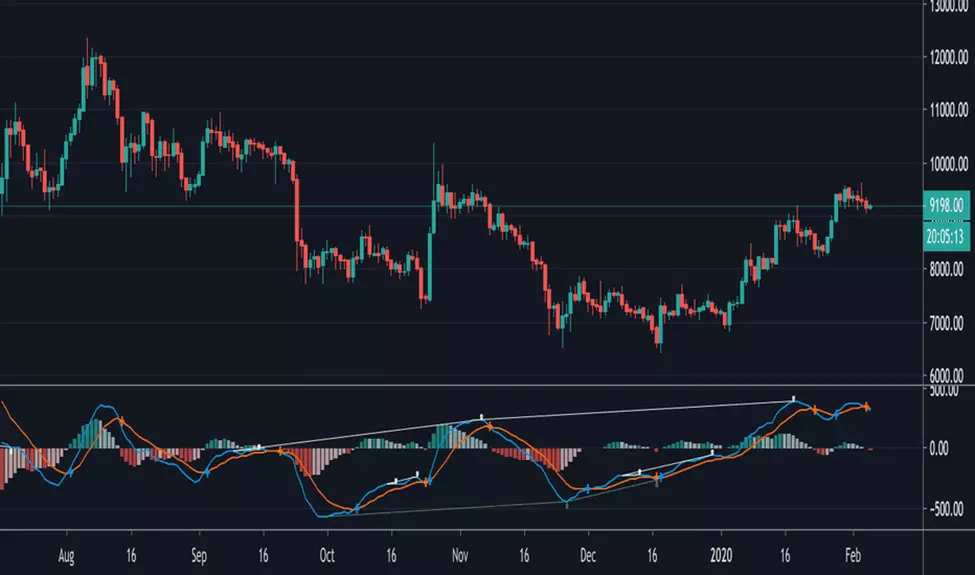 MACD
MACDThis is short for Moving Average Convergence and Divergence. This oscillator is formed from two moving averages. It is used for both trend indication and reversals.
- Pros
- Cons
- It can be used for both momentum and trend indication.
- The buy and sell signals it provides are very clear.
- It provides false reversals sometimes.
- The trend analysis it gives is not always accurate.
 MACD
MACD7. Alligator
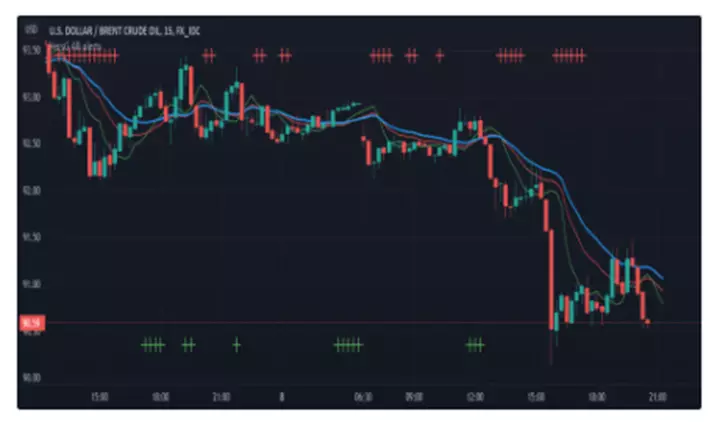 Alligator
This indicator uses smoothed moving averages. It builds trading signals using convergence-divergence relationships.
- Pros
- Cons
- It gives a clear indication of the market state
- It indicates support and resistance levels.
- It is not reliable enough to stand alone when making trading decisions.
- Different timeframes will require different parameters, therefore adjustments should be made.
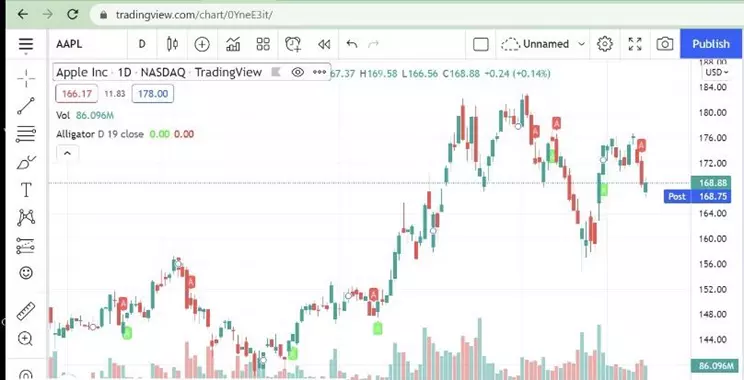 Alligator
What are the cheapest brokers for active trading?
We compared three brokers offering ECN/Raw spread accounts. Generally, these are the most cost-effective options for active trading using technical analysis.
| zForex | OANDA | FOREX.com | Venom by Cobra Trading | IG Markets | |
|---|---|---|---|---|---|
|
Min. deposit, $ |
10 | No | 100 | 5000 | 1 |
|
ECN Commission |
7 | 3.5 | 5 | 1.5 | 2.3 |
|
ECN Spread EUR/USD |
0.1 | 0.15 | 0.2 | 0.1 | 0.8 |
|
ECN Spread GBP/USD |
0.15 | 0.2 | 0.4 | 0.1 | 1 |
|
Max. Regulation Level |
Not regulated | Tier-1 | Tier-1 | Tier-1 | Tier-1 |
|
TU overall score |
7.89 | 6.8 | 6.74 | 6.66 | 6.65 |
|
Open an account |
Go to broker Your capital is at risk.
|
Go to broker Your capital is at risk. |
Study review | Study review | Study review |
Top 5 reversal patterns for beginners
Technical Analysis includes graphical analysis. To effectively build a trading system, technical indicators should be combined with patterns.
Pattern - a distinctive formation created by the movement of security prices on a chart.
A pattern can be a continuation or a reversal. Continuations indicate that traders should continue a trend while reversals indicate a stock that will not continue a trend.
Patterns are core parts of technical analysis. They tell traders the next profitable action to take. Traders believe that patterns work because when an experienced trader experiences a popular pattern in a market, other experienced traders would likely also see the pattern and delve into it, thereby making it a profitable move.
Here are some of the best reversal patterns for beginners in the trading system;
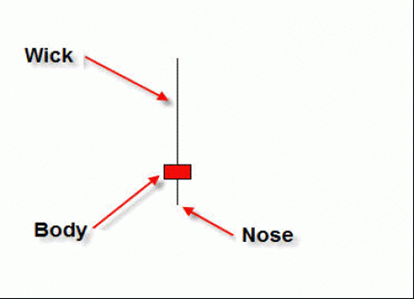
Pin bar:
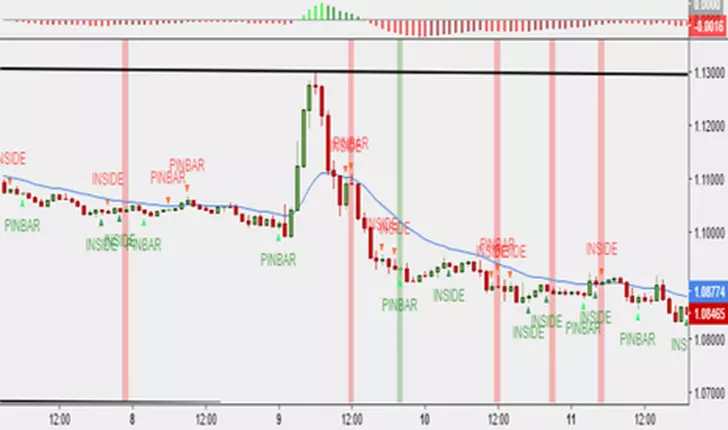 Pin Bar
Pin bars have very long wicks, consume more than two-thirds of the entire candle length, and they have small bodies. They are reversal candlesticks that show that the price action has been rejected in a market.
The pin bar trading strategy is very successful when the pin bar formation breaks through a key resistance or support price at the point when it is close to perfection just before it is rejected.
A pin bar can be bullish (showing a likely increase in the price) or it can be bearish (showing a likely decline in the price). Pin bars are some of the most versatile patterns. Pin bars can be traded profitably in three ways;
Alone
At Fibannoci retracement levels
At significant levels of support and resistance.
 Pin Bar
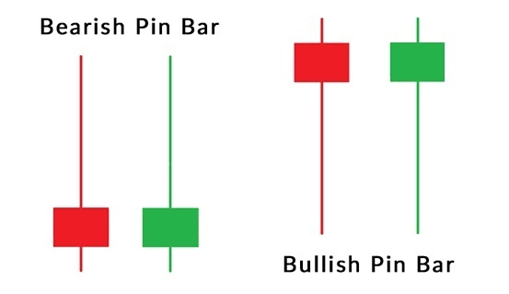 Pin Bar
Shooting star:
 Shooting Star
This is a bearish reversal pattern that has just one candle. This star is formed when the price is increased and immediately rejected, mimicking the action of an actual shooting star. This leaves behind a long wick to the upside. This pattern is very beginner-friendly. With the pattern described above, traders can easily spot a shooting star.
Bullish and Bearish engulfing:
 Bullish and Bearish engulfing
These are two powerful reversal patterns. The bullish pattern looks like this;
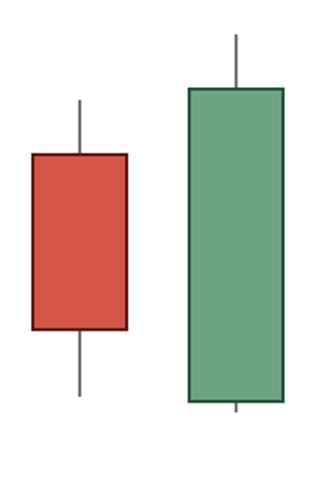 Bullish and Bearish engulfing
The green body is the bull. The red body is the bear. In a bullish engulfing, the bulls are in full control of the bears. This means that the market participants are ready to drive a particular price and willing to buy.
 Bullish and Bearish engulfing
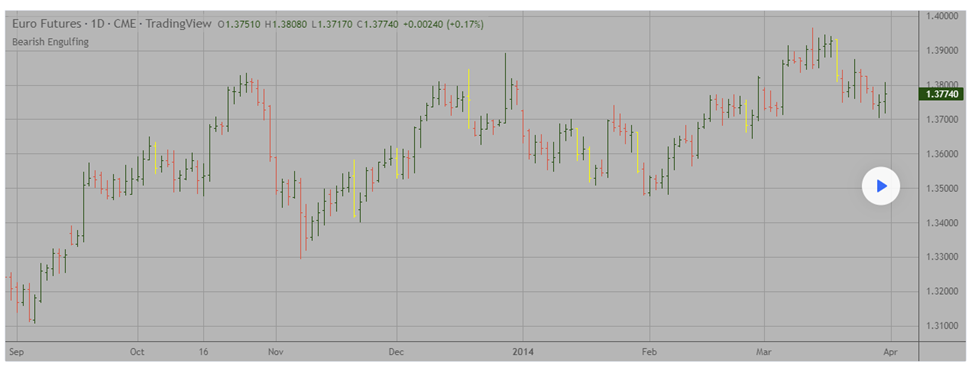
The bearish engulfing pattern looks like this;
A bearish pattern has a small green candle and then is closely followed by a red candle which completely engulfs it.
Double top and double bottom:
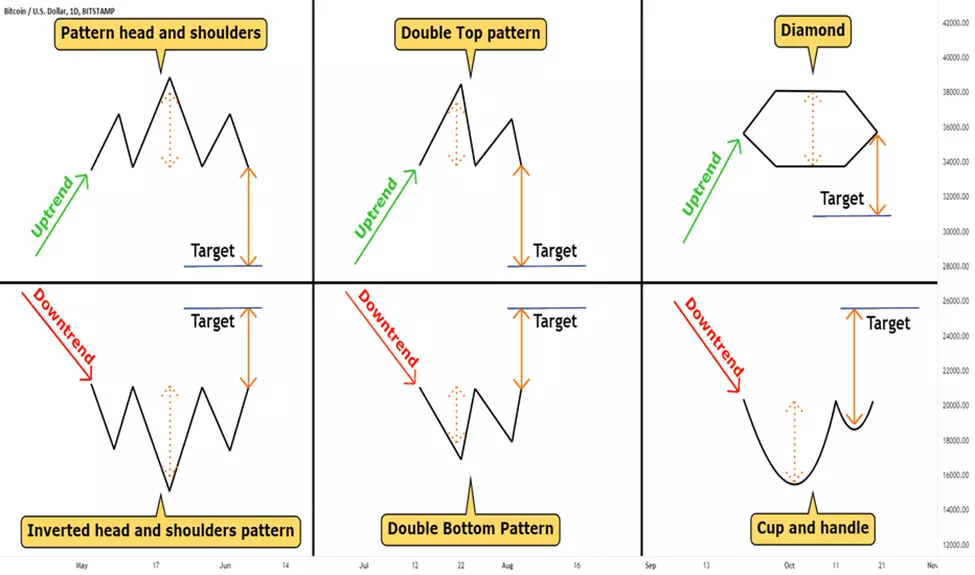 Double top and Double bottom
These patterns have two price swings located almost on the same level.
The double top pattern begins with a bullish trend. At some point, this gets interrupted and the price of the currency pair begins to range. This range creates two swing tops. After the second top has been created, the price action drops and starts a new bearish trend. This is a diagrammatic representation of the process;
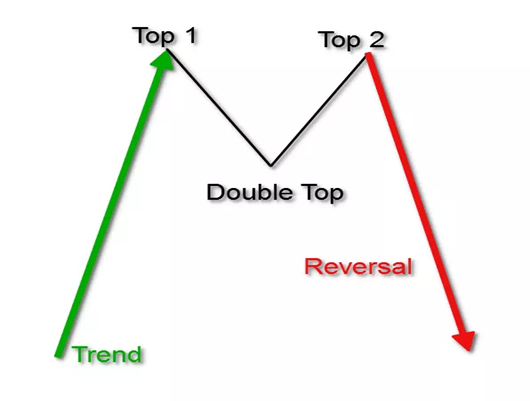 Double top
The double bottom pattern has the same working, just reversed. It starts with a bearish trend, gets interrupted at some point, The price action then enters a range, creating two swing bottoms. After the second bottom, the price breaks the range and starts a new bullish trend. This is a diagrammatic representation;
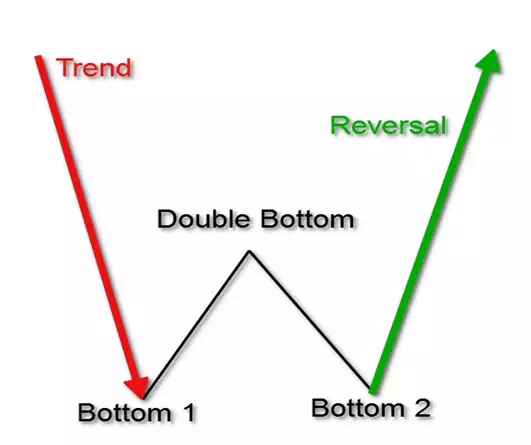 Double Bottom
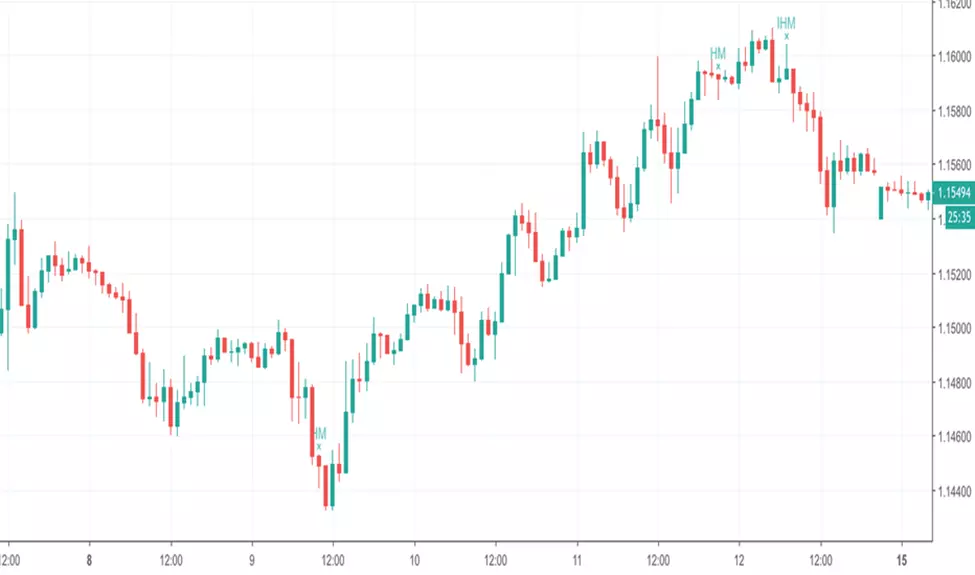
Hammer and Inverted Hammer:
 Hammer and Inverted Hammer
These are some of the most popular reversal patterns.
The hammer has just one candle and can be seen at the end of a downtrend. It has a short body and a long wick that is twice the size of the body.
An inverted hammer has the shape of a hammer turned upside down.
A hammer indicates a potential change in the direction of the price.
How to trade with trend reversal indicators
Reversals happen on different time frames. To a long-term investor, an intraday reversal on a five-minute chart does not matter so much. A day trader, on the other hand, having a five-minute reversal is a big deal. Reversals are inevitable in the financial market.
The thing about reversals is that when they begin, it’s not clear whether they are reversals or simply pullbacks. By the time this information becomes clear, the price may have already moved significantly. This could either lead to a loss or a profit depending on the outcome of the move.
Traders handle this by exiting the trade while it is still moving in their direction. This way, there would be no concerns about the outcome of the move.
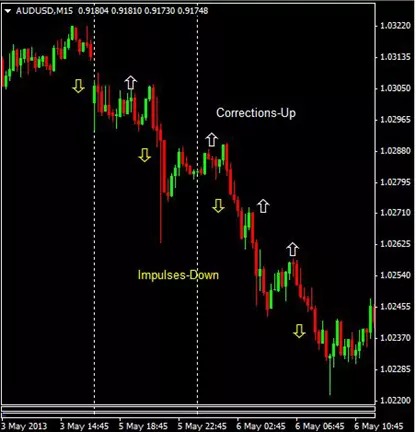
During a trend, there are two main environments; impulses and corrections.
Impulses do not last long, and they occur in the direction of the trend.
Corrections move against the trend.
Both can be either upward or downward movements.
 How to trade with trend reversal indicators
There are three ways you can trade a reversal trend:
Support and resistance
Breakout
Pullout
In the support and resistance method, the low of the accumulation stage is an area of support. If you expect higher prices, going long at this point would be a good idea.
While waiting for the trend to fade, we can draw indicative resistance/support levels. From there, you find the moment of reversal, evaluate the fundamental factors at the time of the reversal to exclude a correction.
Reversal indicator strategy example
The closest you will get to identifying a trend reversal is by reading the price action and identifying areas that could cause a possible reversal.
Price actions rely on historical prices to make better current trading decisions. Historical prices can be high, low, open, and close. Here is a strategy you can use:
Identify weakness in the trending move: One way to spot a trending move is that it usually has more bullish candles than bearish ones. A reducing bullish candle tells you that the buying pressure is either reducing or getting matched by the selling pressure. Although this does not assure that a market will crash, it could be a signal that the buyers are reducing their pace.
Identifying strength in the reversal move: A reversal move is trading in the opposite direction. It usually has more bearish than bullish candles. A sudden increase in the size of bearish candles tells you that the selling pressure is increasing and buyers are not willing to buy at higher prices. This is a signal that buyers are reducing their pace.
A maturing trend will move into a stage where buyers and sellers are at an equilibrium.
The best time to open a trading deal is when it is most active. This is when the spread is narrow.
What is the most effective trend reversal indicator?
When it comes to trend reversal indicators, there is no one-size-fits-all solution. Every trading strategy requires its own customization. However, based on the many traders who depend on technical analysis, Relative Strength Index (RSI), Moving Average Convergence Divergence (MACD), and Stochastic Oscillator are among the most trusted tools for spotting possible indicator turns.
All three focus on different aspects of market dynamics, giving traders a well-rounded perspective that allows them to make more informed decisions. The RSI is the best trend reversal indicator, and it assesses the strength of current price movements, while the MACD looks at momentum and trend formation.
The Stochastic Oscillator, on the other hand, communicates potential with trend direction by monitoring an asset's close price relative to its high/low range over a set period of time. With these three indicators combined, investors can gain insight into whether a stock is moving up or down, as well as detect potential entry and exit points for profitable trades.
Key signs of trend reversal
As a trader, it's important to be able to identify when a trend is likely to reverse, as this can provide valuable opportunities to enter or exit a position. However, identifying a trend reversal can be challenging, as the market has no guarantees. Nonetheless, by understanding the key signals that a trend can change direction, traders can become more informed and confident in their trading decisions. Here are some signs you should watch out for.
Changing volume patterns
A changing volume pattern is one of the most common signs of a potential trend reversal. In an uptrend, the volume should increase as prices move higher, while in a downtrend, the volume should decrease as prices fall lower. If this pattern begins to change (i.e., if volumes increase in a downtrend or decrease in an uptrend), it may indicate that the trend is about to reverse itself.
Price action changes
Another sign of potential trend reversal is when we start seeing changes in price action. This could mean that support and resistance levels start shifting or prices begin forming patterns like double tops and bottoms which often signal possible reversals. Paying attention to these technical indicators can give you insight into what the markets may be doing next.
Breakouts and Breakdowns
Breakouts and breakdowns are other signals that may indicate an impending trend reversal. When an asset breaks out above resistance or below support levels, it may signal a shift in momentum which could lead to further price movement in either direction. Similarly, if an asset breaks down below support or above resistance levels, it could also indicate the current trend is reversing and heading toward new highs or lows.
Trendline Break
A trendline break occurs when the price of an asset breaks through its established support or resistance line. This often indicates that a reversal is imminent, as it shows that momentum has changed from bullish to bearish (or vice versa). As such, traders need to keep an eye out for any potential breakouts from these levels.
Moving Average Crossover
Moving averages are one of the most popular tools technical analysts use in forex trading. Looking for crossovers between two moving averages—such as the 50-day and 200-day—can provide clues about when a trend might reverse direction. For example, if the 50-day moving average crosses below the 200-day moving average, it could signal that the uptrend is over, and a downtrend may be beginning instead.
Oscillator Divergence
An oscillator divergence occurs when price action on an asset moves in different directions than its associated Oscillator (e.g., MACD or RSI). This discrepancy suggests that momentum has been lost and can be a sign that a trend reversal may be around the corner. It's important to note, however, that not all divergences lead to reversals. You should always confirm with other indicators before entering any trades.
Are trading reversals profitable?
Every trader has experienced a reversal in the market. But is trading reversals profitable? The answer is yes, but with some caveats. When trading a trend reversal, the potential profit can be higher than trading in the same direction as the current trend.
However, reversal trading requires experience and an understanding of not only technical indicators but also reversal patterns that can confirm signals and make trading more reliable and profitable for beginners. To make trading more reliable and profitable, here are some recommendations for beginners:
Learn to Identify Important Chart Patterns
Chart patterns such as head-and-shoulders or double tops provide clues about potential reversals in price movements. Learning to recognize these patterns can help traders spot potential opportunities for profit when trading reversals.
Monitor Support and Resistance Levels
Support and resistance levels are areas on a chart where prices are likely to change direction as buyers or sellers enter or exit the market. Monitoring these key levels can help traders identify possible entry points when trading reversals.
Use Risk Management Techniques
Risk management is essential when trading reversals since they tend to have higher risk/reward ratios than other types of trades. To minimize losses, it's important to set stop losses at key levels and use proper position sizing to ensure that any losses will not have too much of an impact on your overall portfolio balance.
Take Advantage of Forex Reversal Indicators
Technical indicators such as moving averages, MACD (Moving Average Convergence Divergence), or stochastics can help traders spot potential trends before they happen by comparing past data points with current trends in the market. This information can help you make more informed decisions about when to enter or exit a trade.
What is a trend reversal pattern?
A trend reversal pattern is simply a series of candlestick formations that indicate the end of an existing price trend. These patterns are typically represented by shapes that resemble well-known symbols such as double tops/bottoms, head and shoulders, triangles, flags, etc. Each pattern has its own characteristics and can be used to identify potential changes in the market direction.
There are several types of trend reversal patterns, each with its own set of characteristics that can help traders identify potential reversals. Some examples of these patterns include:
Double top and bottom
The double top and bottom pattern is one of the most common trend reversal patterns. As its name suggests, this pattern forms when an asset's price reaches the same high (or low) twice in quick succession before finally heading in the opposite direction. This pattern is often considered to be a sign that the current trend is losing steam and that a reversal is about to take place.
Quasimodo pattern
Like the double top and bottom pattern, this pattern forms when an asset's price reaches the same high (or low) multiple times before finally heading in the opposite direction. However, unlike the double top and bottom pattern, the Quasimodo pattern typically forms over a longer period of time. This pattern is often considered to be a sign that an asset is overbought or oversold and that a correction is about to take place.
Head and shoulders pattern
The head and shoulders pattern is one of the most well-known trend reversal patterns out there. This pattern forms when an asset's price creates three successive peaks, with the middle peak being higher than both the left and right peaks. This pattern is often considered a sign that the current uptrend is about to end and that a reversal is about to take place.
Pin bar candlestick
A pin bar candlestick is a type of candlestick charting that can indicate whether or not a trend reversal is about to occur. This candlestick forms when an asset's price creates a long wick on one side of the body while remaining relatively small on the other side. This candlestick is often considered to be a sign that an asset's price is about to reverse course.
Rounding bottom pattern
The rounding bottom pattern occurs when an asset's price forms a U-shape overtime before finally breaking out in either direction. This pattern typically takes place over several weeks or months and can be used to indicate whether or not an uptrend or downtrend is about to take place.
Reversals become far more reliable when you wait for confluence

The biggest mistake beginners make with reversal indicators is trying to use them in isolation. I’ve learned that reversals become far more reliable when you wait for confluence: for example, an RSI divergence that appears at a key Fibonacci level and is confirmed by price action, such as a pin bar or engulfing candle. I also strongly recommend filtering reversals with higher-timeframe context – many “perfect” signals on lower charts are just pullbacks against a dominant trend. In practice, I treat reversal indicators not as entry triggers, but as alerts that tell me to slow down, reduce position size, and wait for confirmation. This approach has helped me avoid false tops and bottoms and focus only on high-probability reversal setups with clearly defined risk.
Conclusion
Editors' Top Picks and Insights

Hunting crypto owners: Why criminals have gone offline

BitMEX is shutting down: Why Trump could not save the exchange

Do governments need crypto workers?

Brent nears $100: Why oil prices are rising

Gram Wallet launch: Can Telegram bring crypto to the masses?

AI without limits: How dangerous are neural networks?
Related Articles
Team that worked on the article
Rinat Gismatullin is an entrepreneur and a business expert with 9 years of experience in trading. He focuses on long-term investing, but also uses intraday trading.
Dan Blystone began his trading career in 1998 as an arbitrage clerk on the floor of the Chicago Mercantile Exchange (CME). He later traded bond and Eurex futures at proprietary firms such as Altea Trading, gaining valuable experience in high-frequency trading and risk management.
Chinmay Soni is a financial analyst with more than 5 years of experience in working with stocks, Forex, derivatives, and other assets. As a founder of a boutique research firm and an active researcher, he covers various industries and fields, providing insights backed by statistical data.
A trading system is a set of rules and algorithms that a trader uses to make trading decisions. It can be based on fundamental analysis, technical analysis, or a combination of both.
The deviation is a statistical measure of how much a set of data varies from the mean or average value. In forex trading, this measure is often calculated using standard deviation that helps traders in assessing the degree of variability or volatility in currency price movements.
Breakout trading is a trading strategy that focuses on identifying and profiting from significant price movements that occur when an asset's price breaches a well-defined level of support or resistance.
A day trader is an individual who engages in buying and selling financial assets within the same trading day, seeking to profit from short-term price movements.
Day trading involves buying and selling financial assets within the same trading day, with the goal of profiting from short-term price fluctuations, and positions are typically not held overnight.

-
 Afghanistan
-
 Albania
-
 Algeria
-
 Angola
-
 Argentina
-
 Armenia
-
 Australia
-
 Austria
-
 Azerbaijan
-
 Bahamas
-
 Bahrain
-
 Bangladesh
-
 Belarus
-
 Belgium
-
 Bolivia
-
 Botswana
-
 Brazil
-
 Brunei
-
 Bulgaria
-
 Cambodia
-
 Cameroon
-
 Canada
-
 Chile
Chile
-
 China
China
-
 Colombia
-
 Congo
Congo
-
 Costa Rica
-
 Cote d'Ivoire
-
 Croatia
-
 Cuba
Cuba
-
 Cyprus
-
 Czechia
-
 DR Congo
-
 Denmark
-
 Dominican Republic
-
 Ecuador
-
 Egypt
Egypt
-
 El Salvador
-
 Estonia
-
 Eswatini
-
 Ethiopia
-
 Finland
-
 France
-
 Georgia
-
 Germany
-
 Ghana
Ghana
-
 Greece
-
 Haiti
Haiti
-
 Hong Kong
-
 Hungary
-
 India
India
-
 Indonesia
-
 Iran, Islamic republic
-
 Iraq
Iraq
-
 Ireland
-
 Israel
-
 Italy
Italy
-
 Jamaica
-
 Japan
Japan
-
 Jordan
-
 Kazakhstan
-
 Kenya
Kenya
-
 Korea
Korea
-
 Kuwait
-
 Kyrgyzstan
-
 Laos
Laos
-
 Latvia
-
 Lebanon
-
 Lesotho
-
 Libya
Libya
-
 Lithuania
-
 Luxembourg
-
 Madagascar
-
 Malaysia
-
 Malta
Malta
-
 Mauritius
-
 Mexico
-
 Moldova
-
 Mongolia
-
 Montenegro
-
 Morocco
-
 Mozambique
-
 Myanmar
-
 Namibia
-
 Nepal
Nepal
-
 Netherlands
-
 New Zealand
-
 Nigeria
-
 North Macedonia
-
 Norway
-
 Oman
Oman
-
 Pakistan
-
 Palestine
-
 Panama
-
 Papua New Guinea
-
 Paraguay
-
 Peru
Peru
-
 Philippines
-
 Poland
-
 Portugal
-
 Puerto Rico
-
 Qatar
Qatar
-
 Reunion
-
 Romania
-
 Rwanda
-
 Saudi Arabia
-
 Serbia
-
 Singapore
-
 Slovakia
-
 Slovenia
-
 Somalia
-
 South Africa
-
 Spain
Spain
-
 Sri Lanka
-
 Sweden
-
 Switzerland
-
 Syria
Syria
-
 Taiwan
-
 Tajikistan
-
 Tanzania
-
 Thailand
-
 Trinidad and Tobago
-
 Tunisia
-
 Turkey
-
 UAE
UAE
-
 Uganda
-
 Ukraine
-
 United Kingdom
-
United States
-
 Uruguay
-
 Uzbekistan
-
 Venezuela
-
 Vietnam
-
 Yemen
Yemen
-
 Zambia
-
 Zimbabwe
- Forex
- Crypto
