Double Bottom and Double Top Reversal Patterns Review
Double top and double bottom are reversal patterns commonly used in technical analysis to predict trend reversals. They form when the price of a security reaches two similar highs or two similar lows, respectively. These patterns are reliable indicators of trend reversals when they form after a sustained move in one direction. The double bottom resembles a W pattern, indicating a bullish reversal.
Meanwhile, the double top resembles an M pattern while indicating bearish reversals. Although both patterns have similar components, such as the neckline and the breakouts, they indicate different things.
So how do these patterns differ? How can you trade using them? In this guide, you'll learn all this.
How to trade double tops in forex trading
Course for Beginners Traders by TU
What is the Double Bottom Pattern?
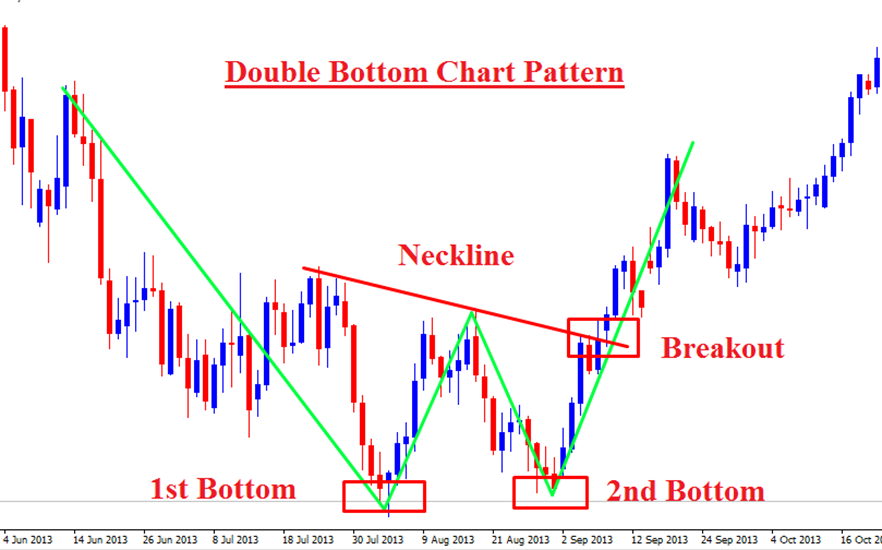
Double bottom chart pattern
A double bottom pattern is a downtrend reversal pattern that forms when the security price reaches two consecutive lows that are approximately equal. The pattern is reliable when it appears after an extended downtrend.
The double bottom pattern is similar to the W formation, a bullish reversal pattern. However, the main difference is that the W formation has two peaks instead of two lows.
The double bottom pattern forms when the price tests a support level twice and cannot break it on the second attempt. That creates a trough followed by a rebound.
The key to confirming this pattern is the neckline formed by connecting the two lows. A breakout above the neckline signals that the downtrend has reversed and that there is potential for a new uptrend.
How to Identify Double Bottom Pattern
How to Identify Double Bottom Pattern
The key to identifying the double bottom pattern is to look at the shape. It will look like a ''W''. The first bottom's advance should have a drop of 10% to 20% while the second bottom should drop 3% to 4% of the former low.
You can identify the double bottom by checking where the pattern is relative to the resistance level or the neckline. For example, if there are two lows below the neckline or the resistance level, it indicates a double bottom pattern.
The extremums of the price chart form the pattern. The first bottom is usually lower than the second one, but both should be equal in price. The time frame for the pattern can vary from a few days to a few weeks.
While it's not entirely mandatory to find two extremums at the same level, you should make an effort to find the optimal parameters. For example, if the parameter value is too small, the significant movements will be divided into smaller parts. Meanwhile, it will skip short movements if the parameter is too big.
Some traders use small parameter values to find the middle ground and curate an additional superstructure using unidirectional movements, combining short corrections in a single movement. You can also use the CTrends class to resolve this issue.
As mentioned, lows will not always be at the same level. Typically, they are at slightly different levels. The same goes for the double top too. This Bitcoin trading chart shows that the double bottoms' lows are not at the same level.
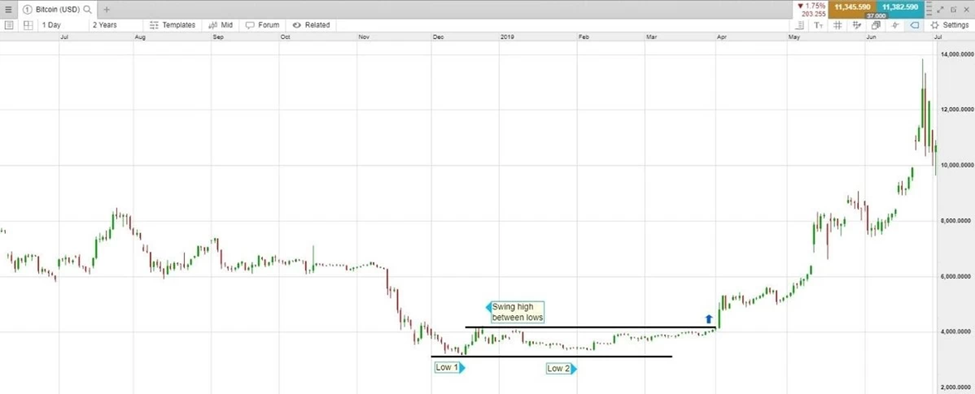
Bitcoin trading chart
Keeping your risk tolerance in mind, you can either place a stop loss below the second low or below a recent swing low. You can also use the double W bottom pattern indicator with other signals and reversal indicators to confirm the pattern.
For example, you may use it with the stochastic oscillator, a momentum indicator. When the stochastic oscillator moves above 80, it could indicate that the market is overbought, and a reversal could be in store. You can then use this information to help you decide whether or not to enter a trade.
When using double bottom patterns, it's important to note that false patterns may also form. For example, the price may rebound from the support level several times in a descending triangle pattern before finally breaking out. The only way to confirm that a pattern is a double bottom is by waiting for a breakout above the resistance level or neckline.
How to Trade Double Bottom Pattern
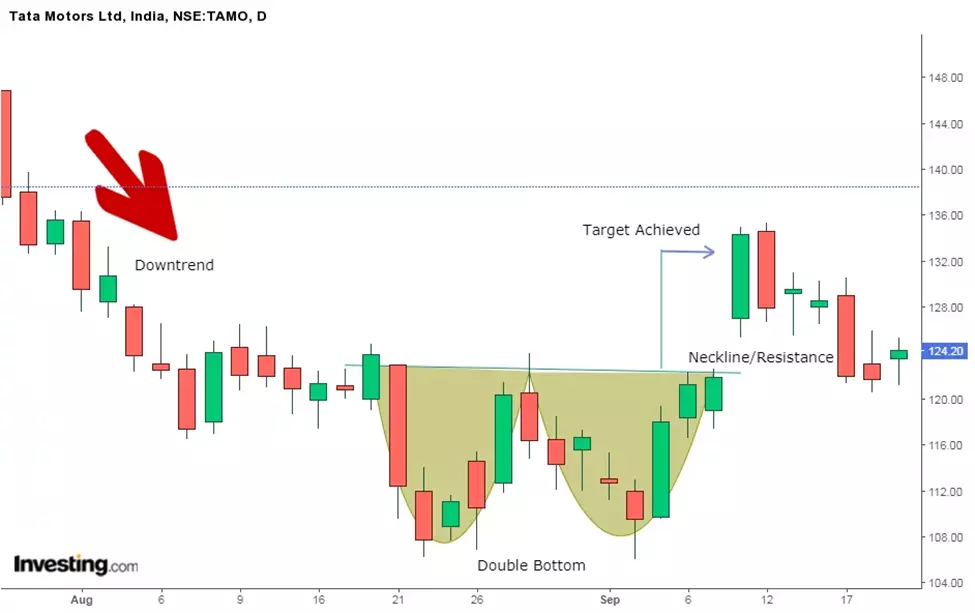
The double bottom pattern forms after a downtrend in a particular asset. It signals the start of a potential uptrend. Like other chart patterns, the double bottom pattern is also helpful in analyzing the long-term market view.
If there's a longer duration between both lows of the pattern, there's a high chance of the pattern being successful. In most cases, it's ideal if the period between both lows is three months. Here's an example of how the double bottom pattern comes into play.
As you can see in the chart below, there are three components of a double bottom pattern; the uptrend, the downtrend, and the breakout. Therefore, you must consider the breakout when trading a double bottom pattern.
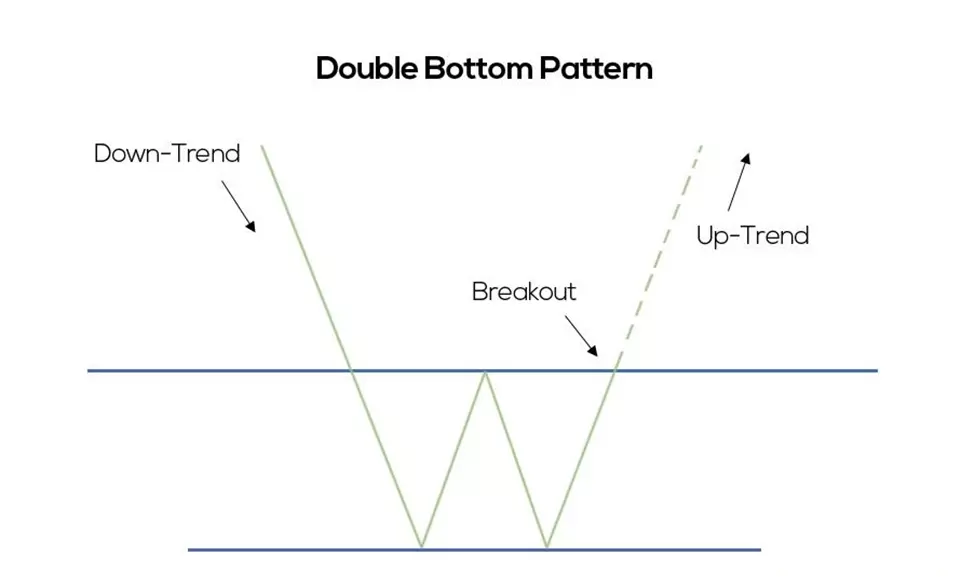
Double bottom pattern
After creating a second bottom in this example, the price action surges higher. It breaks the levels where the former two highs were recorded. But as you can see, the breakout was a failure since the price moved below the neckline quickly.
Double bottom pattern
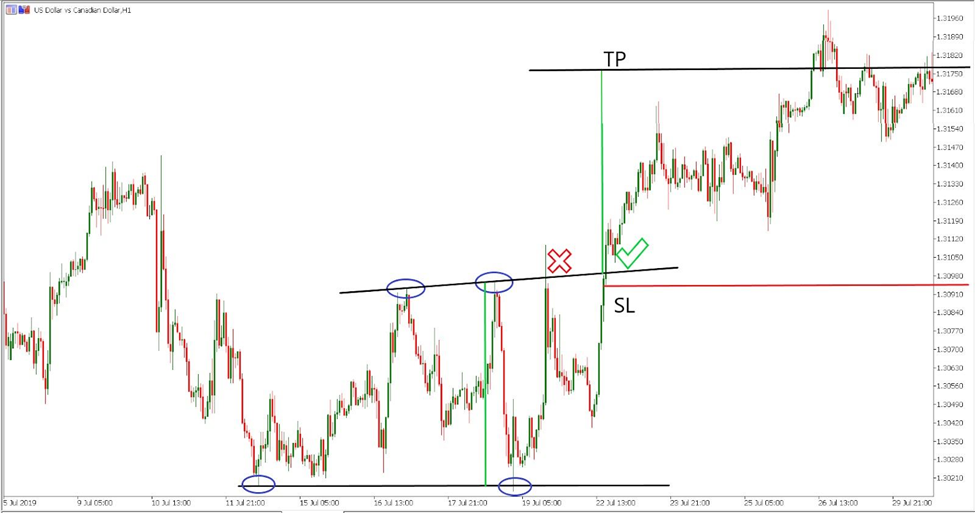
As the example indicates, you should be patient when trading with a double bottom pattern. Let the price close above the neckline before you enter the market.
The graph above shows that the USD/CAD closes above the neckline at a certain point. Therefore, you enter the market, placing your stop-loss below the neckline. Doing so creates space for the price to move, similar to what it did earlier in the failed breakout.
The stop-loss level will depend on how much risk you can tolerate. Anything from 15 pips to 30 pips is ideal, but make sure it's below the neckline and not too close to it.
What is the Double Top Pattern?
Double top pattern
A double top pattern is a bearish technical reversal pattern that forms after asset experiences a strong rally, followed by two retracements that fail to break through the previous peak. The second top is typically lower than the first, but both should be roughly equal in price.
The ''tops'' in the double top pattern are peaks formed due to the price hitting a level that cannot break. After hitting this peak, the price will slightly bounce off but return to the peak level.
A double top pattern's essence and trading principles mirror the double bottom pattern. Since it's one of the most frequently appearing trading patterns in the market, most traders prefer to use it for their trades.
You can trade the pattern aggressively or conservatively, depending on your risk tolerance. When dealing aggressively, you can look to short the asset when it breaks below the neckline or wait for a confirmed support level break.
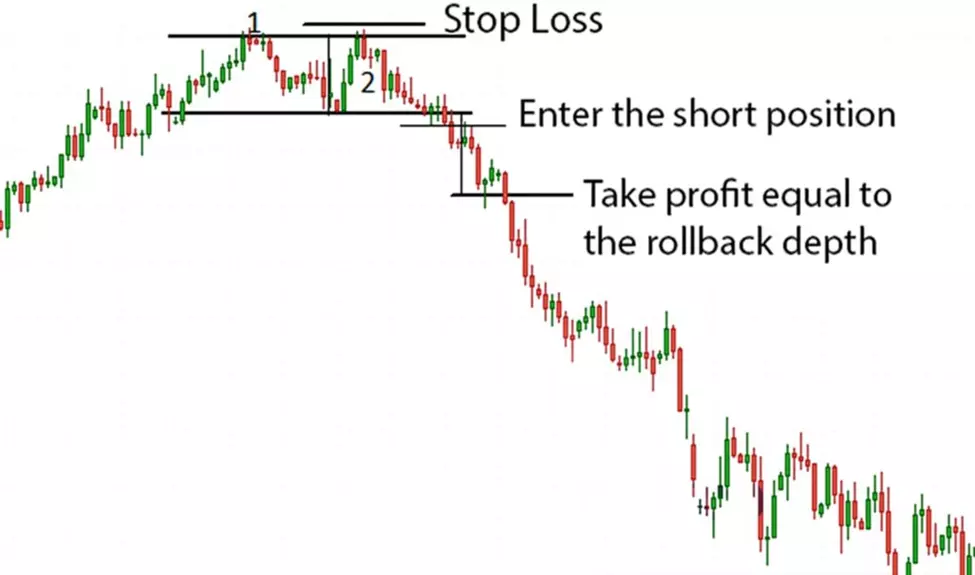
Double top pattern
In this case, you open the position immediately after the second peak forms, following the closing of the candle behind the rollback level. Therefore, you place the stop order above the second peak.
Trading conservatively, you can wait for a confirmed support level break before taking any action. You will wait for the rollback level to break out and open a position.
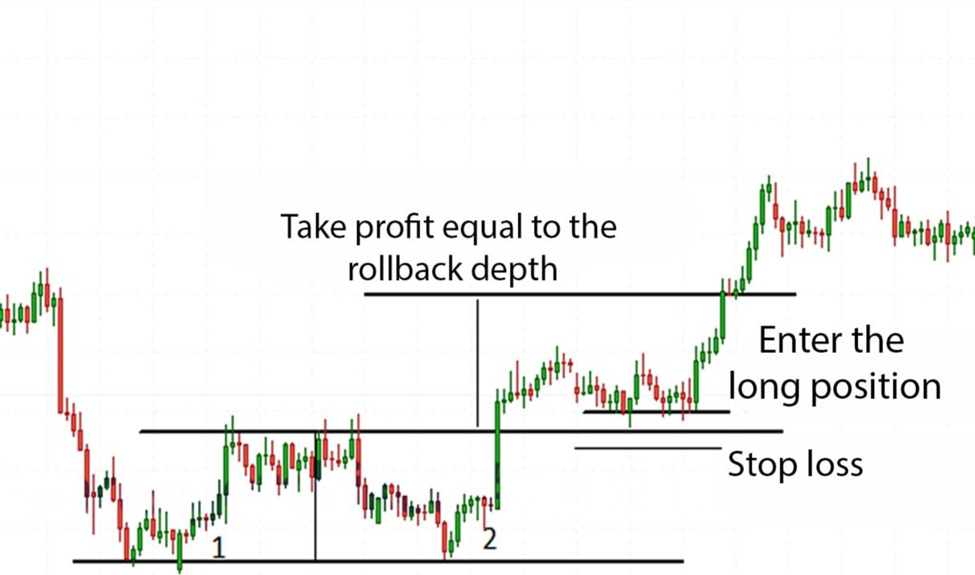
Double top pattern
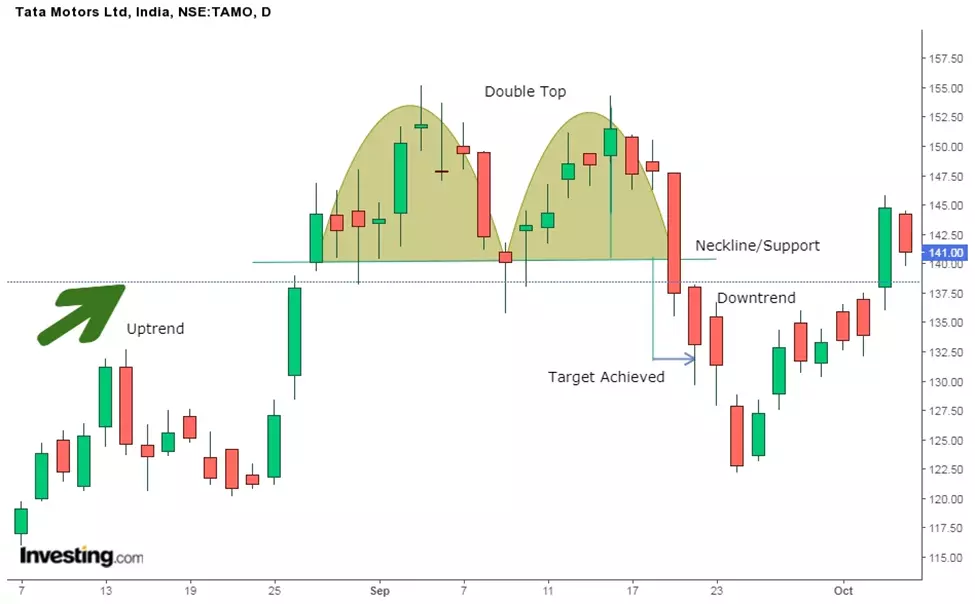
When trading with a double top pattern, traders should focus on the breakout direction. A breakout to the upside typically signals that the bullish trend has resumed, while a breakout to the downside suggests that the bears are in control of the market. The double top pattern can also be used to identify potential areas of support and resistance. The first top represents resistance, while the second top marks support.
Irrespective of the reversal indicator you're using, it's important to combine them with other patterns or indicators to confirm a breakout.
| Double Bottom Pattern | Double Top Pattern | |
|---|---|---|
Formation |
The double bottom pattern forms following a downtrend, indicating a bullish reversal chart pattern. |
The double top pattern is formed following an uptrend and indicates a bearish reversal chart pattern. |
Support Level |
It has two lows below the neckline or the resistance level. |
It has two peaks above the neckline or the support level. |
Stop Loss |
Traders should put the stop loss at the bottom of the second low in the pattern. |
Traders should put a stop loss at the second top in the pattern. |
Price Target |
It should be equal to the distance between the two lows and the neckline or resistance level. |
It should be equivalent to the distance between the tops and the neckline. |
Best Brokers to Consider
By now, you should understand using the double bottom chart pattern for trading. In addition, you can apply the opposite principles to trade the double top pattern. But you'll only be able to use these strategies if you have a reliable broker that facilitates day trading on an advanced scale.
When looking for suitable brokers for trading, it's essential to consider certain features, such as charting tools, account types, demo accounts, and fees.
Here's how these things influence your trading activities.
-
Charting Tools: It's essential to have a broker that provides high-quality charting tools so you can properly analyze the markets. Look for brokers that offer candlestick, OHLC, line charts, technical indicators, and drawing tools.
-
Account Types: Brokers typically offer different account types to cater to different traders. For example, some brokers offer micro accounts for traders who want to trade with small amounts, while others provide VIP accounts for large traders.
-
Demo Accounts: A demo account allows you to practice trading with virtual money before risking your capital. It's pretty useful for beginners.
-
Fees: When trading, you don't want a huge chunk of your earnings to go to fees. Therefore, look for brokers with reasonable fees.
Here are two brokers that offer extensive charting tools and have favorable trading conditions for active traders.
Interactive Brokers

Interactive Brokers is an ideal platform for active traders due to its advanced trading features, comprehensive selection of tradable assets, low per-share pricing, and low margin rates. In addition, the platform's new feature, IBKR Lite, allows traders to enjoy commission-free ETF and stock trading.
The platform also has a plethora of charting tools that you can use to make informed decisions when trading stocks, bonds, mutual funds, and other securities. Moreover, Interactive Brokers has licenses from several top-tier financial regulators, making it a safe platform for high-end trading.
IG

IG is another broker that offers extensive charting tools for every market type and allows you to deal directly from the charts. For instance, you can place deals, attach stops, set limits, and set alerts without exiting the charts.
Additionally, the platform has more than 100 technical indicators, allowing you to analyze the markets thoroughly. You can also use the drawing tools to annotate charts and make trading decisions using reversal patterns, such as a W bottom pattern or MACD.
Summary
Both the double bottom and double top reversal patterns are instrumental in helping traders make informed decisions. However, these patterns are only helpful if a reliable broker offers high-quality charting tools and favorable trading conditions.
Additionally, you should know how to read the signals correctly, as false signals can lead to huge losses. Therefore, make sure to practice with a demo account before trading with real money.
FAQs
How Reliable Is the Double Bottom Pattern?
The double bottom chart pattern is comparatively more reliable than the double top. But you should still note that it could show false breakouts. So a better strategy would be to wait for the breakout and then enter into a trade.
Is the Double Bottom Pattern Bullish?
The double bottom pattern indicates a bullish price movement and is shaped like a ''W''.
What Does It Mean When the Market Is Bullish?
A bullish market means that the prices of securities are rising. As an investor, if you expect the prices of assets to rise, you're a bull. Thus, you will purchase assets in a bullish market, hoping to make a profit by reselling them later.
What Happens After a Double Top Pattern?
A double top reversal pattern forms when there is an extended uptrend. The peaks or the tops form after the price hits an unbreakable level. After the double top pattern has formed, the prices bounce a bit but eventually return to the test level.
Glossary for novice traders
-
1
Forex Trading
Forex trading, short for foreign exchange trading, is the practice of buying and selling currencies in the global foreign exchange market with the aim of profiting from fluctuations in exchange rates. Traders speculate on whether one currency will rise or fall in value relative to another currency and make trading decisions accordingly. However, beware that trading carries risks, and you can lose your whole capital.
-
2
Day trading
Day trading involves buying and selling financial assets within the same trading day, with the goal of profiting from short-term price fluctuations, and positions are typically not held overnight.
-
3
Bitcoin
Bitcoin is a decentralized digital cryptocurrency that was created in 2009 by an anonymous individual or group using the pseudonym Satoshi Nakamoto. It operates on a technology called blockchain, which is a distributed ledger that records all transactions across a network of computers.
-
4
Brokerage fee
A brokerage fee, also known as a commission, is a fee charged by a brokerage or financial institution for facilitating and executing financial transactions on behalf of clients. Brokerage fees are typically associated with services related to buying or selling assets such as stocks, bonds, commodities, or mutual funds.
-
5
CFD
CFD is a contract between an investor/trader and seller that demonstrates that the trader will need to pay the price difference between the current value of the asset and its value at the time of contract to the seller.


Team that worked on the article

Ivan is a financial expert and analyst specializing in Forex, crypto, and stock trading. He prefers conservative trading strategies with low and medium risks, as well as medium-term and long-term investments. He has been working with financial markets for 8 years. Ivan prepares text materials for novice traders. He specializes in reviews and assessment of brokers, analyzing their reliability, trading conditions, and features.

Dr. BJ Johnson is a PhD in English Language and an editor with over 15 years of experience. He earned his degree in English Language in the U.S and the UK. In 2020, Dr. Johnson joined the Traders Union team. Since then, he has created over 100 exclusive articles and edited over 300 articles of other authors.

Mirjan Hipolito is a journalist and news editor at Traders Union. She is an expert crypto writer with five years of experience in the financial markets. Her specialties are daily market news, price predictions, and Initial Coin Offerings (ICO).
