Leveraging the W Pattern in Your Trading Strategy


Editorial Note: While we adhere to strict Editorial Integrity, this post may contain references to products from our partners. Here's an explanation for How We Make Money. None of the data and information on this webpage constitutes investment advice according to our Disclaimer.
The W Pattern, a technical trading indicator, signals a bullish market reversal. It's characterized by two troughs at roughly the same low level, separated by a peak.
Features: Bullish reversal indicator; Double-bottom structure.
Pros: Clear entry, stop-loss, and target points. Applicable to various assets.
Cons: Possibility of false signals. Subjective. Dependent on market conditions.
Chart patterns allow traders to structure price dynamics and systematize their trading decisions. One of the main patterns for them is the W pattern.
This comprehensive guide aims to illuminate the path for beginners, unraveling the complexities of the W pattern. Through a meticulous exploration of its basics, application, and nuanced strategies, we equip traders with the knowledge to harness this pattern's potential, enhancing their trading acumen and decision-making prowess.
W Pattern Basics
The W pattern, often hailed as the harbinger of bullish reversals, unfolds on the charts as a double bottom, sketching a tale of resilience and impending uptrend. Identifying this pattern requires a keen eye on price action, where the market, after a downturn, attempts to recover, fails, and dips again only to bounce back with vigor, sketching a “W” on the chart. This visual cue is your first step towards mastering the W pattern.
Diversity marks its presence even in patterns. The W pattern is no exception, manifesting in various forms—ranging from the classic W to more complex iterations like the double bottom with a lower second bottom. Each type has its nuances and implications, making the understanding of their distinctions critical for accurate interpretation and application.
Interpretation is the key that unlocks the potential of the W pattern. It signals not just a potential end to a downtrend but also the strength of a forthcoming uptrend. The pattern’s completion—when the price breaks through the resistance formed at the top of the W—heralds a bullish reversal, suggesting an opportune moment for traders to consider entering the market.
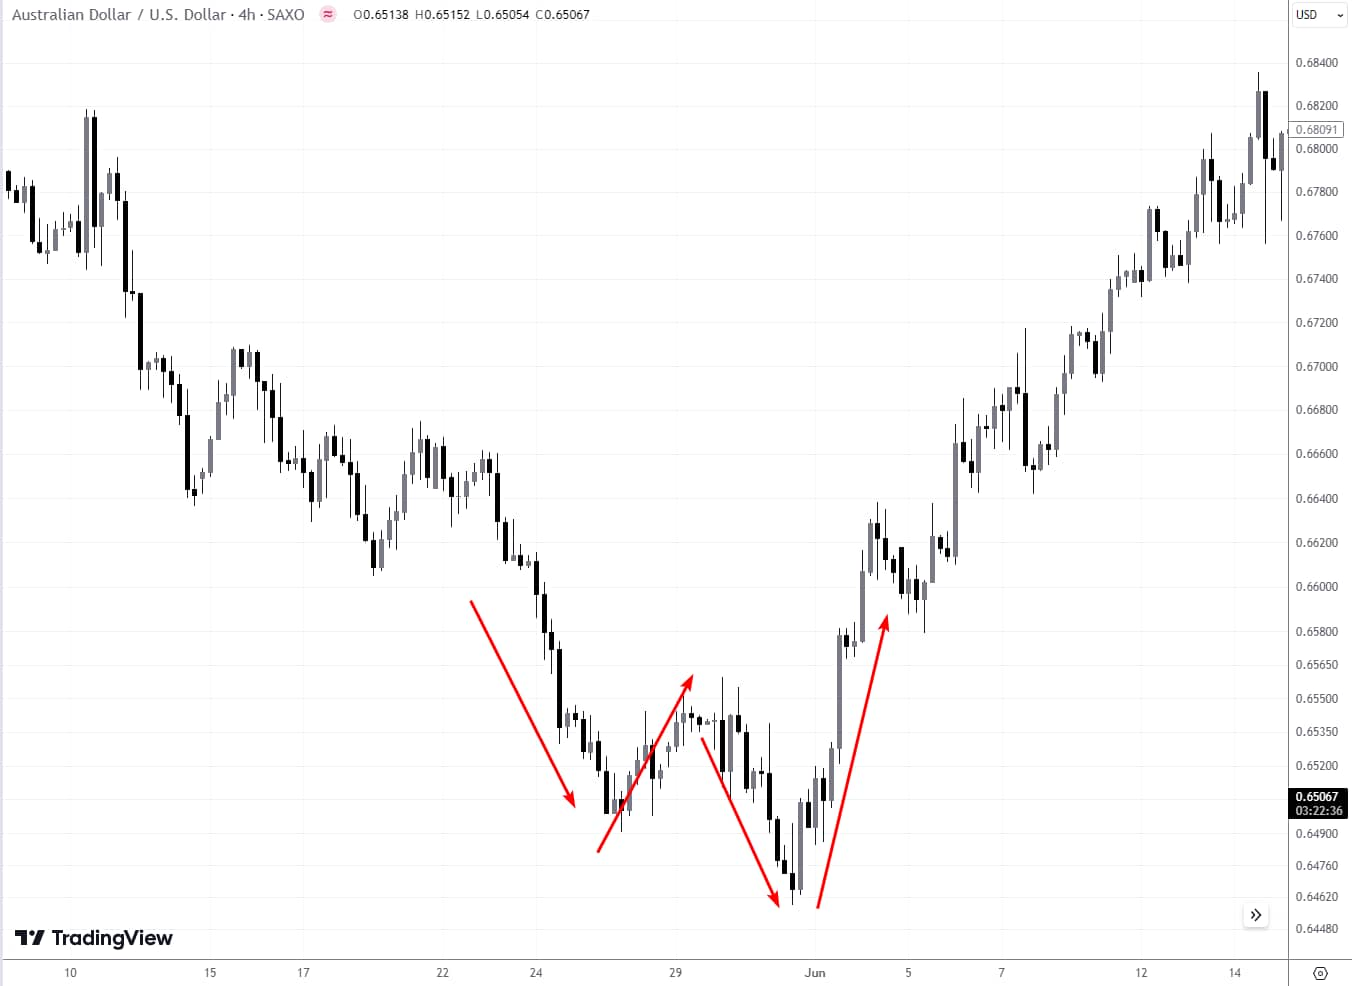 W pattern with a lower second bottom
To illustrate, let’s look at the above image. We can see a crisp, clear W pattern, annotated to highlight the initial dip, the interim peak, the second dip, and the eventual breakout. This visual aid, complemented by annotations, demystifies the pattern, making the theoretical tangible and the complex simple.
In the above case, the W pattern causes the downtrend to change to an uptrend. Moreover, the lower second bottom makes it difficult for traders to enter a long position, activating stop losses set under the first bottom.
This section lays the foundation, offering a lens through which traders can view and decipher the W pattern. With this understanding, the journey from recognizing to effectively trading the W pattern begins, opening up a world of opportunities for those ready to learn and apply.
Best Forex brokers for trading the W pattern
Choosing the right broker is important when applying chart patterns like the W pattern, as execution speed, charting tools, and spread conditions can affect trade outcomes. Traders should evaluate platform stability, analytical capabilities, and trading costs before selecting a broker.
The table below highlights Forex brokers that offer the core conditions needed for technical trading. This comparison helps traders assess which platform is better suited to their trading style, preferred tools, and overall market approach.
| zForex | Plus500 | OANDA | Trading.com USA | FOREX.com | |
|---|---|---|---|---|---|
|
Min. deposit, $ |
10 | 100 | No | 50 | 100 |
|
Tradable assets |
80 | 2800 | 129 | 69 | 5500 |
|
Standard EUR/USD spread |
0.3 | 0.7 | 0.3 | 1.1 | 1.0 |
|
Max. leverage |
1:1000 | 1:300 | 1:200 | 1:50 | 1:50 |
|
Max. Regulation Level |
Not regulated | Tier-1 | Tier-1 | Tier-1 | Tier-1 |
|
TU overall score |
8.05 | 7.57 | 6.89 | 6.15 | 6.87 |
|
Open an account |
Go to broker Your capital is at risk.
|
Go to broker 80% of retail CFD accounts lose money. |
Go to broker Your capital is at risk. |
Go to broker Your capital is at risk. |
Study review |
How do you use W patterns?
Trading with the W pattern hinges on precise execution:
recognizing the confirmation signal;
placing a strategic stop-loss;
and calculating the target.
In terms of classical technical analysis, the confirmation signal occurs when the price breaks above the resistance level at the peak of the W, indicating a potential bullish reversal. Traders are usually advised to wait for a conclusive breakout above this resistance before entering a trade to avoid false signals.
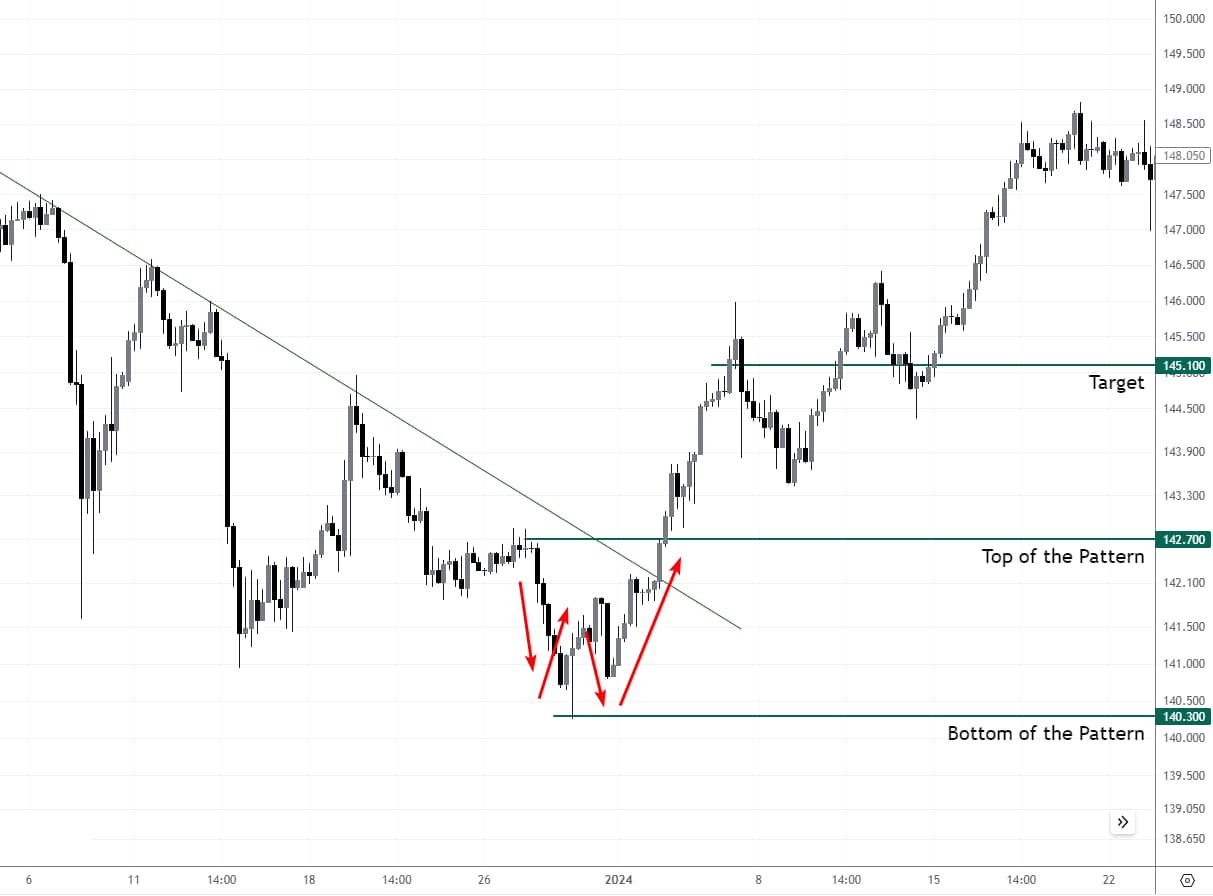 W pattern on the USD/JPY chart
However, the chart above shows an example when traders get a reason to enter a long position after breaking the downtrend line without waiting for the top of the pattern to break.
To calculate the target, measure the distance from the bottom of the lowest trough to the resistance level and project this same distance upwards from the breakout point. This projection helps in setting a realistic profit-taking level, aiming to capture the upward momentum post-confirmation.
Studying numerous examples of the W pattern on various charts and can significantly improve trading outcomes when dealing with W patterns.
What is the stop loss in the W pattern?
There are two approaches: conservative and non-traditional.
In the traditional approach, the stop loss is set below the low of the W pattern. This is simple, but worsens the risk-to-potential reward ratio. Should the market price fall below this trough, it suggests that the expected upward trend may not materialize, and thus, exiting the trade at this point helps minimize losses.
In a non-traditional approach, traders can use other methods:
set stop losses using the lows on the lower timeframes;
set stop losses using indicators;
use a formula - for example, set a stop loss so that the reward to risk ratio is 2:1.
Remember, the stop-loss strategy is fundamental in managing risk, ensuring traders are shielded from larger-than-expected downturns.
Example 1: W Pattern in Stocks
The stock chart for Microsoft (MSFT) highlights a W pattern indicative of potential bullish reversal after a decline from the $275 per share MSFT level. The price exhibits a notable decline to form the first trough, rises to a peak, dips to create a second trough, and ultimately ascends past the initial peak, signaling the pattern's completion and a shift to an upward trend.
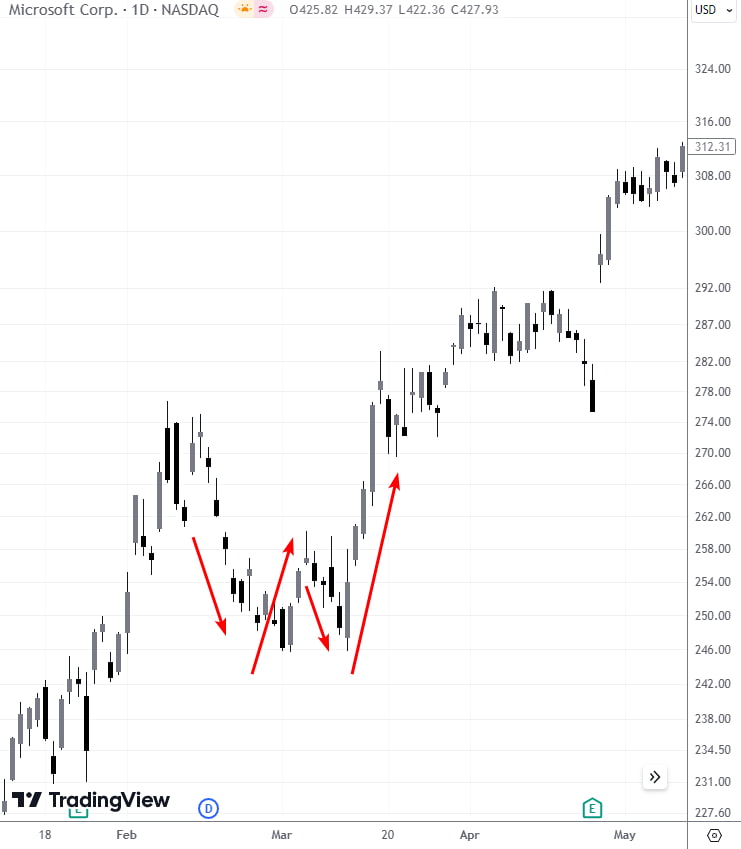 Microsoft (MSFT) Chart showing a W pattern
W pattern can be interpreted in such a way that the market by its action indicated the shortage of those willing to sell the stock below the psychological mark of 250 dollars.
Traders eye the breakout point above the pattern's peak (around $260) as a cue to initiate a long position.
If no other methods are used, a stop loss can be set below $250, safeguarding against false reversals.
The aim for profit is typically gauged by the depth of the W, projected above the resistance line broken by the breakout. At the same time, investors may retain all or part of their positions in anticipation of the long-term potential of the blue chip.
Example 2: W Pattern in Crypto
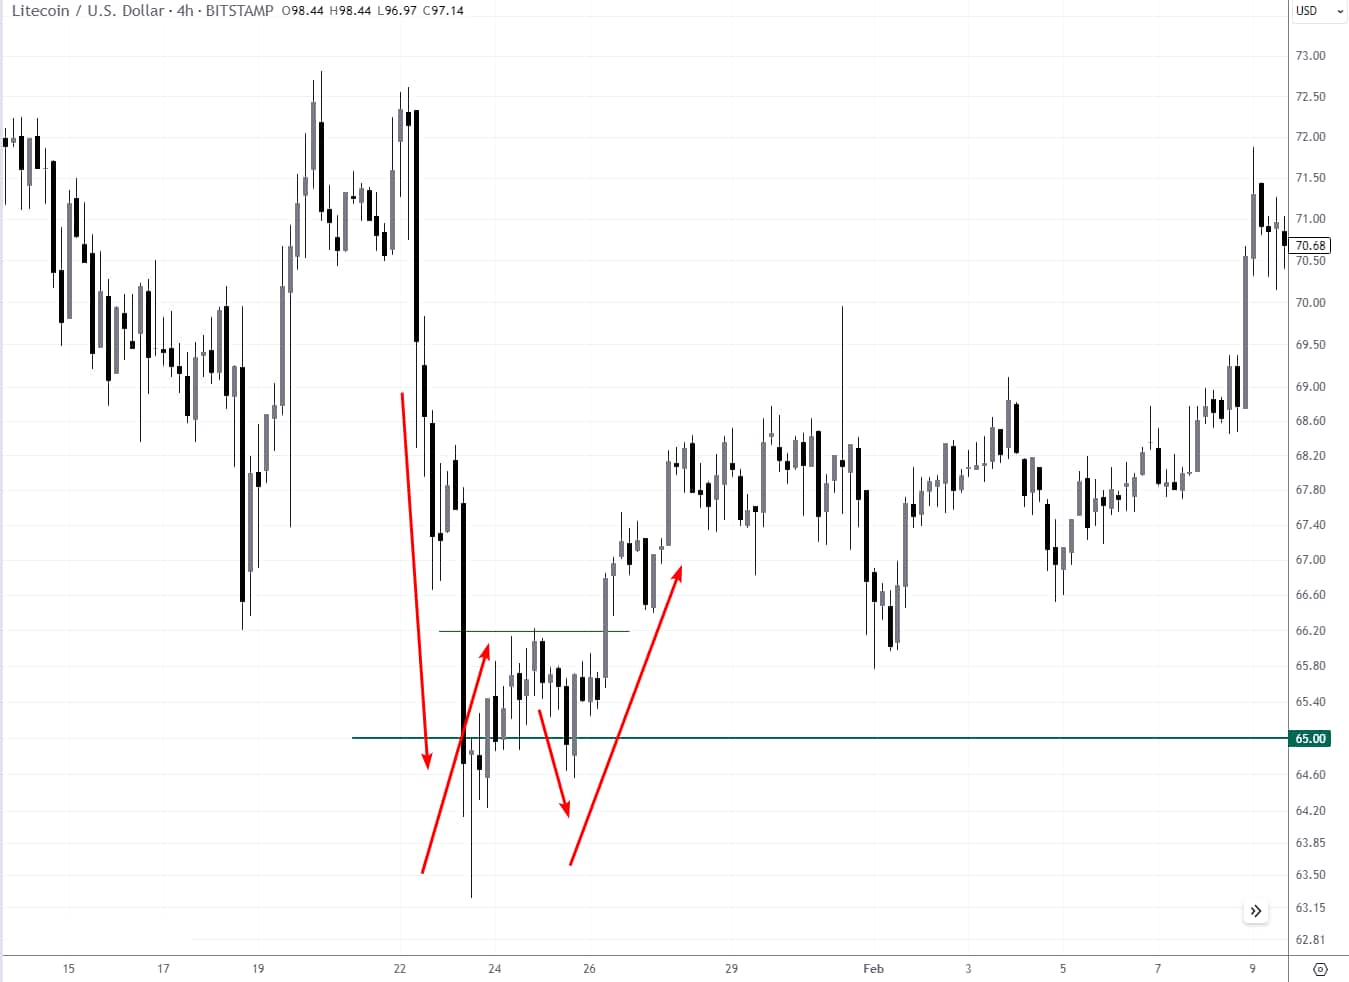 Litecoin/USD chart showing a W pattern
The Litecoin to U.S. Dollar chart on a 4-hour timeframe from Bitstamp illustrates an interesting W pattern to consider.
The pattern is drawn on the chart when the price of the coin falls below the $65 level, forming the first trough, which has the characteristic of panic.
An intermediate top is then formed around $66.20.
The price then drops to form a second trough. But the sellers' pressure is small, so the second trough is above the first one implying that the panic has subsided and traders may consider the idea of long entry when the price will break through the resistance level of the intermediate peak.
The target for profit-taking is usually determined by the vertical distance from the troughs to the peak, projected above the breakout point. Trading the W pattern in the crypto market, as shown here, involves careful monitoring of price movements for a robust entry and exit strategy.
Example 3: W Pattern in Forex
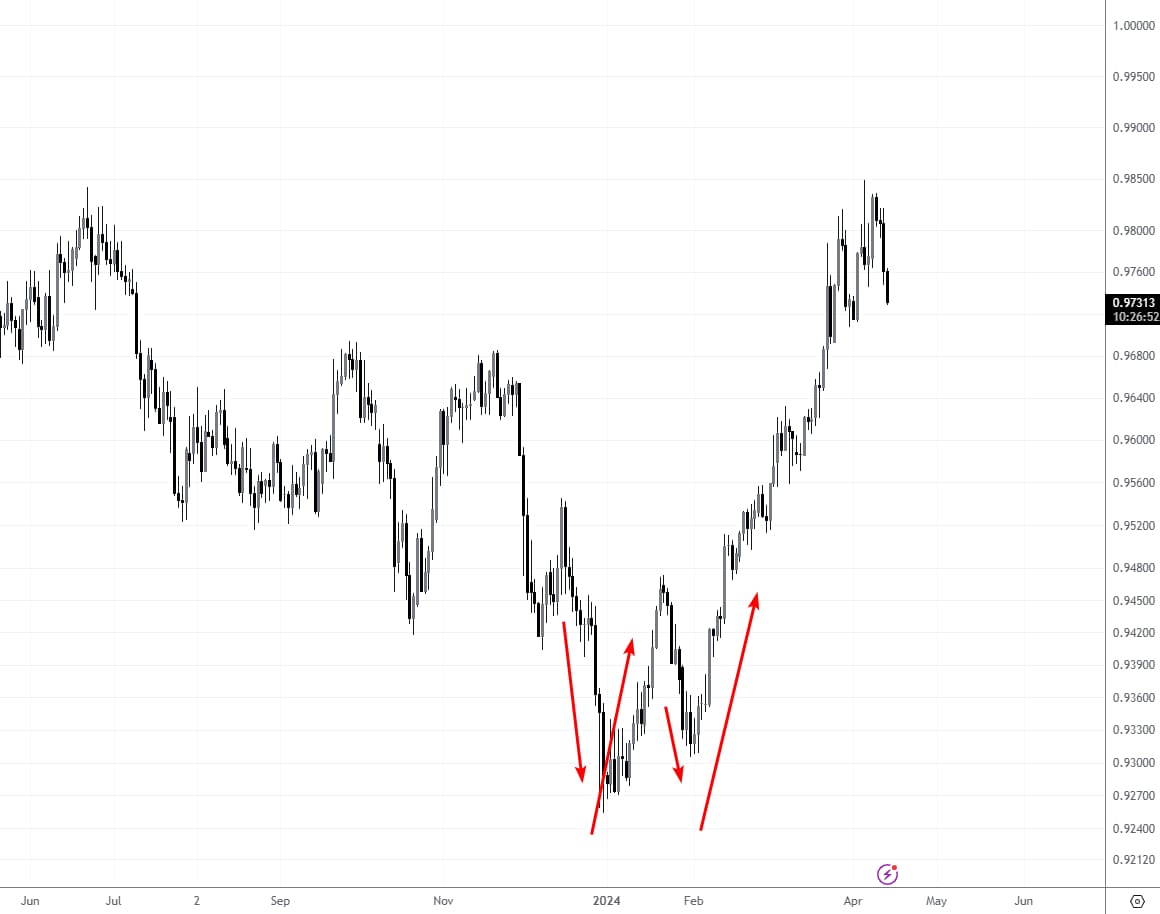 EUR/CHF chart showing a W pattern
In this Forex example, we observe the EUR/CHF on a daily chart, where a W pattern took shape. This pattern is characterized by a drop in price that forms the first trough below 0.930, an ascent to a peak, followed by a second drop, and a rebound that aims to surpass the peak level.
On the right side of the chart, we see positive price action following the W pattern. A trader watching this pattern develop would prepare for a potential bullish reversal upon the price breaking above the resistance at the peak of the W.
In trading this pattern, a stop-loss would be judiciously placed below the second trough to minimize risk in case of a reversal failure. If the pattern were to complete successfully, the trader would set a profit target based on the height of the W, replicated above the breakout point. This image serves as a practical example of how a W pattern might present itself in Forex trading, with the added caveat of recognizing potential failures and managing risk accordingly.
Should I Trade W Pattern?
The W pattern, recognized for its double bottom, often signifies a potential shift from a bearish to bullish market sentiment and serves as a strategic tool for traders across various asset classes. However, whether to incorporate this pattern into your trading strategy requires careful consideration of its context, potential risk, and alignment with your trading goals.
The pattern’s effectiveness can vary depending on market conditions, volume, and the trader's experience in pattern recognition. Traders often use it in combination with other technical indicators to validate signals.
Benefits of Using W Pattern
Clear Entry and Exit Points: The breakout and troughs provide explicit signals for trade entry and stop-loss placements.
Risk Management: Well-defined stop-loss levels help limit potential losses.
Predictable Targets: The height of the pattern allows for straightforward profit target calculations.
Frequent Occurrences: The pattern appears often enough across markets, providing numerous trading opportunities.
Versatility: Applicable in stocks, Forex, and crypto trading with equal relevance.
Why Not to Trade W Pattern
False Signals: The pattern can produce false breakouts leading to losses.
Context-Dependent: It requires confirmation with other indicators, as it may not be reliable on its own. Accurate identification often requires considerable experience and skill.
Market Volatility: Can be less effective during high volatility, leading to misinterpretation.
Low R:R Ratio: Requiring an improvement in the ratio of risk to potential benefit.
Delayed Entry: Waiting for pattern completion may lead to missing early movement gains.
Expert Tip

Trading the W pattern is like surfing - you must catch the wave at the right moment. Patience is key, wait for the full formation and a confirmed breakout to ensure you're riding a wave, not caught in a ripple.
Traders must approach the W pattern with patience, discipline, and an awareness of the risks, such as false breakouts and the necessity of experience for accurate pattern identification. Incorporating this pattern into a broader, well-considered trading strategy can be a powerful asset for any trader's arsenal. I recommend using the W pattern together with other indicators. This will allow you to avoid incorrect determination of trends and false breakthroughs.
Conclusion
In summary, the W pattern stands out as a reliable tool for spotting bullish reversals across Forex, stocks, and cryptocurrencies, offering traders clear entry and exit strategies. Its visual double-bottom structure enables disciplined trade setups, as shown in practical examples like Microsoft and Litecoin, where precise breakouts signal strong upside potential. However, the effectiveness of the W pattern increases when combined with other indicators to filter false signals and manage risk, especially in volatile markets. Ultimately, mastering the W pattern equips traders with a strategic edge, but success hinges on patience, disciplined execution, and a willingness to wait for confirmed breakouts—turning fleeting chart shapes into real trading opportunities.
FAQs
What are common mistakes to avoid when trading the W pattern?
Can the W pattern be applied effectively on all timeframes?
How does trading volume influence the reliability of a W pattern?
What risk management techniques complement trading the W pattern?
Editors' Top Picks and Insights

Lindsey Graham death: U.S. senator’s crypto legacy

Tether under pressure: USDT in Europe, audit questions, and the fight for trust

Lean Ethereum: Why Buterin wants to rebuild the network

SK Hynix debuts on Nasdaq: Largest U.S. offering by foreign company

SpaceX falls out of orbit: Does anyone still want Musk’s stock?

The crypto IPO problem: How high-profile listings became investor traps
Related Articles
Team that worked on the article
Vuk stands at the forefront of financial journalism, blending over six years of crypto investing experience with profound insights gained from navigating two bull/bear cycles. A dedicated content writer, Vuk has contributed to a myriad of publications and projects.
Dr. BJ Johnson is a PhD in English Language and an editor with over 15 years of experience. He earned his degree in English Language in the U.S and the UK.
Mirjan Hipolito is a journalist and news editor at Traders Union. She is an expert crypto writer with five years of experience in the financial markets.
CFD is a contract between an investor/trader and seller that demonstrates that the trader will need to pay the price difference between the current value of the asset and its value at the time of contract to the seller.
Uptrend is a market condition in which prices are generally rising. Uptrends can be identified by using moving averages, trendlines, and support and resistance levels.
Swing trading is a trading strategy that involves holding positions in financial assets, such as stocks or forex, for several days to weeks, aiming to profit from short- to medium-term price swings or "swings" in the market. Swing traders typically use technical and fundamental analysis to identify potential entry and exit points.
An investor is an individual, who invests money in an asset with the expectation that its value would appreciate in the future. The asset can be anything, including a bond, debenture, mutual fund, equity, gold, silver, exchange-traded funds (ETFs), and real-estate property.
Risk management is a risk management model that involves controlling potential losses while maximizing profits. The main risk management tools are stop loss, take profit, calculation of position volume taking into account leverage and pip value.

-
 Afghanistan
-
 Albania
-
 Algeria
-
 Angola
-
 Argentina
-
 Armenia
-
 Australia
-
 Austria
-
 Azerbaijan
-
 Bahamas
-
 Bahrain
-
 Bangladesh
-
 Belarus
-
 Belgium
-
 Bolivia
-
 Botswana
-
 Brazil
-
 Brunei
-
 Bulgaria
-
 Cambodia
-
 Cameroon
-
 Canada
-
 Chile
Chile
-
 China
China
-
 Colombia
-
 Congo
Congo
-
 Costa Rica
-
 Cote d'Ivoire
-
 Croatia
-
 Cuba
Cuba
-
 Cyprus
-
 Czechia
-
 DR Congo
-
 Denmark
-
 Dominican Republic
-
 Ecuador
-
 Egypt
Egypt
-
 El Salvador
-
 Estonia
-
 Eswatini
-
 Ethiopia
-
 Finland
-
 France
-
 Georgia
-
 Germany
-
 Ghana
Ghana
-
 Greece
-
 Haiti
Haiti
-
 Hong Kong
-
 Hungary
-
 India
India
-
 Indonesia
-
 Iran, Islamic republic
-
 Iraq
Iraq
-
 Ireland
-
 Israel
-
 Italy
Italy
-
 Jamaica
-
 Japan
Japan
-
 Jordan
-
 Kazakhstan
-
 Kenya
Kenya
-
 Korea
Korea
-
 Kuwait
-
 Kyrgyzstan
-
 Laos
Laos
-
 Latvia
-
 Lebanon
-
 Lesotho
-
 Libya
Libya
-
 Lithuania
-
 Luxembourg
-
 Madagascar
-
 Malaysia
-
 Malta
Malta
-
 Mauritius
-
 Mexico
-
 Moldova
-
 Mongolia
-
 Montenegro
-
 Morocco
-
 Mozambique
-
 Myanmar
-
 Namibia
-
 Nepal
Nepal
-
 Netherlands
-
 New Zealand
-
 Nigeria
-
 North Macedonia
-
 Norway
-
 Oman
Oman
-
 Pakistan
-
 Palestine
-
 Panama
-
 Papua New Guinea
-
 Paraguay
-
 Peru
Peru
-
 Philippines
-
 Poland
-
 Portugal
-
 Puerto Rico
-
 Qatar
Qatar
-
 Reunion
-
 Romania
-
 Rwanda
-
 Saudi Arabia
-
 Serbia
-
 Singapore
-
 Slovakia
-
 Slovenia
-
 Somalia
-
 South Africa
-
 Spain
Spain
-
 Sri Lanka
-
 Sweden
-
 Switzerland
-
 Syria
Syria
-
 Taiwan
-
 Tajikistan
-
 Tanzania
-
 Thailand
-
 Trinidad and Tobago
-
 Tunisia
-
 Turkey
-
 UAE
UAE
-
 Uganda
-
 Ukraine
-
 United Kingdom
-
United States
-
 Uruguay
-
 Uzbekistan
-
 Venezuela
-
 Vietnam
-
 Yemen
Yemen
-
 Zambia
-
 Zimbabwe
- Forex
- Crypto
