Triple top pattern in trading | Beginner’s guide
The importance of pattern trading is a given. However, it is useful to highlight the opportunities technical analysis patterns provide to traders. In this article, we will learn how to identify the triple top pattern, one of the most popular patterns among professional traders, and how to use it to improve trading results in the foreign exchange market.
What is a triple top pattern?
Price charts of all instruments traded on global exchanges sooner or later form various patterns that predict either trend continuation or its reversal. The triple top pattern is used to predict a trend reversal. The pattern is formed when the bulls are no longer able to push the price of the instrument higher, and the bears begin to take control of the situation.
In this case, the chart shows attempts by bulls to breakthe resistance, but their attempts are unsuccessful. After a while, the price breaks the support level and begins to move downward. The breakout of support level occurs when the price of an asset creates three peaks (highs) at about the same level. There are pullbacks between the peaks to the support line, hence the figure's name Triple Top. It is important not to confuse it with the Head and Shoulders, which is also a reversal figure, but with the second peak much higher than the first and third.
Because the Triple Top pattern is a technical analysis reversal figure, it should only be formed within a pronounced long-term uptrend, while the figure should be formed within three to six months. Otherwise, a trader may fall into a trap, i.e., sell the instrument not on a reversal, but on consolidation before resistance breakout and upward trend continuation.
It is unlikely that there will be those who want to lose money because of an unfortunate mistake, so you should mindfully read the review of the triple top pattern prepared by TU experts.
The Triple Top pattern is shown in the diagram below:
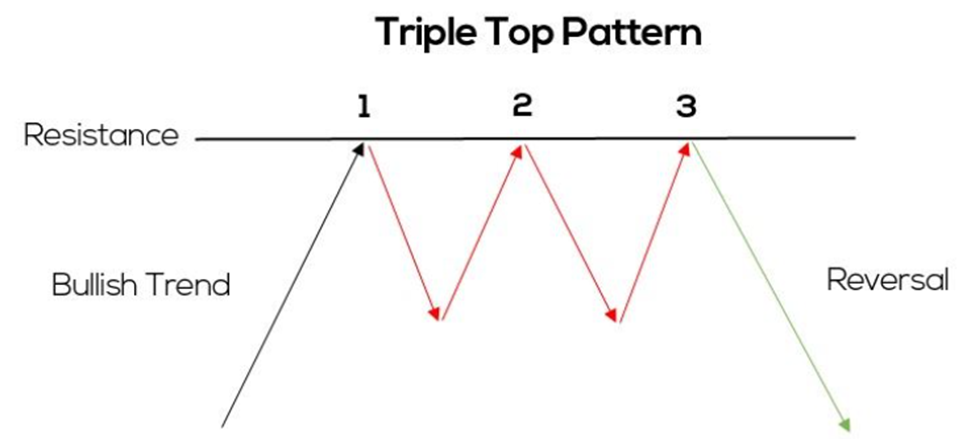
The Triple Top pattern
The diagram shows how, within the bullish trend, the price of an asset reaches horizontal resistance, i.e., an accumulation of sell offers from bears trying to take control of the situation. Following each touch of horizontal resistance, the price rolls back to horizontal support, i.e., the accumulation of bids from bulls, also known as the "neckline”, before once again hitting the top of the formed trading range.
After the third resistance is reached, the price breaks the support, and the asset price earn profit by recognizing the pattern in time and selling the asset.
To summarize, Traders Union will highlight the following shaping stages of the Triple Top pattern:
1. Pronounced upward trend;
2. Horizontal resistance and horizontal support levels;
3. Three peaks touching the resistance line, followed by pullbacks to the support line;
4. Breakout of the support line;
5. When the price of an asset pulls backto the breakout level, the former support line acts as resistance.
Notably, there is almost never aperfect horizontal line of both support and resistance. Some of the peaks may be slightly higher, and on the pullback, the price may either fall slightly short of the support line or slightly below it for a short time, i.e., form a false breakout.
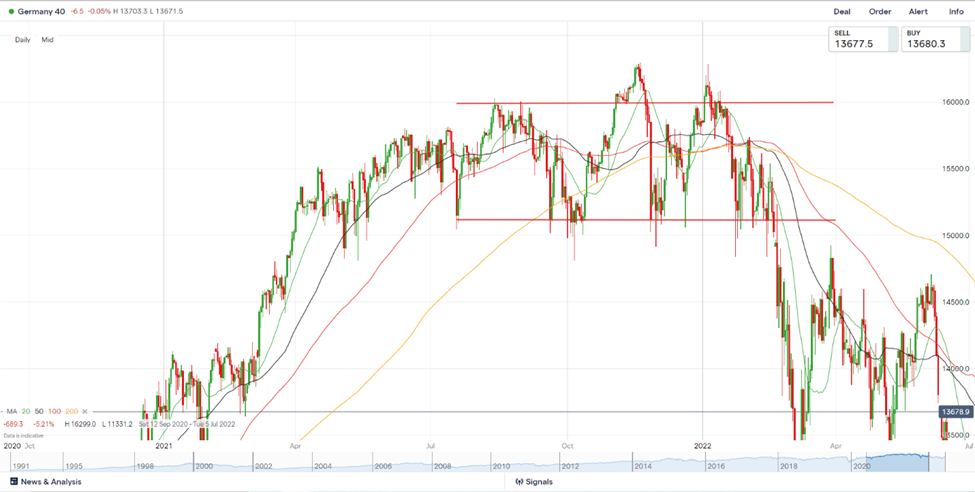
Two false breakouts of resistance
As we can see in the example of the Germany 40 index (DAX), there are two false breakouts of resistance, i.e., the price going above the upper edge of the consolidation range, while the shadows of the candles are below the horizontal support line.
How to trade using the triple top pattern
As the Triple Top figure is formed against a fading upward trend, and it is a reversal one, it is naturally used to identify an upward trend reversal and open a short position hoping to catch the development of a downward trend almost at its very beginning.
Unsuccessful attempts of the bulls to break resistance point to the defensive strength of the bears, and, consequently, the strength of the levels the price of an asset came to rest against. Capacity of bears to break the support, in turn, indicates lack of interest to buy, and, accordingly, the weakness of the support levels. Nonetheless, after the support level breakout, stop loss orders of the bulls are triggered, which only intensifies the downward momentum.
Trading strategies using the triple top pattern
Any trading strategy using the Triple Top reversal pattern is based on the assumption that the price of an instrument has reached its high, and the bears are ready to "force" the price down. The optimal way is to open a sell position after breakout of the support line. There are several options, which are described below.
Opening a position below the support line
The first option is to open a short position slightly below the support line after the last candle closes. This way, a trader will have a position at the best possible price, although also risking encountering a false breakout and then watching in horror as the price reverses and moves toward resistance. That is a moment, when a trader will have to make a difficult decision, made even more difficult by their state of panic.
By placing a protective stop-loss order above the broken level, a trader will incur a relatively small loss. However if the price does not continue to fall, the state of panic may grow into a hysteria,intensified by a surge of greed and despair as a result of the loss and lost profits.
Selling on a pullback to the broken support level
This is a strategy when a trader patiently waits for the breakout of the support, and then watches for a while how the price goes down. A patient trader may be rewarded with a pullback to the broken level, where they can enter the market by opening a short position and turn a good profit.
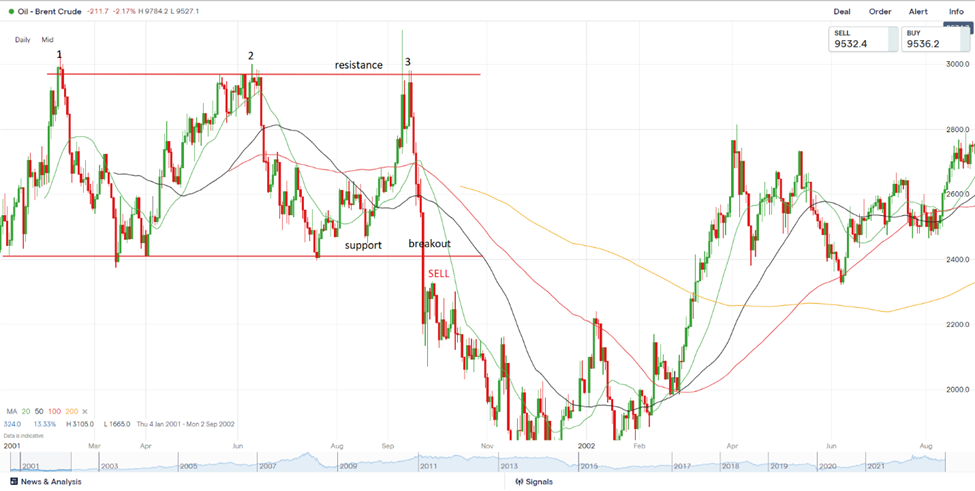
Triple top pattern on the Brent Crude chart
In the example above, Brent Crude quotes tested the resistance line three times and then tested the support line after each pullback. After the third time, the support line was broken, and a short position could be opened on the pullback. The potential estimated profit target is the width of the consolidation range, while a protective stop loss order is placed above the broken support line. In this case, the range consolidation lasted about seven months, and the drop in quotess lasted two months before the upward dynamics resumed. This is a situation when a trailing stop loss order can come in handy.
As usualy, there is a fly in the ointment. So in the case of this strategy, when working with the triple top pattern, after breaking the support level, the price can continue to slide lower and lower. As a result, the trader will have a lost profit, but the absence of a loss will be a consolation prize.
How to use the triple top pattern more effectively
Because there is no single 100% working figure of technical analysis due to the volatile nature of financial and commodity markets, traders face a difficult and critical task: identifying a pattern and using it effectively with the highest degree of "triggering" probability.
To do this, you can employ additional technical analysis indicators, in particular moving averages, namely their crossing. Because of the delay, the 50-day or 200-day MA is unlikely to be visible from top to bottom during the breakout of the intersection support. On the other hand, if the 50-day MA crossed the 100-day (or 200-day) MA during the pullback, this may be additional confirmation that the reversal, and the sale on this pullback has a high chance of success.
One of the most reliable confirmations of an uptrend reversal and a breakout of the support line will be the fading of fluctuations at the support line after the third peak on the resistance line. This could indicate that the bears have accumulated volume before the breakout, as well as that the bulls are unable to return the price to the highs.
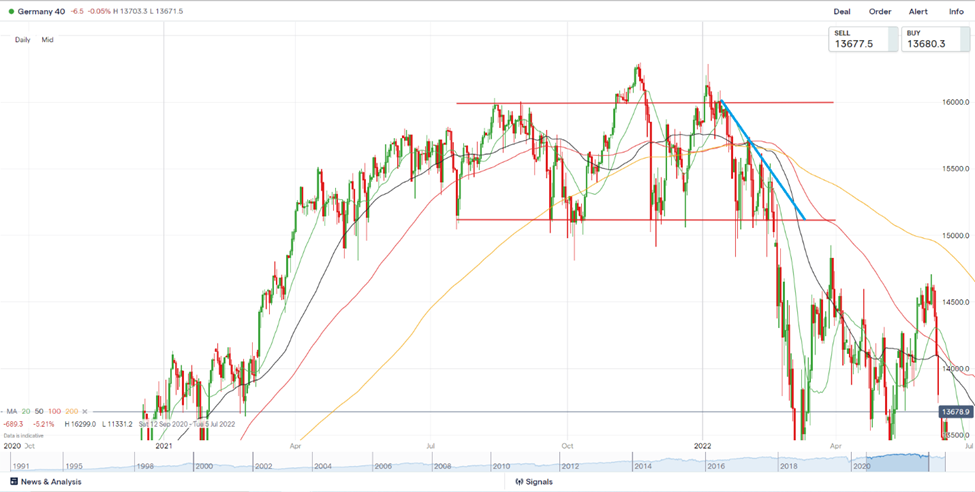
Triple top pattern on the Germany 40 chart
As we can see on the same Germany 40 chart, the breakout of the support line was preceded by fading of fluctuations. In other words, the tops became lower and lower, which, in general, indicates an increase in bearish pressure. It should also be noted that the fading of fluctuations is possible below the support line after its breakout. For example, the fading of fluctuations in the direction of the resistance line, i.e., when the bottom lines on the chart continue to rise, leads to the shaping of another pattern, which in this case is most likely a trend continuation figure.
To avoid going against the ongoing uptrend, it makes sense to assess the situation over a broader timeframe. For example, if you anticipate the formation of a Triple Top on the 4H chart, you should examine the situation on the daily chart; if a pronounced trend is visible on it, a Triple Top is unlikely to form.
If there is a situation where the third peak is above the resistance line and the previous peaks on the price chart, then this figure is very unreliable, though, after a false breakout at the third peak, a breakout of the support line is also possible.
In breakout trading, a protective stop loss order is usually set at some distance above the broken support line, and as downward movement develops, the possibility of setting a trailing stop loss order should be considered. The risk/reward ratio in trading using a pattern is at least 1x3.
Best Brokers 2024


Conclusion
The Triple Top pattern is a fairly effective technical analysis tool, and for experienced traders, it provides an excellent opportunity to open a profitable trade with minimal risk. Of course, this pattern, like all technical analysis tools, should be used in conjunction with other technical analysis tools, and it is also necessary to monitor the fundamental factors that drive certain movements.
This pattern, especially today, is observed quite rarely, so traders should not focus on its search and identification. By focusing solely on this pattern, you risk missing out on other interesting opportunities and potential earnings.
FAQ
What is the Triple Top pattern?
The Triple Top pattern is formed when the bulls are unable to break the resistance level on the price chart of an asseton three attempts, and when, after the third attempt, the support line is broken.
Is the Triple Top pattern a trend reversal or continuation pattern?
The Triple Top is always a reversal pattern.
What trading strategy is used with the Triple Top pattern?
A breakout trading strategy. In this case, the most common strategy is the support level breakout.
What is the disadvantage of the Triple Top pattern?
The disadvantage is that its formation occurs quite rarely, and waiting for confirmation takes a long time.
Glossary for novice traders
-
1
Cryptocurrency
Cryptocurrency is a type of digital or virtual currency that relies on cryptography for security. Unlike traditional currencies issued by governments (fiat currencies), cryptocurrencies operate on decentralized networks, typically based on blockchain technology.
-
2
Options trading
Options trading is a financial derivative strategy that involves the buying and selling of options contracts, which give traders the right (but not the obligation) to buy or sell an underlying asset at a specified price, known as the strike price, before or on a predetermined expiration date. There are two main types of options: call options, which allow the holder to buy the underlying asset, and put options, which allow the holder to sell the underlying asset.
-
3
Short selling
Short selling in trading involves selling an asset the trader doesn't own, anticipating its price will decrease, allowing them to repurchase it at a lower price to profit from the difference.
-
4
Upward Trend
Uptrend is a market condition in which prices are generally rising. Uptrends can be identified by using moving averages, trendlines, and support and resistance levels.
-
5
Index
Index in trading is the measure of the performance of a group of stocks, which can include the assets and securities in it.
Related Articles


Team that worked on the article

Oleg Tkachenko is an economic analyst and risk manager having more than 14 years of experience in working with systemically important banks, investment companies, and analytical platforms. He has been a Traders Union analyst since 2018. His primary specialties are analysis and prediction of price tendencies in the Forex, stock, commodity, and cryptocurrency markets, as well as the development of trading strategies and individual risk management systems. He also analyzes nonstandard investing markets and studies trading psychology.
Also, Oleg became a member of the National Union of Journalists of Ukraine (membership card No. 4575, international certificate UKR4494).

Dr. BJ Johnson is a PhD in English Language and an editor with over 15 years of experience. He earned his degree in English Language in the U.S and the UK. In 2020, Dr. Johnson joined the Traders Union team. Since then, he has created over 100 exclusive articles and edited over 300 articles of other authors.

Mirjan Hipolito is a journalist and news editor at Traders Union. She is an expert crypto writer with five years of experience in the financial markets. Her specialties are daily market news, price predictions, and Initial Coin Offerings (ICO).
