The head and shoulders pattern: How to spot and apply it
For good reasons head and shoulders (SHS or HS for short) is among the most popular technical analysis patterns for traders in various markets such as Forex, crypto, stock, and others.
Internationally known analyst Thomas Bulkowski analyzed 431 head and shoulders patterns on daily charts of 500 stocks from 1991 to 1996. In 2000, he confirmed that the pattern indicated an increased probability of a subsequent price decline. Only seven percent of the SHS patterns he identified were not accompanied by a price decline, and the average price decline was twenty-three percent. The time to reach the ultimate limit was three months on average.
A study called “The Predictive Power of 'Head-and-Shoulders' Price Patterns in the U.S. Stock Market” published in the Journal of Financial Econometrics (Gene Savin, 2007) confirms that the pattern has economically significant predictive value, although there is currently no satisfactory theoretical explanation to the question, “Why does the pattern work?”.
The research and analyses confirm the importance of the pattern for traders, so read the article carefully. It is based on the experience of professional traders working with the Traders Union.
Content:
How to spot a pattern, pattern composition;
Varieties of the pattern;
Examples on charts;
How to use indicators to spot the pattern;
Pros and cons;
Analysis of a real transaction;
How to apply the pattern when trading;
Signals to enter and exit a position.
How to trade inverted head and shoulders in forex trading
Course for Beginners Traders by TU
What is a head and shoulders pattern?
The head and shoulders pattern can help all traders due to its versatility. It can be used:
-
to construct trading strategies by novice traders;
-
by professionals to improve the accuracy of entry points;
-
by intraday traders and investors because the pattern works on lower and higher time frames;
-
to find short and long positions (inverse head and shoulders pattern).
The head and shoulders pattern is also used to spot reversals in the market. Therefore, if you are extremely interested in trading setups in the direction of the main trend, then you can use the pattern on the lower periods to identify the end of a pullback and a reversal in the direction of the main trend.
What is the composition of the head and shoulders pattern? The head and shoulders pattern vaguely resembles a human figure, hence the name. The head and shoulders pattern scheme is illustrated below:
Head and Shoulders Pattern
The pattern consists of:
-
the first peak, which is called the "left shoulder";
-
the second peak which is called the "head";
-
the third peak which is called the "right shoulder";
-
A line connecting the bases between the 3 peaks is called the "neckline".
The pattern assumes that the price will decrease in the future. An important feature of the pattern is that:
-
The middle peak (or head) shall be higher than both shoulders;
-
The price shall be in a rising trend before the pattern appears.
For example, you see a formation of three peaks, and the second one is the highest, but the market is in a downtrend. Is this a good example of a pattern?
Head and Shoulders Pattern
No, this is a bad example for the head and shoulders pattern because it should mean the end of an ascending trend, and it really doesn't.
Types of head and shoulders patterns
There are two forms of the head and shoulders pattern:
-
The classic pattern, that gives a signal to sell;
-
The inverse pattern, that gives a signal to buy.
The inverse head and shoulders scheme is below.
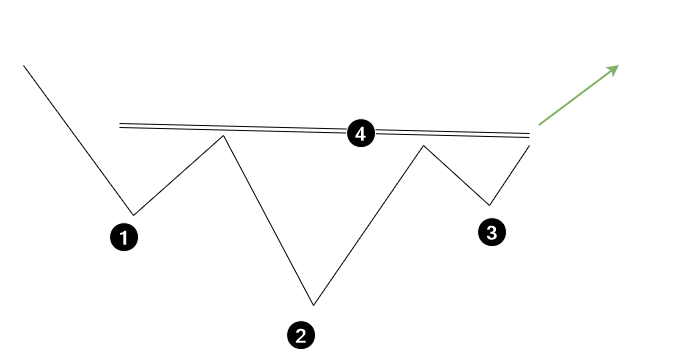
Inverse head and shoulders pattern
An inverse pattern is the reverse of the classic pattern. There should be a period of prices decreasing before the pattern appears, and the second minimum (the head) should be the lowest.
Examples of the head and shoulders pattern
An example of the classic head and shoulders pattern is on the daily chart below:
Classic head and shoulders pattern is on the daily chart
There was a sharp decrease in the price of a financial asset after the breakdown of the figure.
Below is an example of an inverse head and shoulders pattern:
Example of an inverse head and shoulders pattern
In this case, the inverse neckline is more horizontal, but this is a feature of the pattern. It is not always obvious, since it rarely appears in perfect proportions. Often intermediate extrema form a large slope of the neckline, which can mislead traders who would consider the pattern invalid.
What are the signals of the head and shoulders pattern and how to interpret them?
As was said before, head and shoulders is a reversal pattern. The fact that the right shoulder is below the head means that there is a shortage of buyers in the market. And it's getting harder and harder for the price to renew the peaks.
A shortage of buyers implies that sellers' activity should lower the price.
A break of the neckline is the classic signal to sell. Take the below example of a peak in the Alibaba stock market (NYSE:BABA).
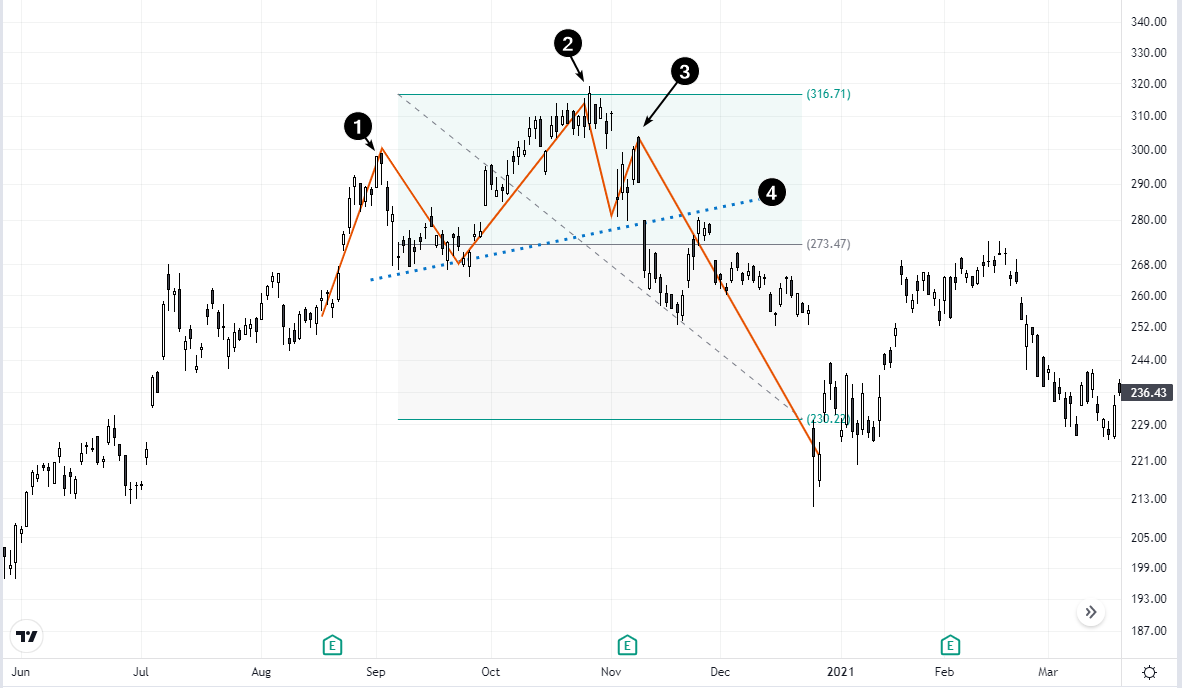
Head and Shoulders Pattern
For a long time, there was an ascending trend in the market.
But on September 2, the left shoulder (1) formed.
On October 27, the head (2) was formed and the price set a historical record of around $320 per share.
This was followed by a sharp decline with a gap, after which the right shoulder (3) was formed. Look closely, on the right shoulder there is a bearish absorption pattern, which consists of 2 candles, and the second bearish candle almost completely overlaps the body of the first bullish candle. This could be considered as the completion of the formation of the right shoulder and the entry into the short position.
Learn about best Forex candlestick patterns - Bullish & BearishA break of the neckline (4) is the classic signal. But in this example, it happened with a gap, because on November 10, 2020, there was news on the market that Chinese regulators could put pressure on Alibaba due to its monopolistic position.
Therefore, the break of the neckline was reinforced by the fundamental background and motivated to open a sell position immediately at the market opening.
When to close the short position?
The advantage of the head and shoulders pattern is that it allows you to project the objective point. To do this, subtract the distance from the head to the neckline down. The resulting level will be the target value to take profit. In the example above, it was around $230 per share, which was later "exceeded" as pressure by Chinese regulators on tech companies increased, and BABA stock decreased below $120 per share at the end of 2023.
Example of an inverted head and shoulders pattern as a signal indicator
Below is an example of an inverse head and shoulders pattern on the daily chart of Google stock (NASDAQ:GOOG). It shows the bottom of the decline that was caused by the spread around the world of the coronavirus in the spring of 2020.
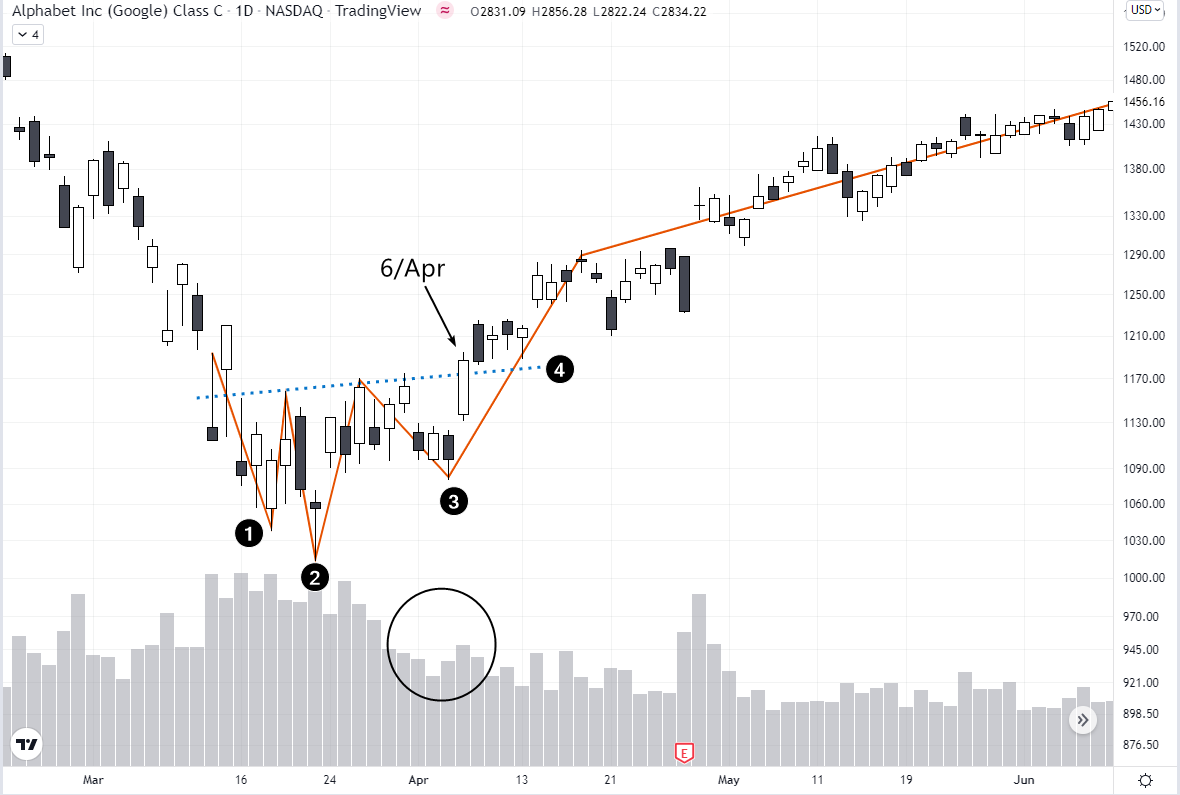
Head and Shoulders Pattern
The minimum marked at point 3 can be interpreted as the point at which there was a shortage of sellers in the market. This is confirmed by two indicators:
Volumes on the decline have decreased (evidence of weakening sales, circled)
The decrease to the minimum at point 3 is 50% of the increase from the minimum at point 2 to the neckline.
On April 6, the neckline was broken, which was a signal to enter the long position. During the following days, this line served as support, confirming that the reversal is complete and investors should be ready for further price growth.
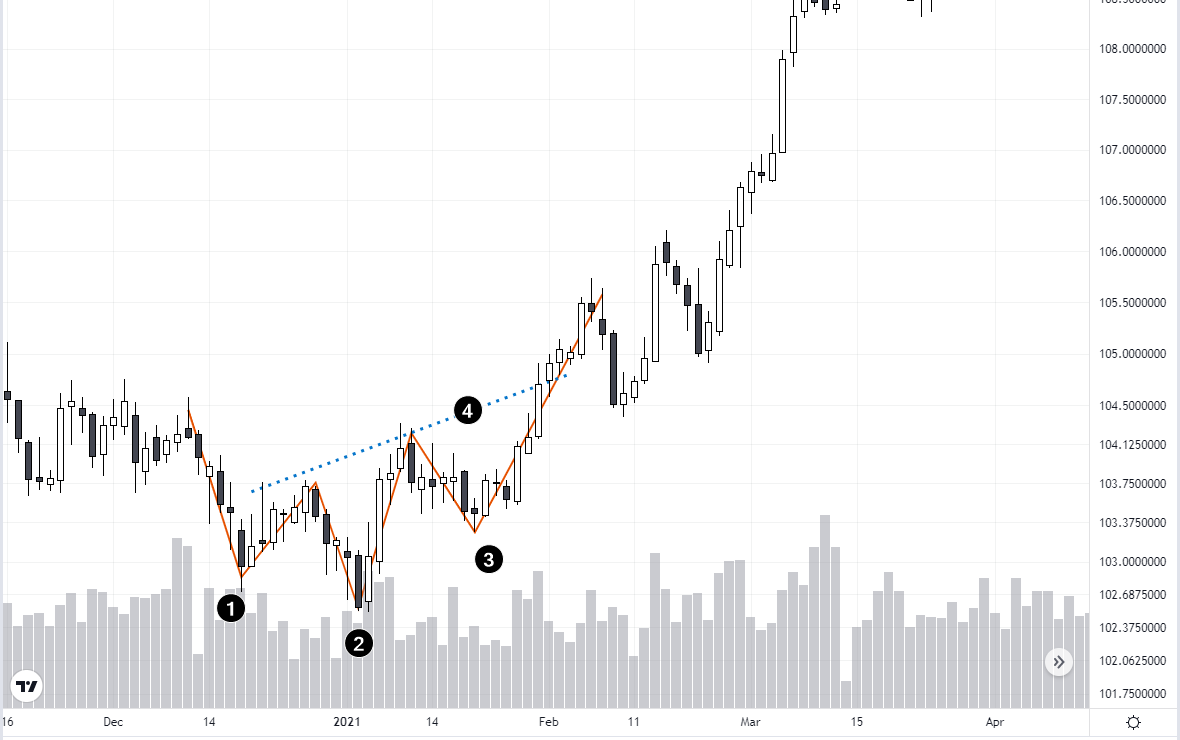
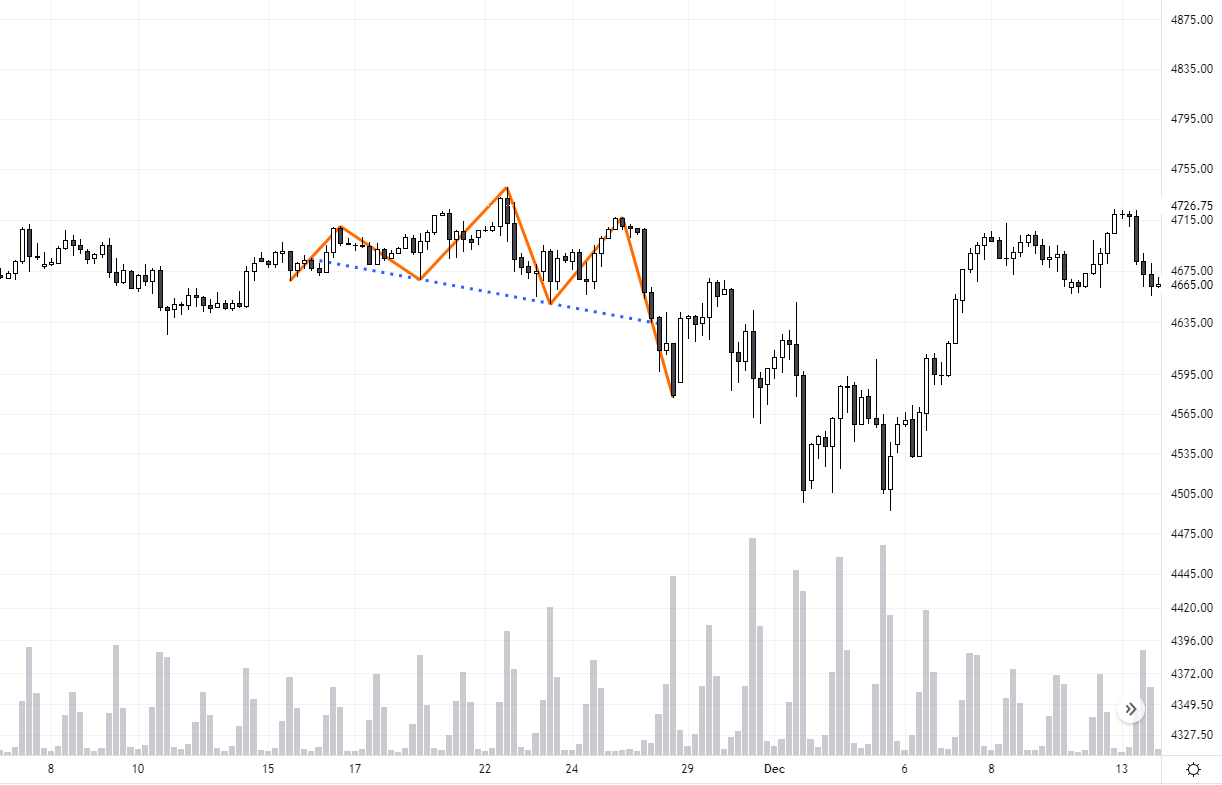
Can the signal be false?
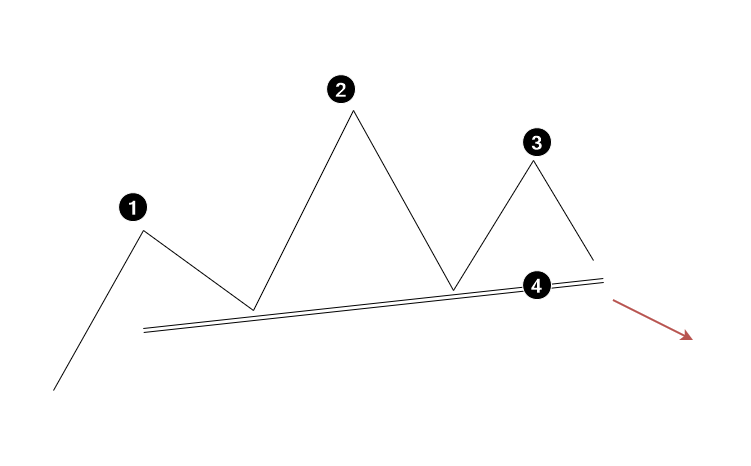
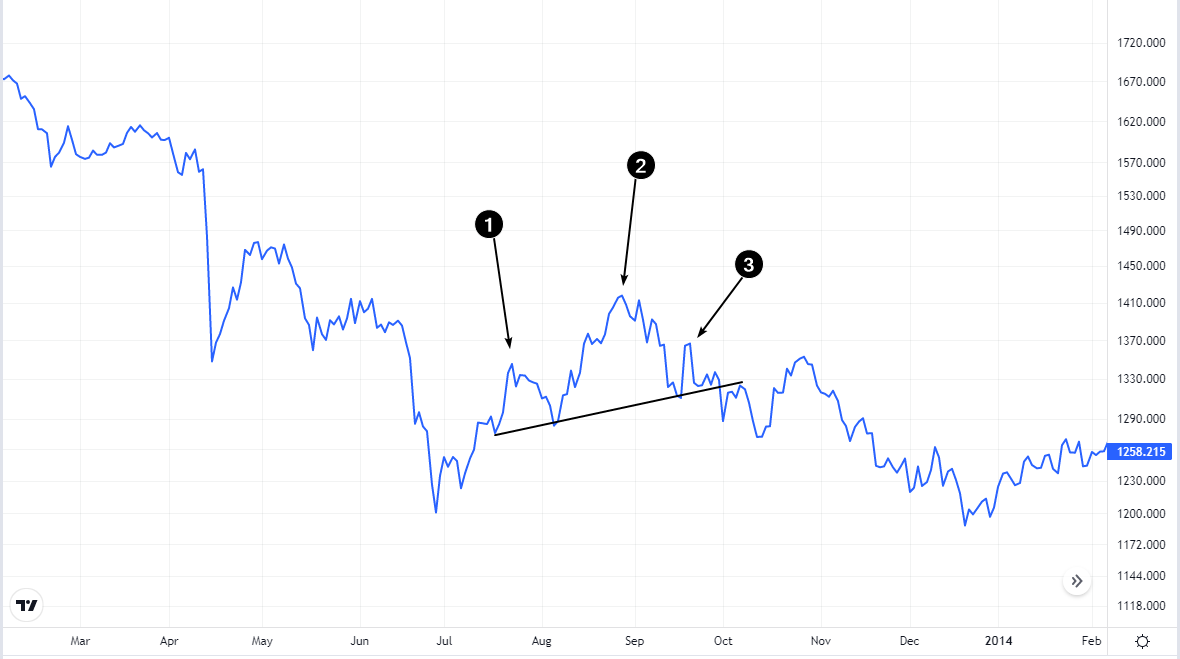
Yes. The chart below shows an example of a false sell signal given by the head and shoulders pattern.
Head and Shoulders Pattern
What might have alerted you when opening a sell trade?
First, there is no significant ascending trend in the market. Technically, higher peaks and limits are present but they do not represent a significant downtrend.
Second, the neckline repeatedly shows its strength at a time when a bearish breakout can be expected. The price bounces up from this line and attempts by sellers to push the price lower fail.
Therefore, before you open a trade, find more evidence of the correctness of your decision about the pattern.
How to confirm the head and shoulders pattern?
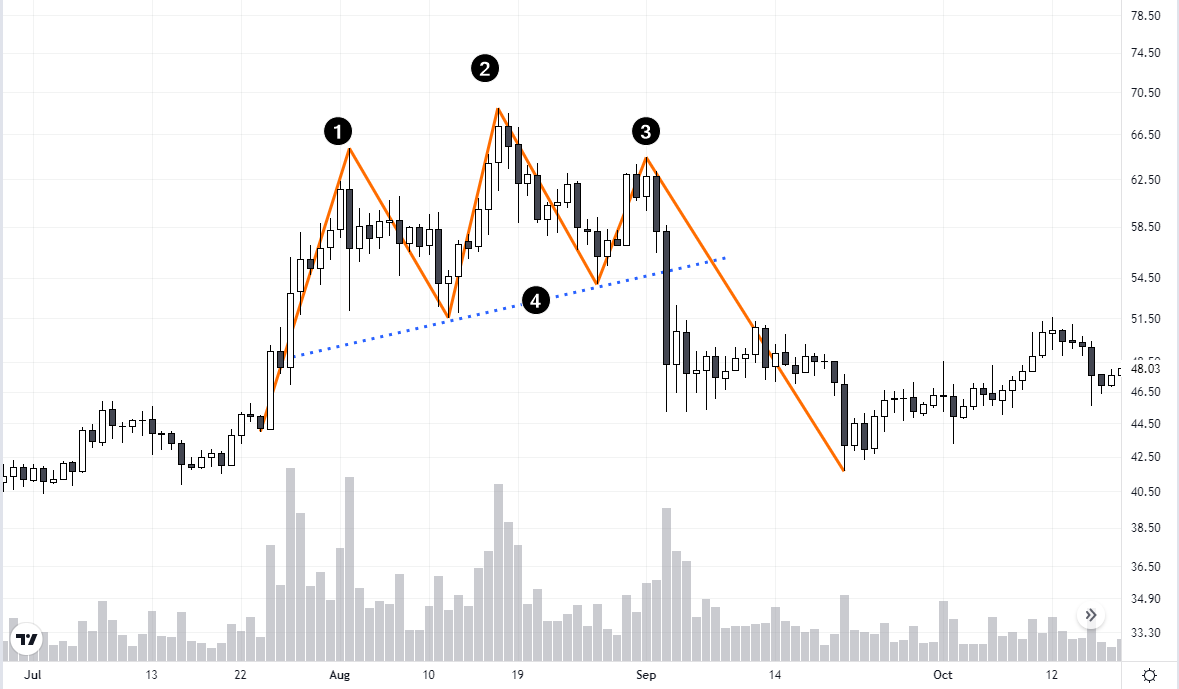
Perhaps the best way to confirm a pattern signal is to analyze the volumes by taking a closer look at the dynamics of the volumes on the chart above.
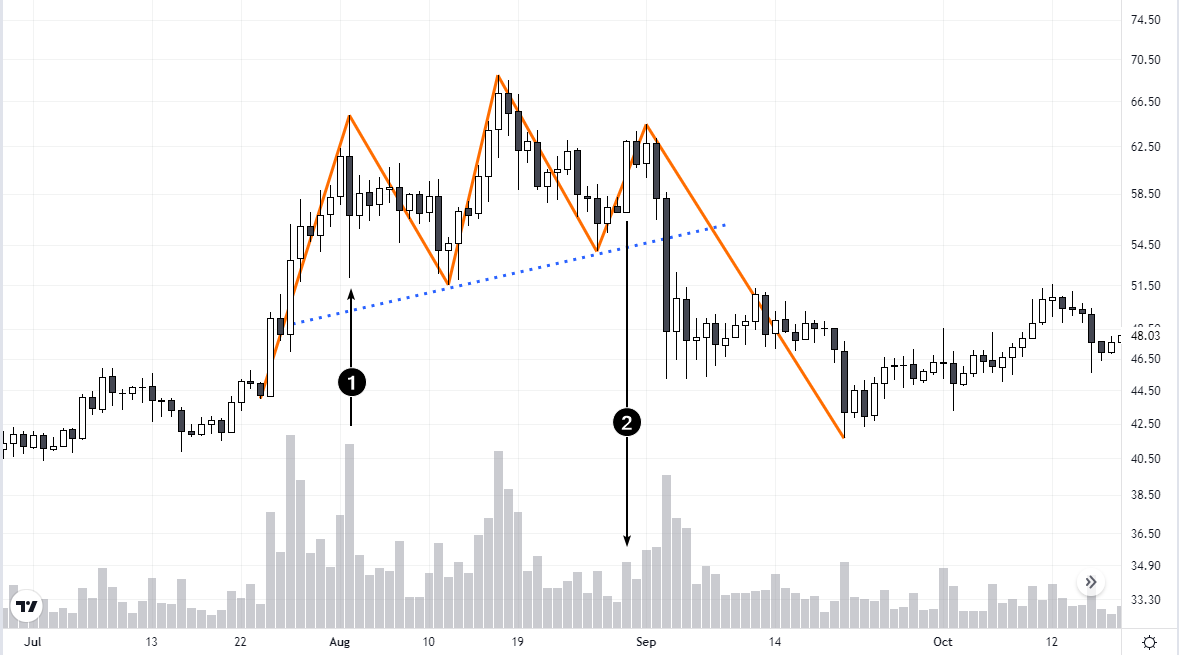
Head and Shoulders Pattern
Number 1 indicates a bearish candle, and compared to previous bearish candles, it has:
-
a large downward progression, and
-
a very large volume.
This can be interpreted as activated by the sellers. They closely followed the period of price growth, and when the quota exceeded the round level of 60, they came to the market with orders to sell. As a result, there is a sharp decline in high volumes.
The second peak (the head) is not much higher than the left shoulder. By the nature of the movement, it is more of a trap, which draws buyers into bad positions and activates stop-losses placed by sellers above the left shoulder.
The subsequent downward movement almost completely negates the progress made on the increase from the neckline to the second peak.
The growth to the third peak (right shoulder) occurs on low volumes (as shown by number 2). This means that activity by the buyers has subsided. And traders who carefully read the volumes and follow the formation of the head and shoulders pattern can enter the shorts before the breakdown of the neckline occurs.
Putting down the height of the pattern from the neckline, you can get a reference point for the target price of around 42.50.
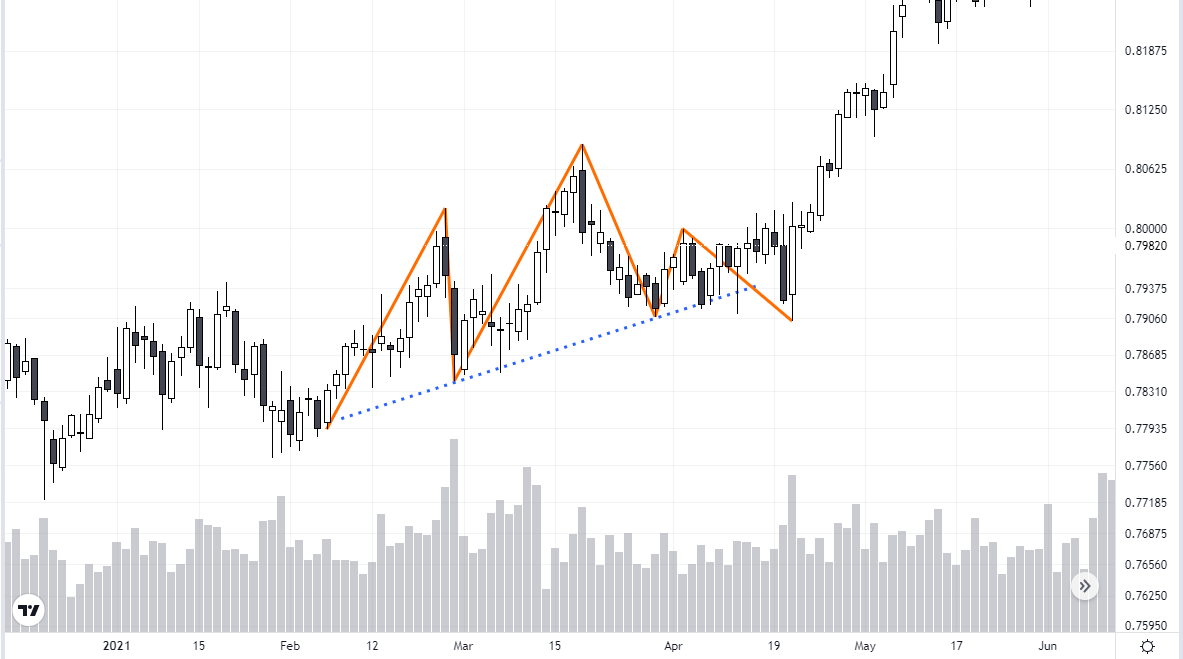
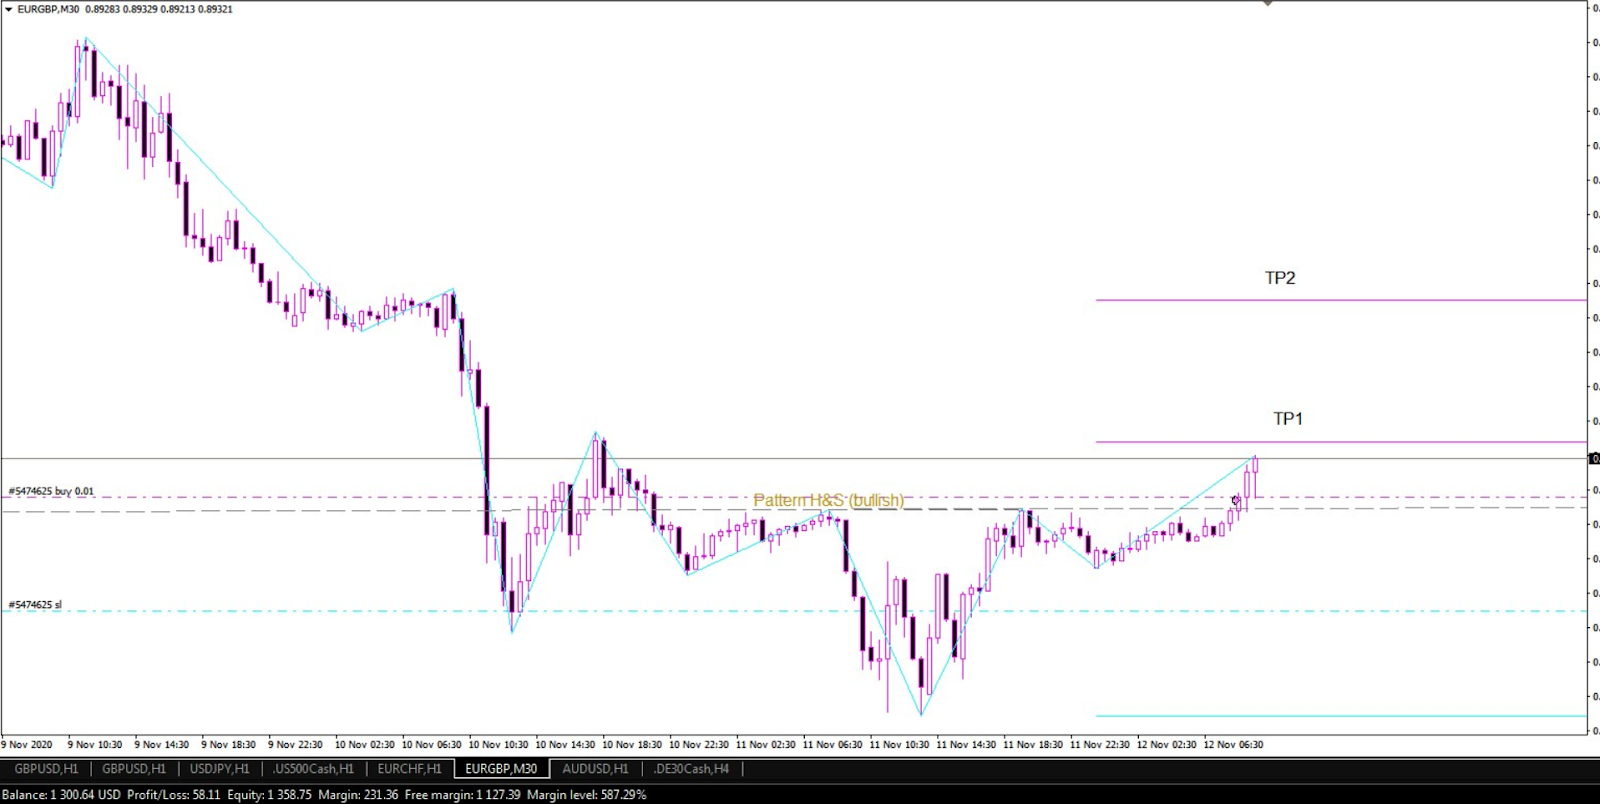
Entry and exit points for the head and shoulders pattern
Assume you are trading Forex and following the GBP/USD market. On the weekly chart, you have determined that there is an important support zone near the 1.32 level.
On the daily chart, you wait until (January 2023) the price decreases to this support level and, to enter a reverse long from the support line, focus on searching for the inverted head and shoulders pattern.
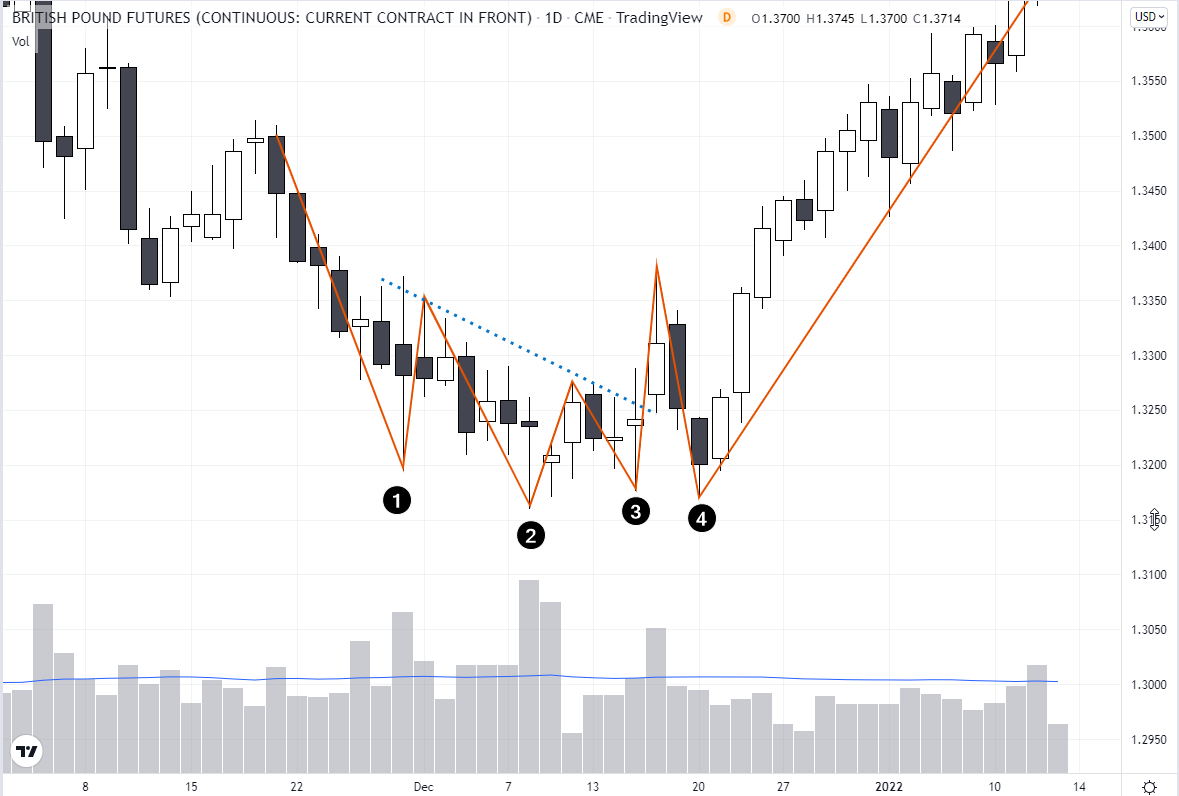
Number 1 indicates a candle with high volume and a long lower shadow. This is a sign that there are indeed buyers in the market where you expect them to be. You are assuming that this could be the first extremum in the pattern.
Next, you will see the price trying to fall below the first extremum, but candles with lower shadows and large volumes appear on the chart again. There is almost no progression of the decline below the first extremum. Buyers are very active near 1.32. You predict that December 8 (2) could be the second extremum in the inverse head and shoulders pattern.
After December 8, the daily limits form higher and higher. This suggests that buyers are warding off bad luck from a downward price move. Now you are looking for the place to draw the neckline, and you are also waiting for the formation of the third extremum.
The third extremum can be considered the limit of December 15 (marked with the number 3). It will be formed without breaking through the low mark with number 2. Assume that you can trade intraday, you buy GBP around 1.32 for a small volume. It is an early entry and you are depositing to build up the position later.
You put a stop below the low of the second peak.
On December 16, the neckline broke. You add a deposit for 1.33 to the long.
Then the time to worry comes, as the price decreases for two days, on December 17 and 20. You keep cool; as the volumes on the decline are less than average. Most likely, this is a manipulative move due to lower liquidity during the holiday season to remove buyers who put stops under the low marked by number 3 from the market. As it declines, you can reduce your position by taking a small loss that won't hurt your account.
The rapid rise that follows makes all standing. You use the trailing stop technique to keep the maximum from the ascending trend. The resulting profit compensates for possible losses from the move to the extremum marked with number 4.
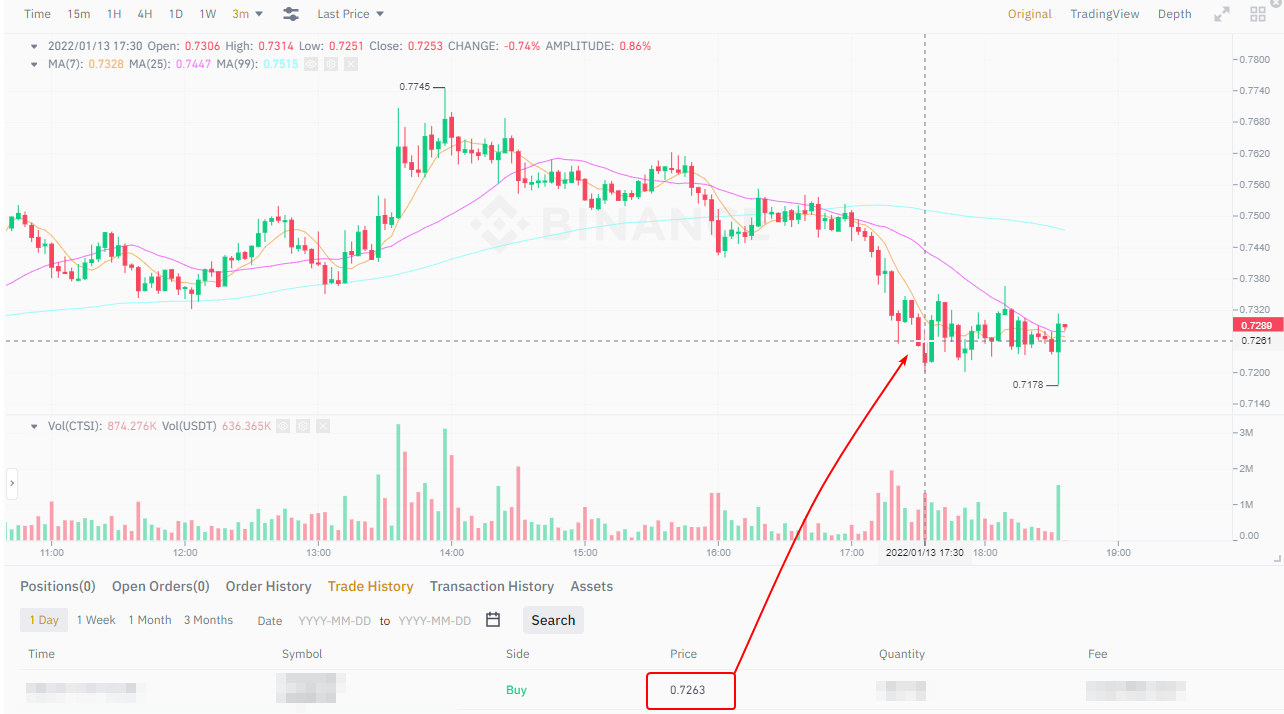
Analysis of a real transaction
Below you can find an example of a real trade executed by a professional trader cooperating with the Traders Union.
The trader noticed that the financial asset has been in an ascending trend for a long time and decided to search for signs of a reversal. The head and shoulders pattern allowed him to open a short position. It is noteworthy that there are long upper shadows on the peaks of the pattern. This is a sign that sellers are poised to actively sell off the asset as soon as its price increases.
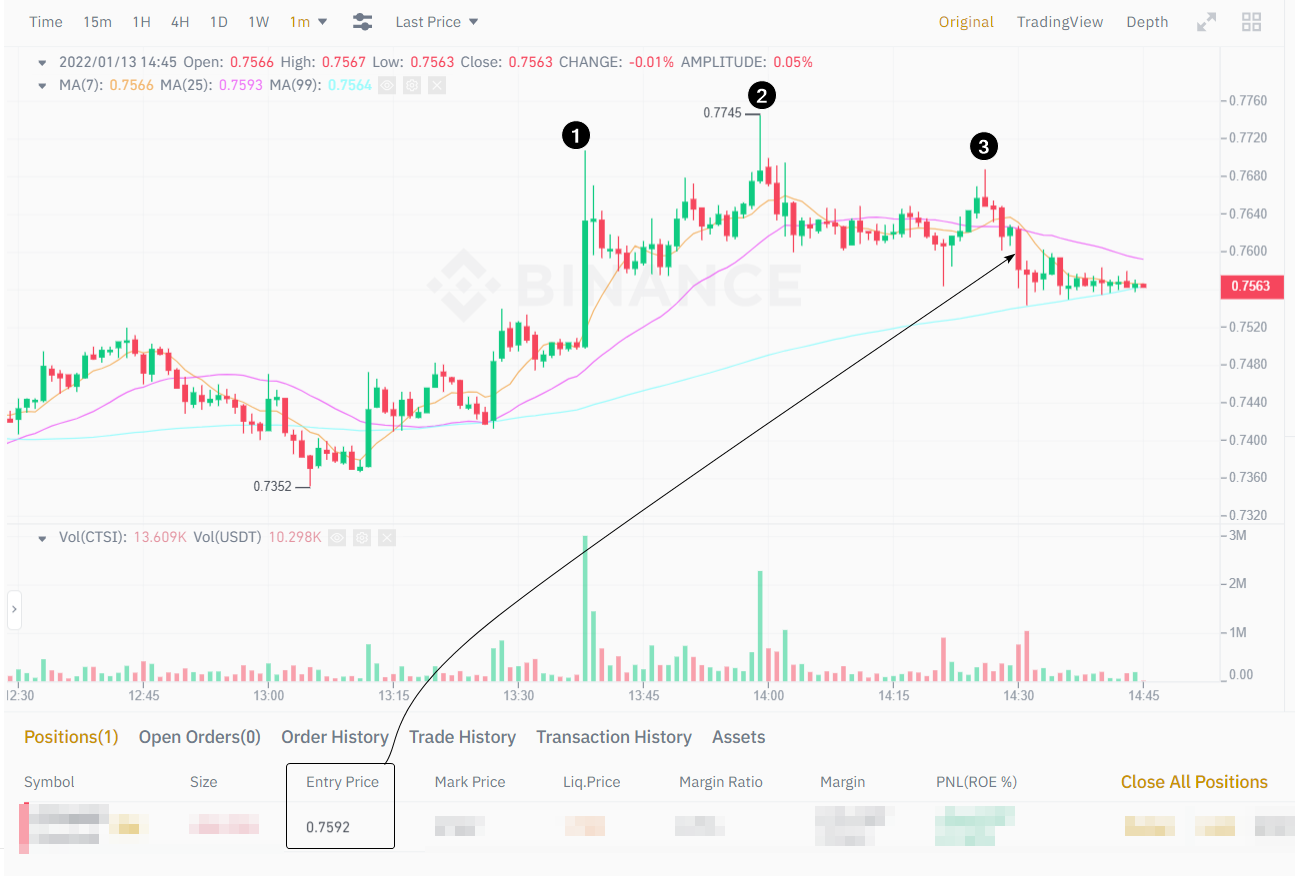
Head and Shoulders Pattern
Number 1 shows the formation of the left shoulder. However, the volume is abnormally high.
Number 2 shows the formation of the head.
If you consider the high volume on the rising candle that formed maximum number 2 as an effort by buyers, that effort produced a negative result. Strong markets don’t act this way. The ensuing flat indicates an "unwillingness" and/or inability of the market to update peaks. All you can do is wait and see the formation of the third peak (it is marked with number 3), and then make an entry into the short position (indicated by the arrow) on the breakout of the neckline. The stop is above the maximum of the head.
Head and Shoulders Pattern
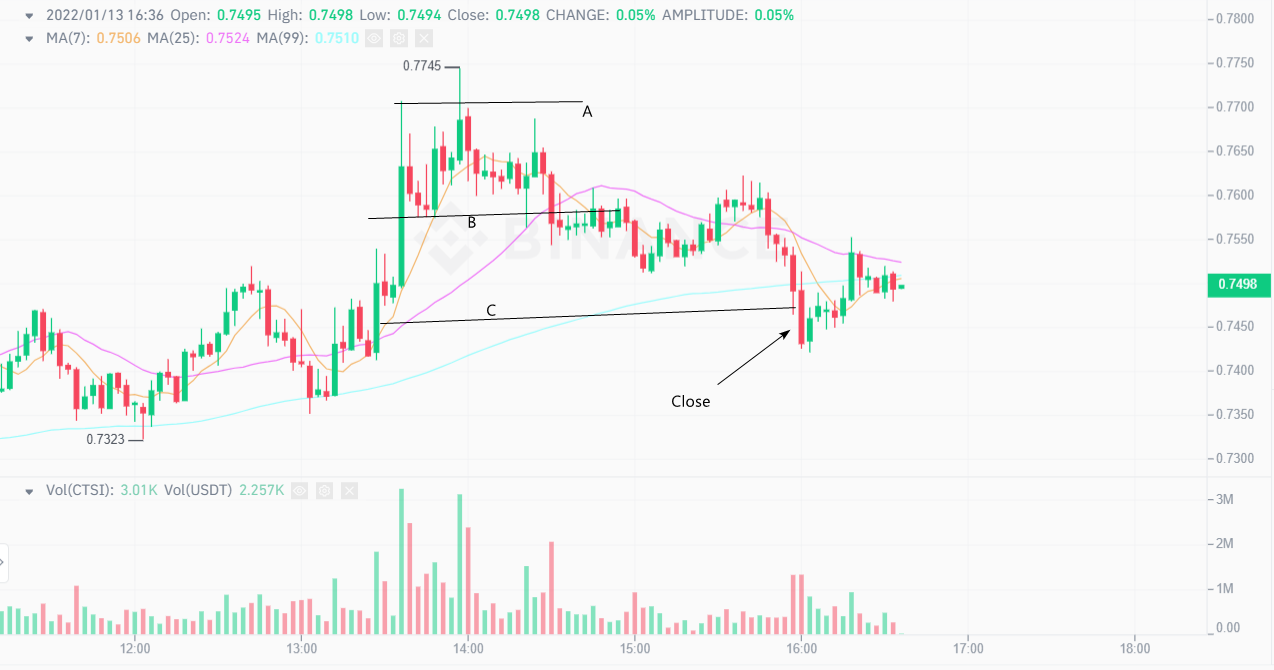
Partial profit retention took place when the target was reached at the level of C (AB=BC). The rest of the position was left for the long term, the stop was moved into the black.
Head and Shoulders Pattern
Later, the position was closed completely, since the trader's goals for the day were achieved.
Advantages and disadvantages of trading using the head and shoulders pattern
Despite the predictive power of the pattern, confirmed by studies, it cannot predict reversals with close to 100% accuracy.
👍 Advantages
• You can trade in different markets such as Forex, stocks, futures, and cryptocurrencies
• Works on different timeframes
• Available for novice traders
• The effectiveness of the pattern has been confirmed by research
• Ability to project an exit point from a position
• Ability to combine the pattern with technical analysis indicators and other tools
👎 Disadvantages
• Most patterns will have a nonideal shape
• Subjectivity. You can see a pattern somewhere, and others may not see it
How to trade on a pattern? | Expert advice
Keep track of volumes.
Measure Fibonacci levels. If the price pulls back down from the peaks by more than 50%, this means that the ascending trend is fading.
Evaluate the global trend. If an ascending trend prevails on the higher time frames, you should trade on the inverse head and shoulders pattern.
Keep a diary. Write down your motives, describing why you believed that the extremum you found is a part of the head and shoulders pattern. Why did you open/close the trade?
Practice using history. For example, run a strategy tester in the MetaTrader program. Adjust the speed at which the candles appear on the chart. Practice your pattern detection skills on a simulator.
Always set stop losses. If you don't protect your account, a loss from one wrong trade can ruin all the profits from the successfully spotted head and shoulders patterns.
Head and shoulders pattern search indicator
Since head and shoulders is a popular pattern, various solutions have been developed among traders to automatically search for patterns.
The solution for MetaTrader is provided below.
Head and Shoulders Pattern Indicator
There are also indicators for TradingView.
Head and Shoulders Pattern Indicator
The easiest way to detect head and shoulders patterns is probably the zigzag indicator, which is built into many trading platforms.
The Autochartist pattern scanner is worth mentioning as a separate point. It is built into MetaTrader as a plugin and is provided to its clients by some Forex brokers for free. The scanner monitors the markets and gives signals when a pattern is formed.
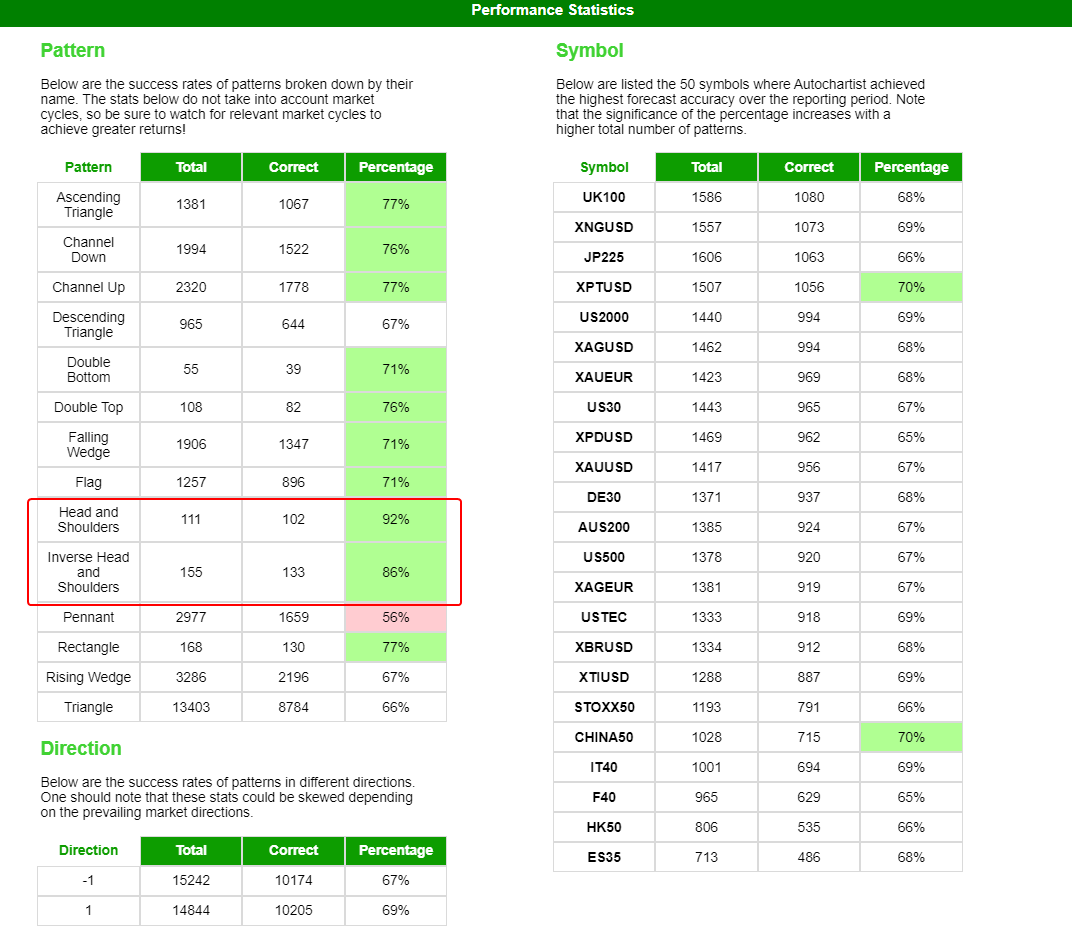
Head and Shoulders Pattern Statistics
The statistics kept by the scanner show that head and shoulders have the highest success rate among other patterns.
The best brokers for Forex trading
To learn and start trading the head and shoulders pattern, open an account with a broker.
IC Markets

Reliable licenses in Australia and Crete;
Fast order executions – less than 40ms, and free VPS;
Clients have access to Forex, stocks, commodity, and cryptocurrency markets;
The volume of transactions is more than $1 trillion a month;
Over 180 thousand traders worldwide;
Manual and algorithmic trading are available;
When trading with the ICMarkets broker, you can use the Autochartist service to track head and shoulders patterns.
RoboForex

On the market since 2009, and the market leader;
Over 4.5 million customers (as of 2020);
The minimum deposit is just $10;
Spreads are floating, from 0 pips (depending on the account type);
Clients have access to Forex, stocks, commodity, and cryptocurrency markets;
Possibility to trade twenty-four/seven (depending on markets);
Margin trading with leverage up to 1:50;
Free market analyses by experts;
Deposit bonus of $30 (check the viability of the campaign with support service)
Free demo accounts for novice traders.
When trading with a RoboForex broker, you can download plugins/advisors to the provided MetaTrader terminal to help you trade with head and shoulders patterns.
eToro

FCA (UK), CySEC (Cyprus) licenses, with offices in the USA and other countries;
Operational since 2007;
Best broker for social trading;
Minimum transaction volume for copying trades is $1;
Zero commissions (not in all markets);
Demo account for novice traders;
Leverage is up to 1:30 (you can increase income);
If you can’t profit from trading the head and shoulders pattern, you can take advantage of a powerful social trading service by copying the trades of selected successful traders to your account.
FxPro

FxPro serves clients from 2006 countries and its capital exceeds €100 million;
Headquartered in London; licenses from UK, Cyprus, and South African regulators;
Serves clients from 170 countries, executing about 7,000 trades per second;
Protection from negative balance;
You can trade on the Forex, futures, stock, commodities, and cryptocurrency markets;
Leverage is up to 1:500;
Spreads from 0.1 pips;
Cent accounts are available to reduce risks;
Free demo accounts without restrictions.
FxPro has great recognition confirmed by over 90 international awards.
FxPro Minimum Deposit And Account DetailsSummary
Head and shoulders is a well-known pattern that is used for classic technical analysis.
There is a regular pattern and an inverted one, both are effective; and are confirmed by statistical studies and practical trading by professionals.
The reason for the pattern formation is the gradual weakening of the powers that drove the previous trend. As well as the powers that are ready to start a new trend in the opposite direction.
Using the head and shoulders pattern will help you onto the path to consistent profits in the financial markets. But the most important thing is to observe the risks and proceed according to your own trading plan. Use demo accounts for training and cooperate only with verified brokers.
FAQs
Where should I place stop-loss orders when using the head and shoulders pattern?
There are 2 basic recommendations:
- over the head;
- over the right shoulder.
There is no wrong answer. The main thing is to keep your stop loss in mind and minimize risk according to your personal trading style.
What books to read about the head and shoulders pattern?
Read works by Peter Brandt. He has over 600,000 followers on Twitter. Peter is a veteran trader and uses classic patterns. And the head and shoulders pattern is his favorite. Peter is the author of these bestsellers:
- Trading Commodity Futures with Classical Chart Patterns
- Diary of a Professional Commodity Trader: Lessons from 21 Weeks of Real Trading
Both books have positive reviews.
Do the classic and inverted head and shoulders patterns have the same efficacy?
In theory, yes. But much depends on the market context where you are using the patterns. If the downtrend on the high timeframe is reversing, then the inverted pattern on the low timeframes will be stronger. Correspondingly, if an ascending trend is unfolding on the high timeframe, the classic pattern will be stronger on the low timeframes.
What should be the distance between the peaks of the head and shoulders?
Obviously, extrema cannot be located on neighboring candlesticks. At the same time, too large a distance between extremums implies the impacts between each other. There are no clear requirements for the proportions. Develop your skills to increase your accuracy of pattern detection.
Glossary for novice traders
-
1
Social trading
Social trading is a form of online trading that allows individual traders to observe and replicate the trading strategies of more experienced and successful traders. It combines elements of social networking and financial trading, enabling traders to connect, share, and follow each other's trades on trading platforms.
-
2
Algorithmic trading
Algorithmic trading is an advanced method that relies on advanced coding and formulas based on a mathematical model. However, compared to traditional trading methods, the process differs by being automated.
-
3
Expert Advisor
An Expert Advisor (EA) is a piece of software or script used in the MetaTrader trading platform to automate trading strategies. EAs are programmed to execute trading decisions based on predefined criteria, rules, and algorithms, allowing for automated and systematic trading without the need for manual intervention.
-
4
Cryptocurrency
Cryptocurrency is a type of digital or virtual currency that relies on cryptography for security. Unlike traditional currencies issued by governments (fiat currencies), cryptocurrencies operate on decentralized networks, typically based on blockchain technology.
-
5
Zigzag indicator
Zigzag indicator is used to filter out insignificant price movements. It points out whenever the price changes more than pre-specified rate of percentage.


Team that worked on the article

Oleg Tkachenko is an economic analyst and risk manager having more than 14 years of experience in working with systemically important banks, investment companies, and analytical platforms. He has been a Traders Union analyst since 2018. His primary specialties are analysis and prediction of price tendencies in the Forex, stock, commodity, and cryptocurrency markets, as well as the development of trading strategies and individual risk management systems. He also analyzes nonstandard investing markets and studies trading psychology.
Also, Oleg became a member of the National Union of Journalists of Ukraine (membership card No. 4575, international certificate UKR4494).

Olga Shendetskaya has been a part of the Traders Union team as an author, editor and proofreader since 2017. Since 2020, Shendetskaya has been the assistant chief editor of the website of Traders Union, an international association of traders. She has over 10 years of experience of working with economic and financial texts. In the period of 2017-2020, Olga has worked as a journalist and editor of laftNews news agency, economic and financial news sections. At the moment, Olga is a part of the team of top industry experts involved in creation of educational articles in finance and investment, overseeing their writing and publication on the Traders Union website.

Mirjan Hipolito is a journalist and news editor at Traders Union. She is an expert crypto writer with five years of experience in the financial markets. Her specialties are daily market news, price predictions, and Initial Coin Offerings (ICO).
