How To Use The Zig Zag Indicator


Editorial Note: While we adhere to strict Editorial Integrity, this post may contain references to products from our partners. Here's an explanation for How We Make Money. None of the data and information on this webpage constitutes investment advice according to our Disclaimer.
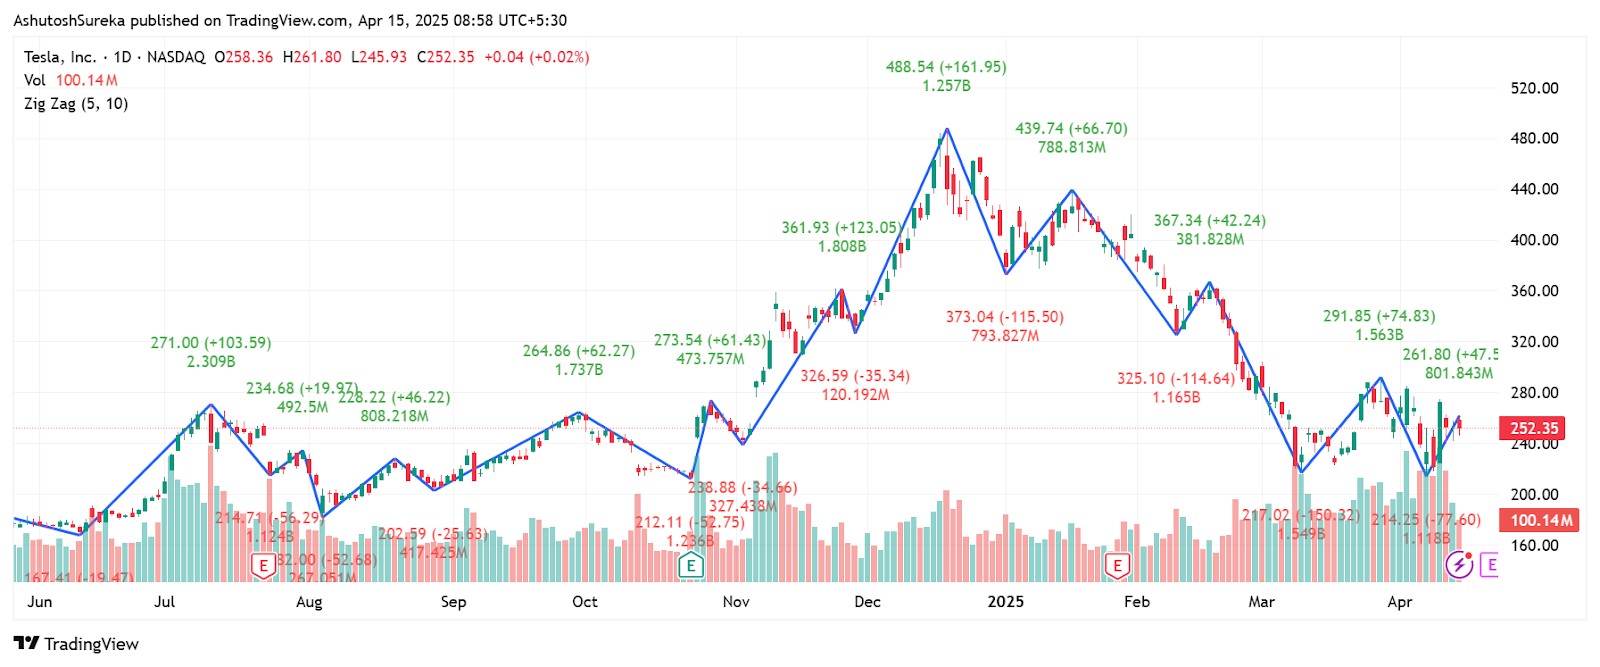
The zig zag indicator filters out minor price fluctuations to help traders focus on meaningful trends and structural shifts. It connects major highs and lows based on percentage or point changes, revealing swing patterns and trend strength. While not predictive, it offers powerful insights into momentum and trend health when combined with price action or Fibonacci tools.
The zig zag indicator is not built to forecast. It is made to cut the noise and help you focus on structure. Traders often worry about every minor move and end up missing the bigger picture. Zig zag filters that out and highlights the major turning points based on the size of the moves. But its real value is not in the lines, it is in what they say about how the market breathes. If those swings start getting shorter in an uptrend or stretch longer in a downtrend, that can hint the trend is shifting before it becomes obvious. In this article, we discuss this trend-filtering indicator in detail, covering its origin, key components, and top trading strategies.
Introduction to zig zag indicator
The zig zag indicator is a chart analysis tool used to filter out minor price movements and highlight major trends. It simplifies market structure by drawing straight lines between significant highs and lows, making it easier to spot patterns, swings, and overall direction.
Unlike moving averages or oscillators, this indicator does not predict future movement; it reacts only after price changes. This makes it useful for analyzing historical swings, measuring retracements, or confirming chart patterns like head and shoulders or Elliott waves.
What does zig zag show
Filters out small, random price noise.
Connects swing highs and swing lows with clean lines.
Helps identify wave patterns, support and resistance levels.
Makes trend direction and reversal zones easier to spot.
Origin and development of zig zag indicator
This trend filtering tool (zig zag) indicator has been around since the early days of technical charting. It was created to help analysts and traders visually separate meaningful market moves from insignificant fluctuations. Though it isn’t attributed to a specific person, it evolved over time through early market theory and price action analysis.
Why it was introduced
Traders needed a way to reduce chart clutter and highlight clean price movement.
The tool was designed to ignore minor fluctuations and help focus on key swing points.
It became popular as part of Elliott Wave Theory and pattern recognition strategies.
How it became useful
Originally used in manual chart drawing, later built into charting platforms.
Became a core part of swing trading, wave analysis, and pattern studies.
Still widely used to confirm structure, measure retracement levels, and analyze past trends.
Understanding the components of zig zag indicator
Zig zag indicator is built around one simple idea: filtering out smaller price movements and focusing only on major turning points. It does this by connecting significant highs and lows based on a set percentage or value, making the chart easier to read for trend and pattern recognition.
Although it appears as just a set of angled lines on the chart, this indicator depends on a few core components that control how it behaves and what it shows.
Key components of zig zag
1. Deviation or threshold
This setting defines the minimum price change needed for the indicator to draw a new line.
It can be set as a percentage (like 5 percent) or in points.
If the price does not move beyond this amount, the indicator ignores it.
2. Depth or lookback period
This controls how far back the indicator searches to find highs and lows.
A longer depth smooths the chart and focuses on major swings.
A shorter depth makes the indicator more sensitive to smaller moves.
3. Reversal amount
This value tells the indicator when to switch direction and plot the next leg.
For example, if set to 10 percent, the price must reverse by at least 10 percent from a high or low for the next point to be drawn.
It helps determine when a swing is large enough to matter.
How it all works together
The tool starts by plotting the first confirmed high or low.
It then connects the next valid swing only if the price has changed enough based on the reversal setting.
The result is a cleaner view of the trend, removing minor fluctuations that distract from the big picture.
How to apply zig zag on a chart
Zig zag indicator is available on most trading platforms and is very easy to use. It draws lines between key highs and lows based on a set percentage or point change. Once added to the chart, you can adjust the sensitivity using a few simple settings.
Access the indicator
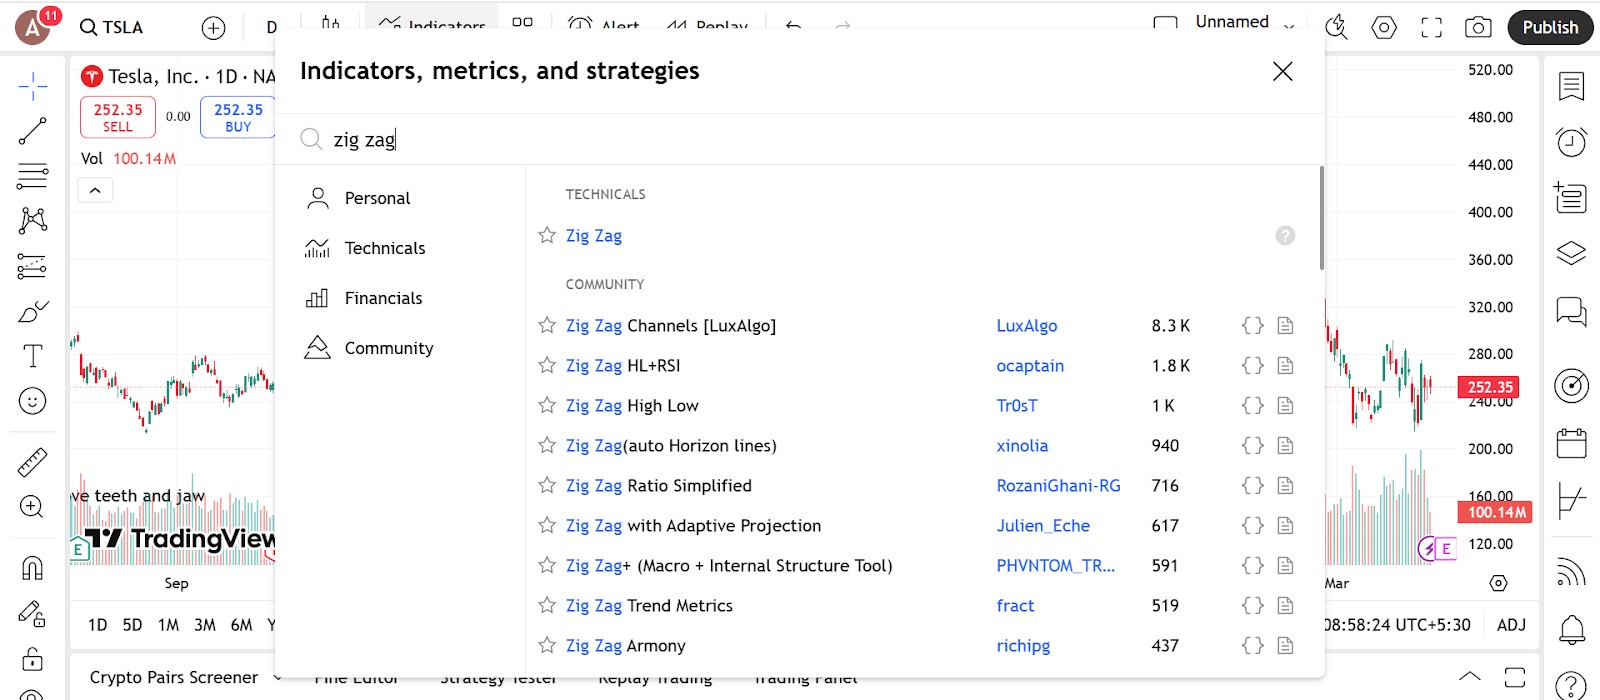
Setting up the Zig Zag indicator on your chart is simple and quick.
Steps to follow
Open the indicators or tools section on your trading platform.
Search for “Zig Zag” in the available options.
Select and apply it to your chart; the line will show in a separate panel beneath the main chart area.
Platform availability
You will find Zig Zag already built into platforms like TradingView, MetaTrader 4 and 5, ThinkorSwim, and most major charting software; no extra downloads or installations needed.
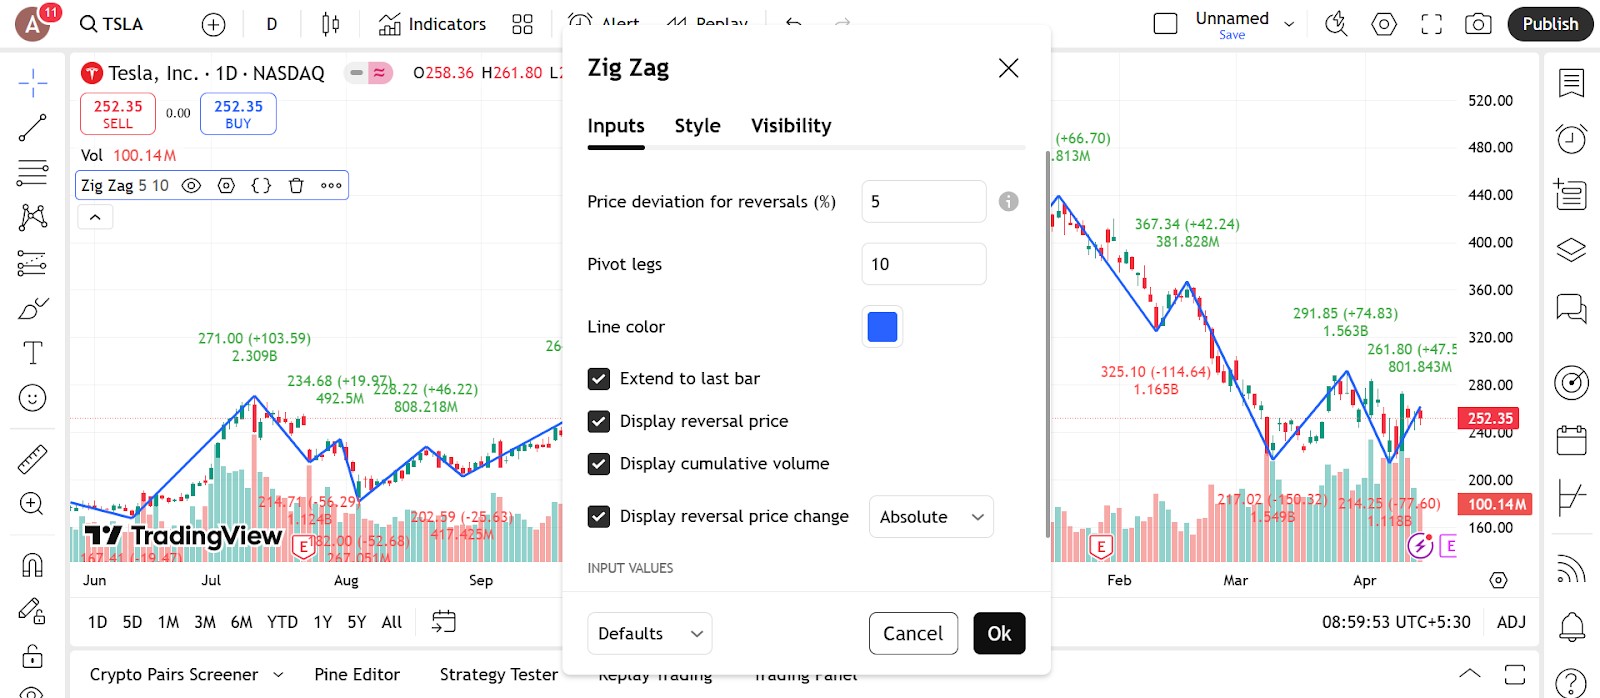
Changing the inputs

While the indicator is simple, tuning the parameters helps match it to your timeframe and strategy.
What you can adjust
Deviation (percentage or points)
Sets the minimum move required before a line is drawn. A higher value means fewer, more meaningful swings.Depth (or lookback)
This defines how far back the tool looks to compare price. A longer depth gives a smoother line that focuses only on larger moves.Backstep (if available)
A setting used in some versions of zig zag to prevent very small reversals from being counted
Tips for setup
Use a higher deviation on higher timeframes to avoid noise.
Test on different charts to see which values give a clean, useful structure.
Combine with Fibonacci, support and resistance, or trendlines for better trade setups.
Trading strategies using zig zag indicator
Zig zag is a great tool for identifying market structure, spotting patterns, and filtering out noise. While it doesn’t give signals on its own, it works well when combined with support and resistance levels, Fibonacci tools, or candlestick formations. Traders mainly use it to analyze trends, confirm breakouts, and measure pullbacks.
Fibonacci retracement with zig zag confirmation
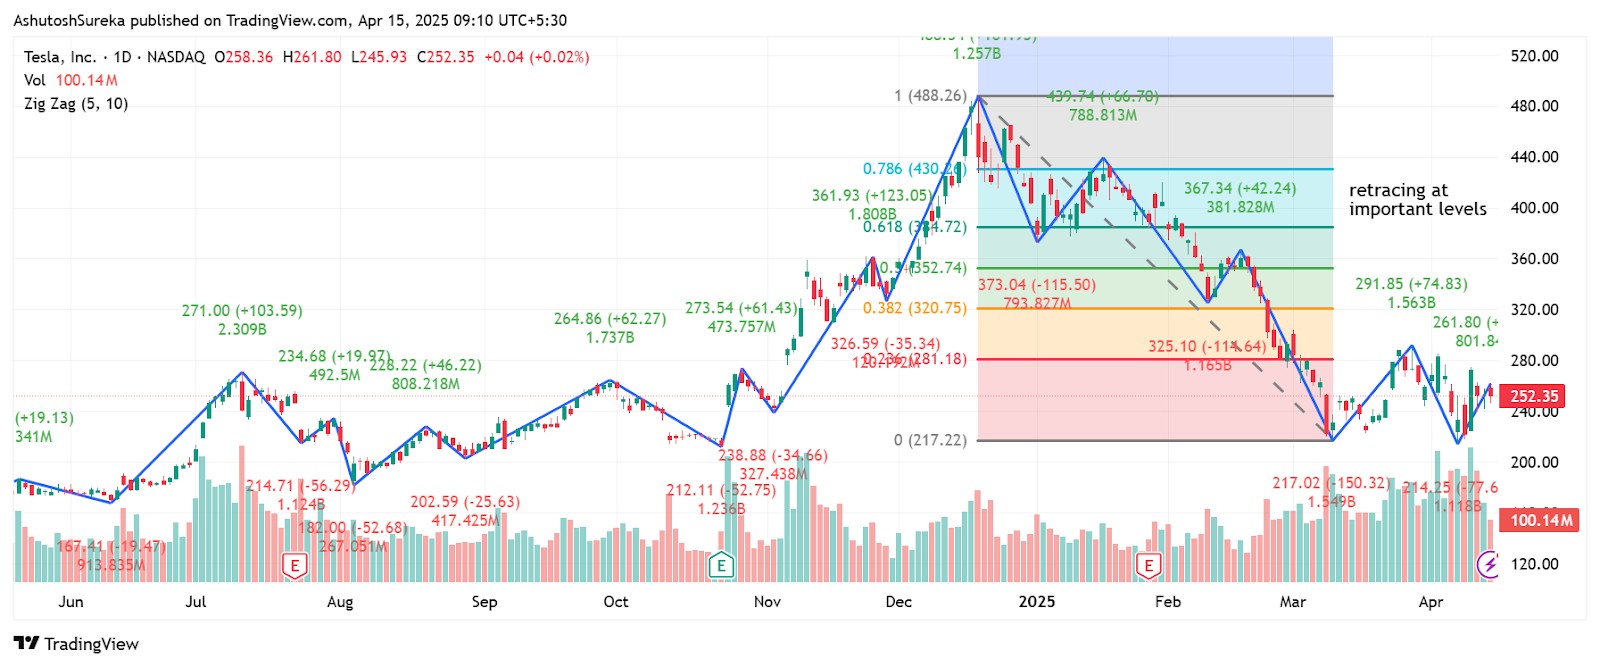
Zig zag helps mark the swing points needed to draw accurate Fibonacci levels.
How to apply it
Use the tool to mark a clear high and low.
Draw a Fibonacci retracement from swing low to swing high (or vice versa).
Watch for price to react at 38.2, 50, or 61.8 levels.
Confirm with a bounce or candlestick signal.
Why it helps
Avoids guessing on where to draw your Fib levels.
Matches structure with common retracement zones.
Gives more confidence in pullback trades.
Chart pattern recognition strategy
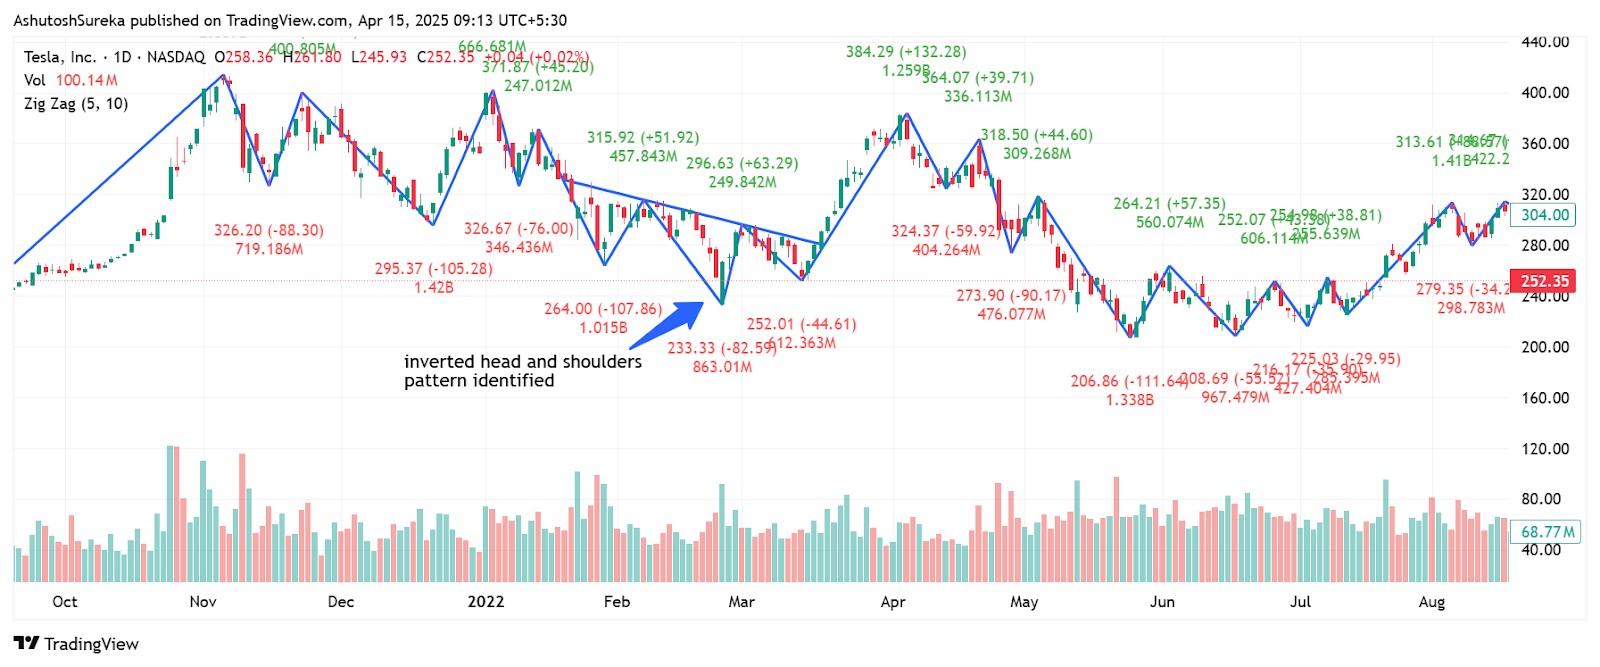
Zig zag makes it easier to see patterns like double tops, head and shoulders, or triangles.
How to apply it
Let zig zag outline the price structure.
Look for repeating shapes like M and W patterns, triangles, or channels.
Wait for a breakout beyond the pattern before entering.
Use price action to time your entry and stop placement.
Why it helps
Clears up the visual clutter on your chart.
Makes pattern spotting faster and more accurate.
Great for traders who prefer structure-based setups.
Traders who depend on multiple technical indicators should consider brokers that provide access to platforms like TradingView, MT5, or cTrader. These platforms come equipped with a wide range of professional charting tools and indicators that suit nearly any trading style. Below, you will find a comparison table showcasing the top brokers that offer these platforms, making it easier for you to find and select the one that matches your specific trading needs.
| iBroker | Pepperstone | Fusion Markets | FxPro | IC Markets | |
|---|---|---|---|---|---|
|
Tradable assets |
No | 1200 | 250 | 2100 | 2250 |
|
Min. deposit, $ |
1 | No | 1 | 100 | 200 |
|
Max. leverage |
1:30 | 1:500 | 1:500 | 1:500 | 1:500 |
|
TradingView |
Yes | Yes | Yes | No | Yes |
|
MT5 |
Yes | Yes | Yes | Yes | Yes |
|
cTrader |
Yes | Yes | Yes | Yes | Yes |
|
TU overall score |
5.46 | 9.25 | 9.2 | 8.6 | 8.05 |
|
Open an account |
Study review | Go to broker Your capital is at risk.
|
Go to broker Your capital is at risk. |
Go to broker Your capital is at risk. |
Go to broker Your capital is at risk. |
Pros and cons of zig zag indicator
- Pros
- Cons
Filters out market noise. The indicator cuts through small, random price movements and focuses only on major highs and lows. This makes it easier to see what’s really happening without getting distracted by minor fluctuations.
Makes trend structure clearer. It connects turning points with clean lines, which helps you spot higher highs, lower lows, and overall trend direction. This is useful for identifying reversals or confirming ongoing moves.
Supports pattern recognition. Zig zag lines simplify chart patterns like head and shoulders, double tops, or channels. You can spot these more easily when price is outlined with clear swings.
Helps with drawing Fibonacci levels. It gives you clean reference points for swing highs and lows, which makes it easier to apply Fibonacci tools accurately and with confidence.
Lagging by design. The zig zag only draws after the price has moved by a set amount, so it shows what happened in hindsight. This means you can’t rely on it for real-time entries.
Not suitable for standalone signals. It doesn’t give buy or sell signals on its own. You need to combine it with price action, volume, or other tools to make informed decisions.
Can repaint with new price action. As new candles form, the indicator may shift or adjust recent lines. This can be confusing if you’re using it for live decision-making without understanding how it works.
Highly sensitive to settings. If your deviation or depth settings are too low, it may show too many swings. If they’re too high, it may miss key turns. Tuning it takes trial and error based on timeframe and asset.
Zig zag can be a trend strength mirror when used right

Most people treat the zig zag indicator as something that just makes the chart look neat. But what beginners often overlook is that zig zag can tell you if a trend is starting to fade. Watch the size of the swings. If the rallies in an uptrend get smaller while the dips get deeper, the strength behind the move is thinning out, even if price still climbs. And in a pullback, if buyers start showing up earlier and making stronger pushes, that is your sign to pay attention. With zig zag, you compare move size instead of just direction. That is where the real insight comes in.
Another detail most traders miss is how the angle of those moves tells you about the market’s tone. If your same zig zag setting suddenly starts drawing steeper legs or softer drops, the market is shifting. A sharp rally with only a mild dip shows momentum picking up fast. That is more than just a trend holding, it is gaining speed. When you stop thinking of zig zag as just a drawing tool and start using it to read the personality of the trend, it starts helping you notice who is really pushing the move and what they are trying to do.
Conclusion
Mastering the Zig Zag indicator can dramatically enhance a trader's ability to navigate trend shifts and capitalize on market momentum. This versatile tool strips away market noise, allowing traders to clearly identify significant price swings and reversal points—key elements for strategic entries and exits. For example, using the Zig Zag indicator in combination with support/resistance levels or the RSI can amplify its effectiveness in confirming trend reversals. Ultimately, the most powerful takeaway is that the Zig Zag indicator is not just a filter, but a lens that brings clarity to market structure. When skillfully integrated into your trading strategy, it empowers you to anticipate opportunities rather than react to them.
FAQs
Can the Zig Zag Indicator be combined with other technical analysis tools for improved results?
What role does the Zig Zag Indicator play in identifying market reversals?
How does the Zig Zag Indicator assist in measuring price retracements?
What are the limitations of using the Zig Zag Indicator for real-time trading decisions?
Editors' Top Picks and Insights

SpaceX falls out of orbit: Does anyone still want Musk’s stock?

The crypto IPO problem: How high-profile listings became investor traps

U.S. Bitcoin reserve: Trump’s unrealized crypto promise

Aiming for leadership: Payment giants prepare a new stablecoin

Proof of Reserves: the new standard for cryptocurrency exchanges

Three trends that could reshape the crypto market over the next decade
Related Articles
Team that worked on the article
Anton Kharitonov is an active trader and analyst. He employs both short- and long-term trading strategies, primarily based on fundamental factors, supported by technical indicators and intermarket analysis.
Chinmay Soni is a financial analyst with more than 5 years of experience in working with stocks, Forex, derivatives, and other assets. As a founder of a boutique research firm and an active researcher, he covers various industries and fields, providing insights backed by statistical data.
Mirjan Hipolito is a journalist and news editor at Traders Union. She is an expert crypto writer with five years of experience in the financial markets.
Cryptocurrency is a type of digital or virtual currency that relies on cryptography for security. Unlike traditional currencies issued by governments (fiat currencies), cryptocurrencies operate on decentralized networks, typically based on blockchain technology.
Day trading involves buying and selling financial assets within the same trading day, with the goal of profiting from short-term price fluctuations, and positions are typically not held overnight.
An investor is an individual, who invests money in an asset with the expectation that its value would appreciate in the future. The asset can be anything, including a bond, debenture, mutual fund, equity, gold, silver, exchange-traded funds (ETFs), and real-estate property.
Forex leverage is a tool enabling traders to control larger positions with a relatively small amount of capital, amplifying potential profits and losses based on the chosen leverage ratio.
Index in trading is the measure of the performance of a group of stocks, which can include the assets and securities in it.

-
 Afghanistan
-
 Albania
-
 Algeria
-
 Angola
-
 Argentina
-
 Armenia
-
 Australia
-
 Austria
-
 Azerbaijan
-
 Bahamas
-
 Bahrain
-
 Bangladesh
-
 Belarus
-
 Belgium
-
 Bolivia
-
 Botswana
-
 Brazil
-
 Brunei
-
 Bulgaria
-
 Cambodia
-
 Cameroon
-
 Canada
-
 Chile
Chile
-
 China
China
-
 Colombia
-
 Congo
Congo
-
 Costa Rica
-
 Cote d'Ivoire
-
 Croatia
-
 Cuba
Cuba
-
 Cyprus
-
 Czechia
-
 DR Congo
-
 Denmark
-
 Dominican Republic
-
 Ecuador
-
 Egypt
Egypt
-
 El Salvador
-
 Estonia
-
 Eswatini
-
 Ethiopia
-
 Finland
-
 France
-
 Georgia
-
 Germany
-
 Ghana
Ghana
-
 Greece
-
 Haiti
Haiti
-
 Hong Kong
-
 Hungary
-
 India
India
-
 Indonesia
-
 Iran, Islamic republic
-
 Iraq
Iraq
-
 Ireland
-
 Israel
-
 Italy
Italy
-
 Jamaica
-
 Japan
Japan
-
 Jordan
-
 Kazakhstan
-
 Kenya
Kenya
-
 Korea
Korea
-
 Kuwait
-
 Kyrgyzstan
-
 Laos
Laos
-
 Latvia
-
 Lebanon
-
 Lesotho
-
 Libya
Libya
-
 Lithuania
-
 Luxembourg
-
 Madagascar
-
 Malaysia
-
 Malta
Malta
-
 Mauritius
-
 Mexico
-
 Moldova
-
 Mongolia
-
 Montenegro
-
 Morocco
-
 Mozambique
-
 Myanmar
-
 Namibia
-
 Nepal
Nepal
-
 Netherlands
-
 New Zealand
-
 Nigeria
-
 North Macedonia
-
 Norway
-
 Oman
Oman
-
 Pakistan
-
 Palestine
-
 Panama
-
 Papua New Guinea
-
 Paraguay
-
 Peru
Peru
-
 Philippines
-
 Poland
-
 Portugal
-
 Puerto Rico
-
 Qatar
Qatar
-
 Reunion
-
 Romania
-
 Rwanda
-
 Saudi Arabia
-
 Serbia
-
 Singapore
-
 Slovakia
-
 Slovenia
-
 Somalia
-
 South Africa
-
 Spain
Spain
-
 Sri Lanka
-
 Sweden
-
 Switzerland
-
 Syria
Syria
-
 Taiwan
-
 Tajikistan
-
 Tanzania
-
 Thailand
-
 Trinidad and Tobago
-
 Tunisia
-
 Turkey
-
 UAE
UAE
-
 Uganda
-
 Ukraine
-
 United Kingdom
-
United States
-
 Uruguay
-
 Uzbekistan
-
 Venezuela
-
 Vietnam
-
 Yemen
Yemen
-
 Zambia
-
 Zimbabwe
- Forex
- Crypto
