What Is A Supertrend Indicator?


Editorial Note: While we adhere to strict Editorial Integrity, this post may contain references to products from our partners. Here's an explanation for How We Make Money. None of the data and information on this webpage constitutes investment advice according to our Disclaimer.
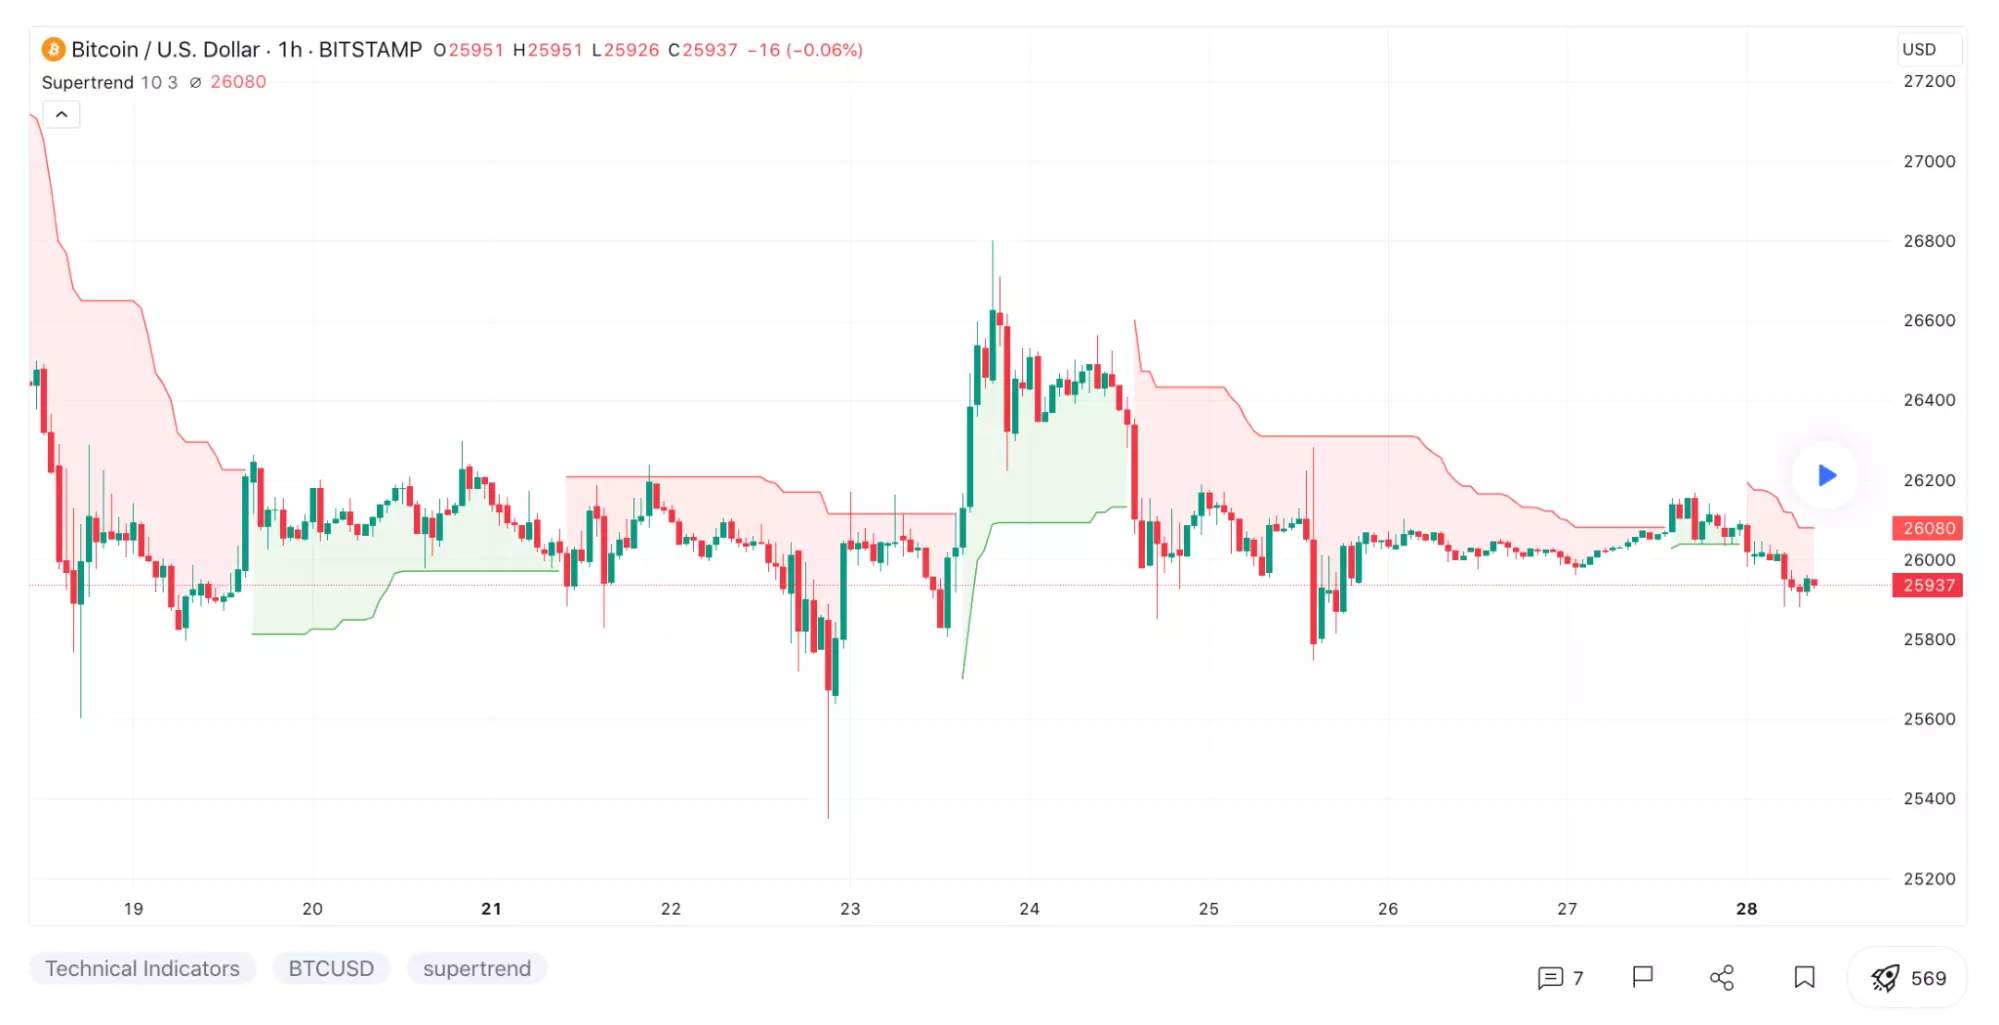
The Supertrend Indicator is a popular trading tool used to identify the direction of the market trend and provide buy or sell signals. It is plotted on price charts and moves in accordance with the price. The indicator is based on the average true range (ATR), which measures market volatility, and adjusts itself accordingly. When the price is above the Supertrend line, it indicates an uptrend (buy signal), and when the price is below the line, it indicates a downtrend (sell signal).
The Supertrend indicator is a tool used by traders to identify market trends and potential reversal points. Combining price action with volatility, it provides clear buy and sell signals, making it a valuable addition to any trading strategy. In this article we will discuss what the Supertrend indicator is, how it works, and how traders can effectively use it in their trading endeavors.
What is the Supertrend indicator and how does it work?
The primary function of the Supertrend indicator is to help traders identify the direction of the market trend. Here's how to interpret the Supertrend line to determine whether the market is in an uptrend or downtrend:
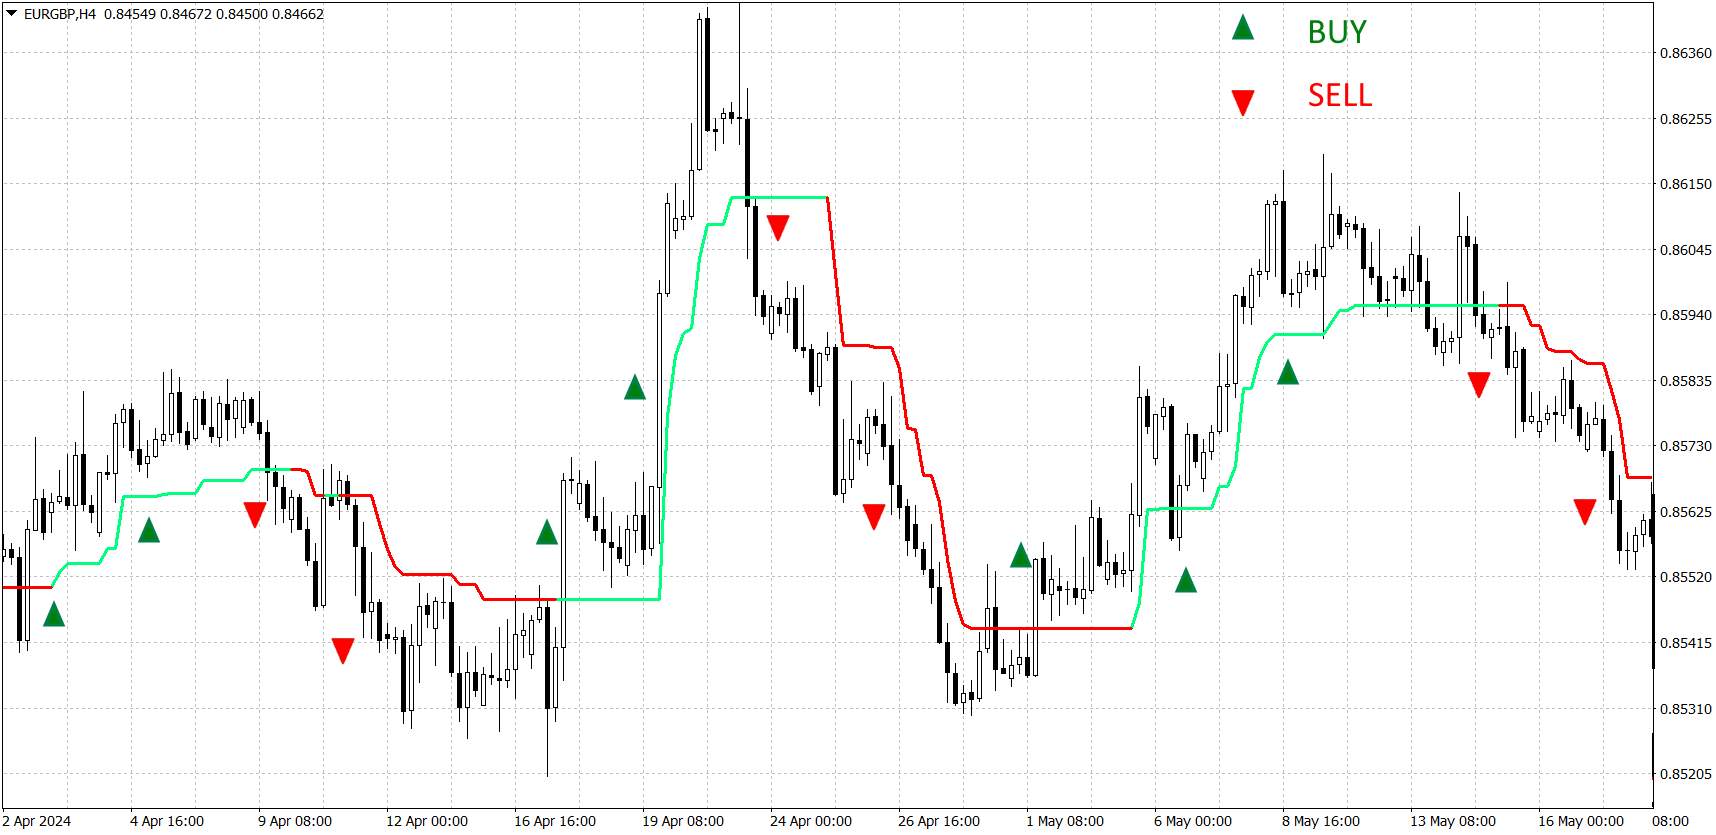
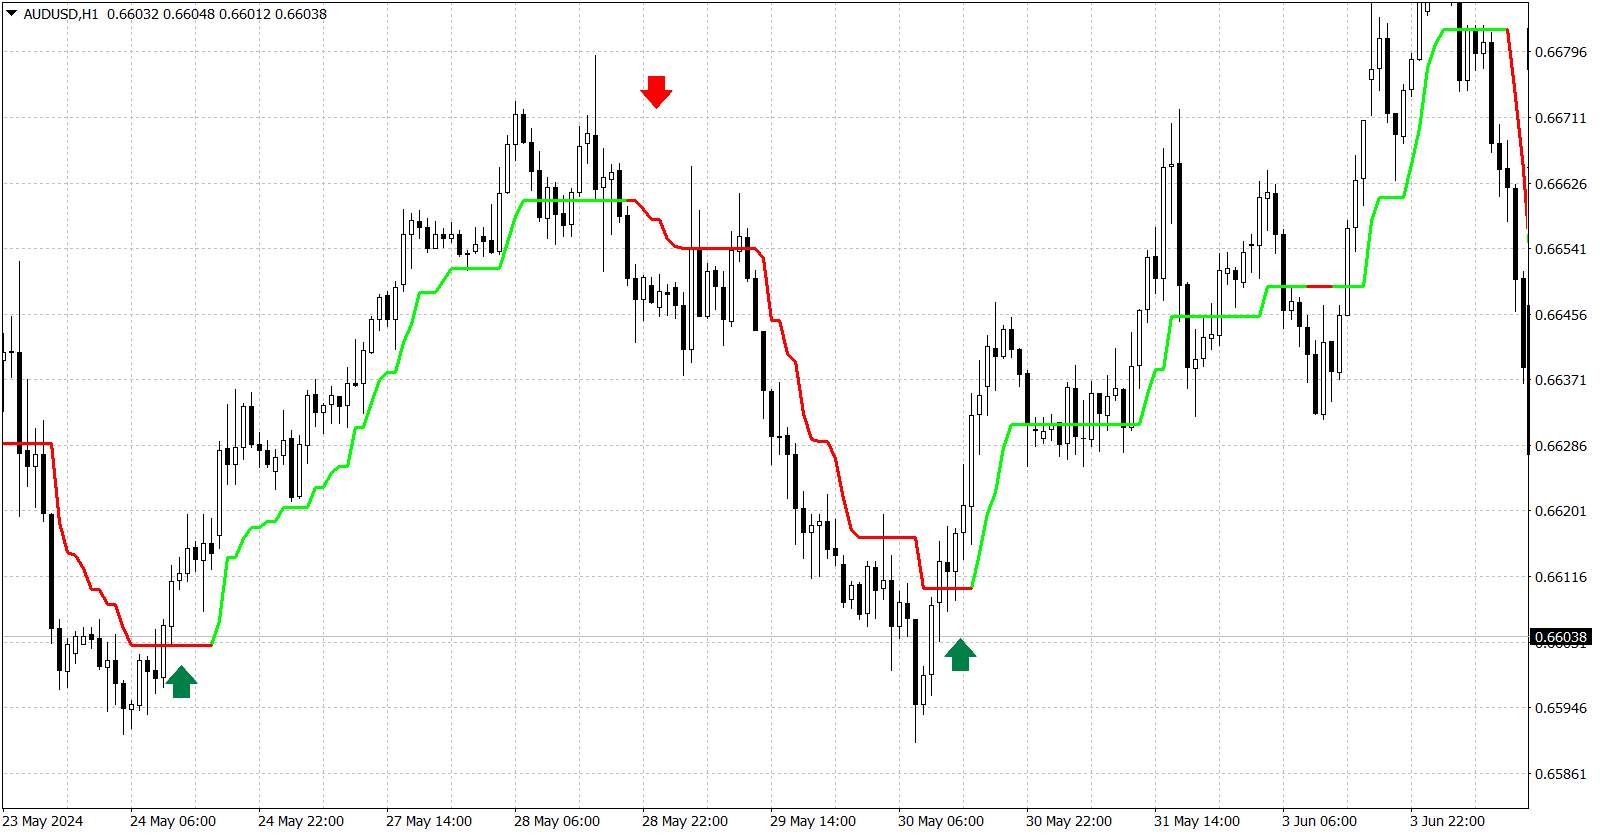
Uptrend: When the Supertrend line is below the price and colored green, it indicates an uptrend. This suggests that the price is likely to continue rising, and traders should consider long positions.
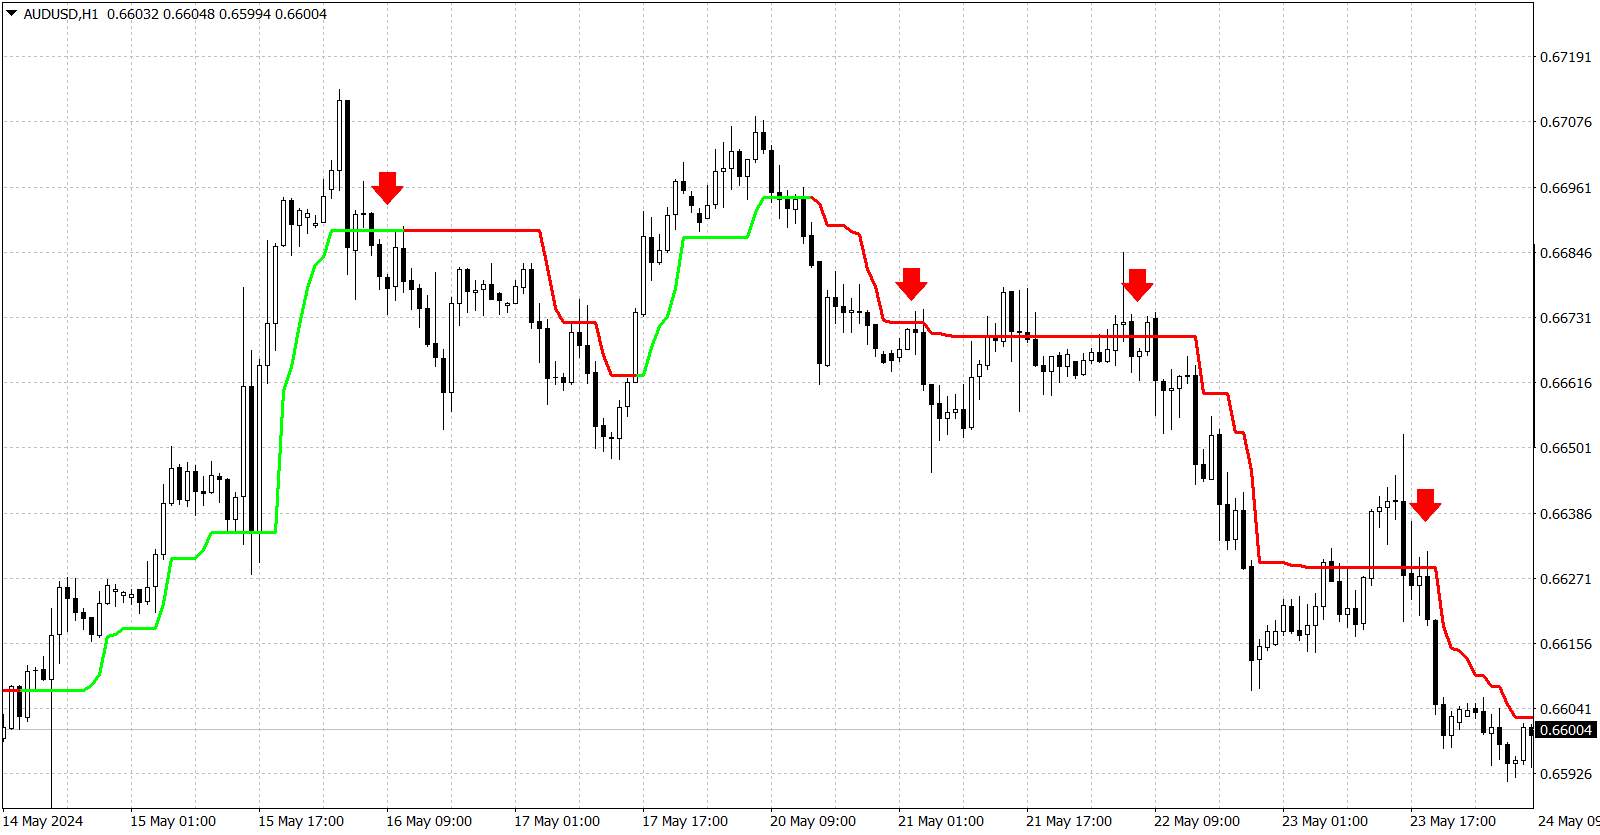
Downtrend: Conversely, when the Supertrend line is above the price and colored red, it indicates a downtrend. This suggests that the price is likely to continue falling, and traders should consider short positions.
The Supertrend indicator primarily uses two components:
Median Price: This is calculated as the average between the high and low prices, providing a central reference point for price analysis.
Average True Range (ATR): Developed by Welles Wilder, ATR measures volatility, indicating the degree of price fluctuation within a given period.
The Supertrend indicator's formula involves:
UpBand = MedianPrice + (Multiplier * ATR)
DownBand = MedianPrice - (Multiplier * ATR)
How the indicator plots on charts
The Supertrend indicator appears as a single line on charts, moving between two bands, providing clear visual cues for trend direction and reversals. When the price closes above the UpBand, the Supertrend line switches to follow the UpBand. Conversely, when the price closes below the DownBand, the Supertrend line switches to follow the DownBand.
Setting up the Supertrend indicator
Now let us learn about how to set up the Supertrend indicator, including choosing the right parameters, integrating it with other indicators, and platform-specific instructions.
Choosing parameters (Multiplier and Period)
Selecting appropriate parameters is crucial for the Supertrend indicator's performance. The commonly used settings are a period of 10 and a multiplier of 3. However, these can be adjusted according to your trading style and market conditions:
Multiplier: Adjusting the multiplier changes the sensitivity of the indicator. A higher multiplier will result in fewer but more reliable signals, while a lower multiplier will give more signals that may be less reliable.
Period: The period determines the number of price bars used in the calculation. A shorter period makes the indicator more responsive to price changes, while a longer period smooths out the noise.
Integrating with other indicators
Combining the Supertrend with other indicators like Moving Averages, RSI, or MACD can enhance its effectiveness by confirming signals. Learn more about indicators in our article Top 7 Day Trading And Scalping Indicators On TradingView.
1. Supertrend & Moving Average
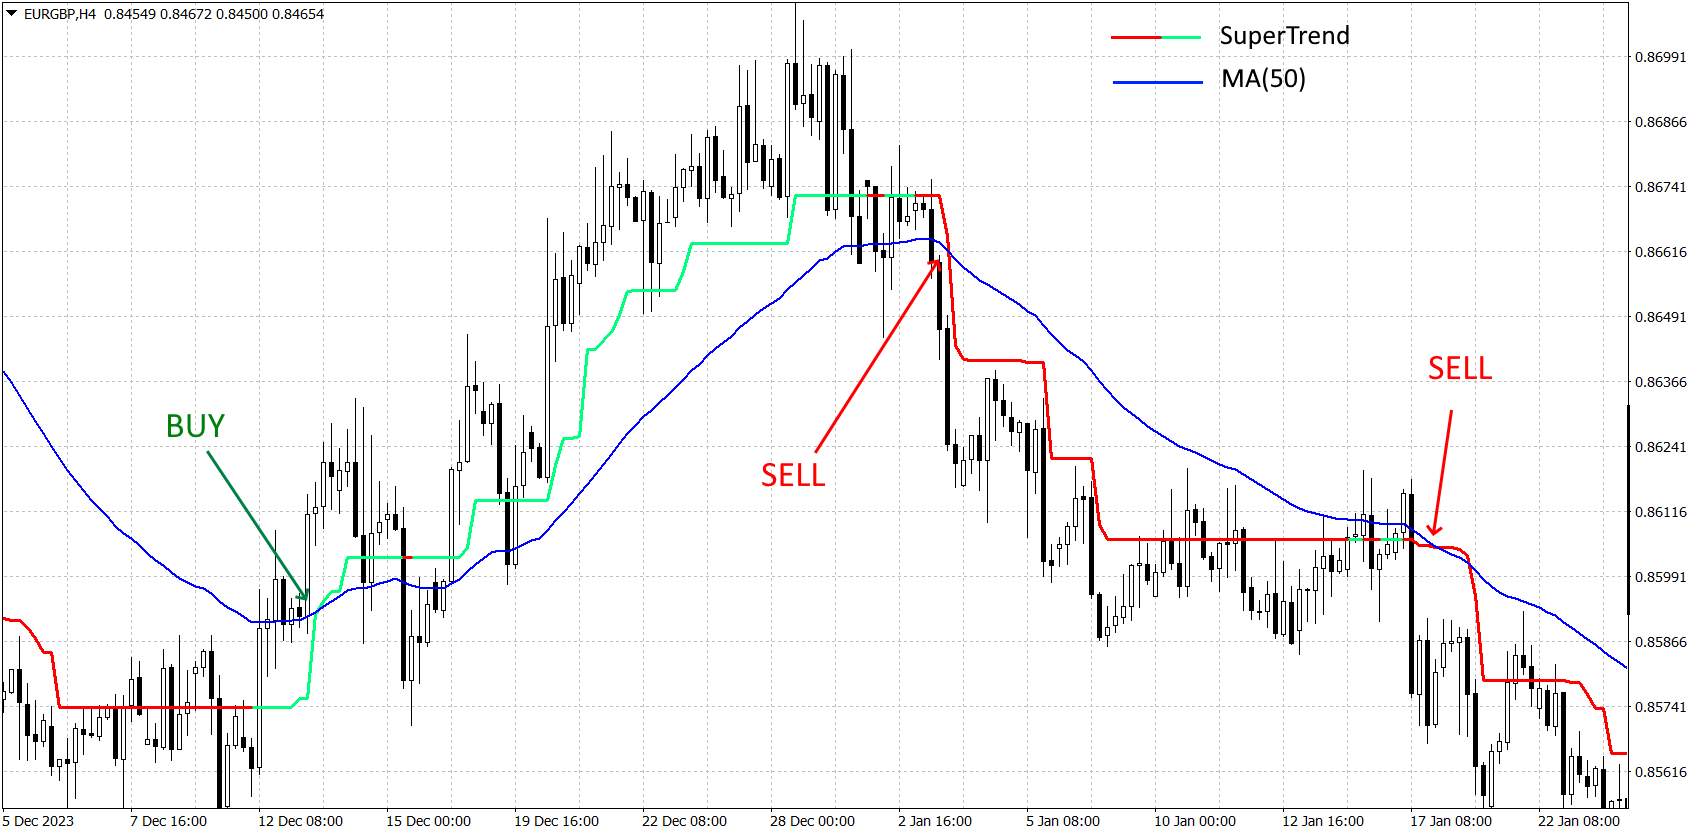
Moving Averages help smooth out price data to identify the direction of the trend over a specified period. Use the Supertrend to identify the trend direction and Moving Averages to confirm the trend strength.
Buy Signal: When the Supertrend indicates an uptrend (green line) and the price is above the 50-day Moving Average.
Sell Signal: When the Supertrend indicates a downtrend (red line) and the price is below the 50-day Moving Average.
2. Supertrend & RSI
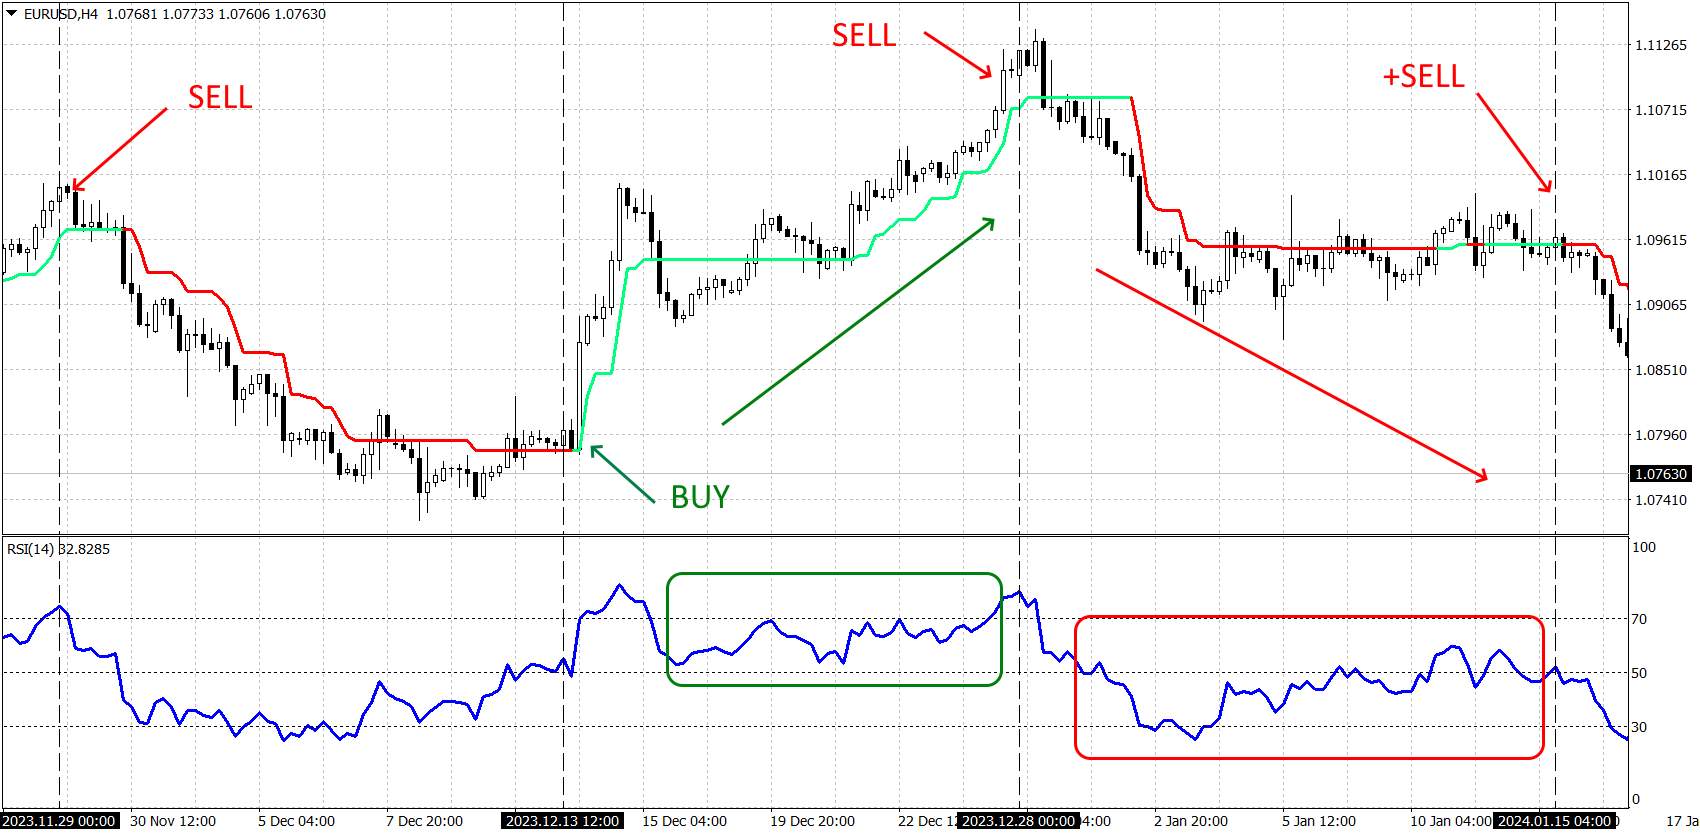
The RSI measures the speed and change of price movements, identifying overbought or oversold conditions. Use the Supertrend to determine the trend direction and RSI to identify entry and exit points.
Buy Signal: When the Supertrend indicates an uptrend and the RSI is below 30 (indicating oversold conditions).
Sell Signal: When the Supertrend indicates a downtrend and the RSI is above 70 (indicating overbought conditions).
3. Supertrend & MACD
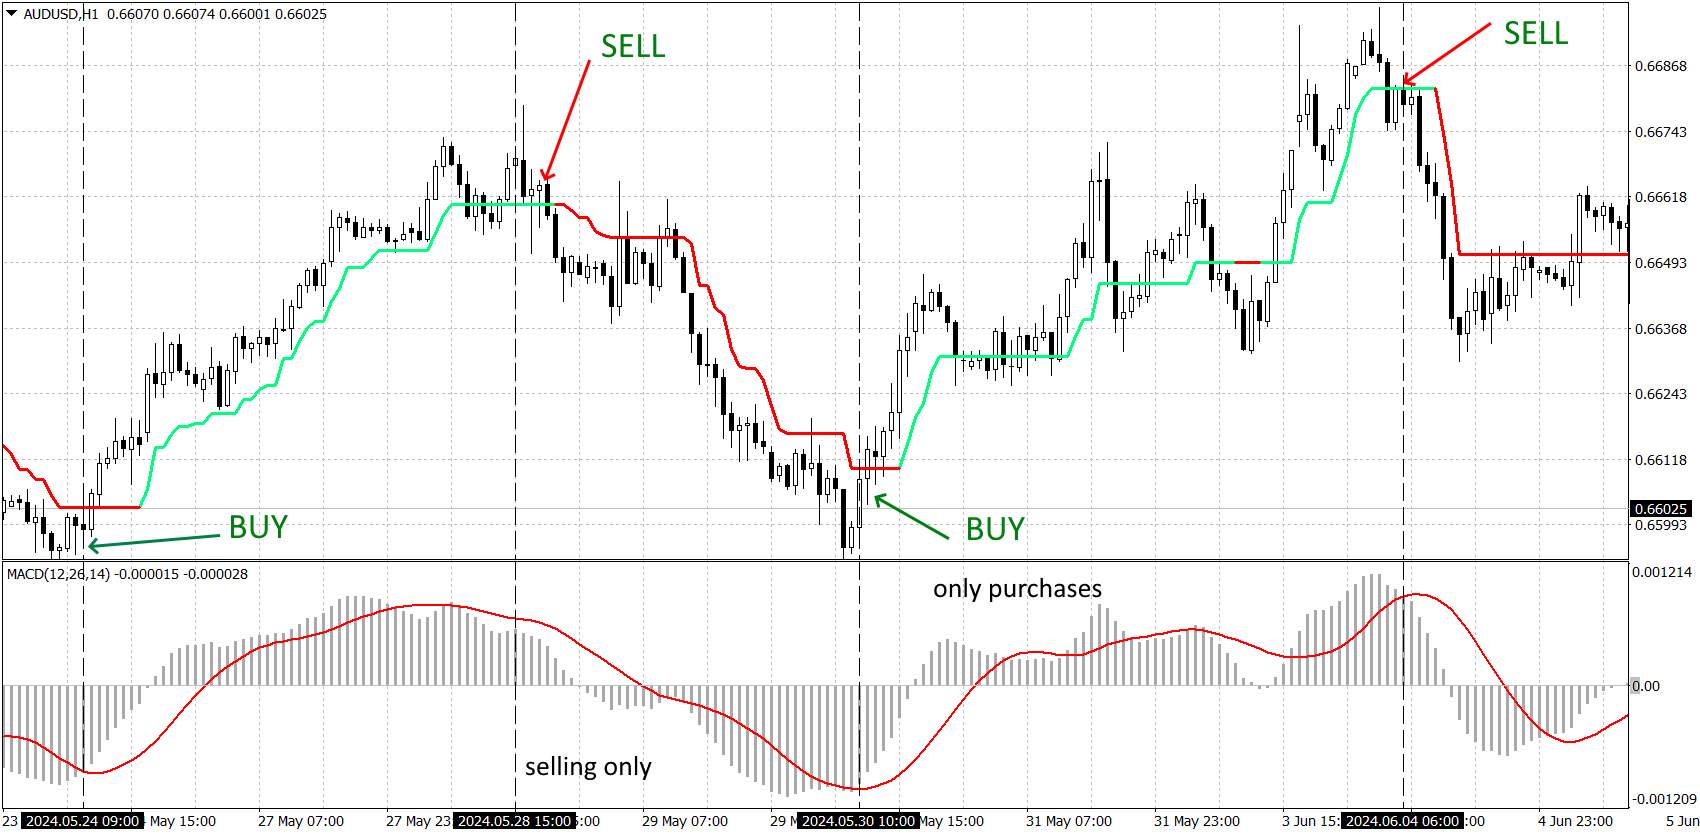
The MACD is a momentum indicator that shows the relationship between two moving averages of a security’s price. When used with the Supertrend, MACD can show the strength and momentum of a trend.
Buy Signal: When the Supertrend indicates an uptrend and the MACD line crosses above the signal line.
Sell Signal: When the Supertrend indicates a downtrend and the MACD line crosses below the signal line.
Platform-specific Instructions
Let's look at how to set up Supertrend using the example of MetaTrader:
Open MetaTrader 4 or MetaTrader 5:
Launch your MetaTrader platform.
Navigate to the “Navigator” Panel:
In the main window, locate the “Navigator” panel on the left side of the screen.
Find the “Indicators” Folder:
Expand the “Indicators” folder in the Navigator panel.
Locate the “Supertrend” Indicator:
If the Supertrend indicator is not available by default, you may need to download and install it. Many custom indicators can be found online. After downloading, place the Supertrend indicator file into the “Indicators” folder of your MetaTrader directory.
Drag the Indicator onto the Chart:
Click and drag the “Supertrend” indicator onto the chart you wish to analyze.
Configure the Parameters:
In the settings window, set the desired parameters such as the period and multiplier. Adjust these based on your trading strategy.
Apply the Indicator:
Click “OK” to apply the indicator to the chart. The Supertrend line should now be visible, indicating trend directions.
Trading strategies with the Supertrend indicator
The Supertrend indicator is versatile and can be applied to multiple trading strategies to enhance decision-making and improve trade outcomes.
1. Trend following strategy
Use the Supertrend for trend-following strategies to capture the main market trend. This strategy involves entering trades in the direction of the prevailing trend and holding positions as long as the trend continues.
How to Apply:
Uptrend: Enter a long position when the Supertrend indicator shows an uptrend (green line below the price).
Downtrend: Enter a short position when the Supertrend indicator shows a downtrend (red line above the price).
Exit: Exit the trade when the Supertrend signals a trend reversal, ensuring you lock in profits or minimize losses as the trend changes.
2. Breakout strategy
Identify and trade breakouts using the Supertrend. Breakout strategy aims to capitalize on significant price movements that occur when the price breaks through key support or resistance levels.
How to Apply:
Breakout confirmation: Use the Supertrend to confirm breakouts by waiting for the price to break above resistance (for a long position) or below support (for a short position) and for the Supertrend to signal an uptrend or downtrend.
Entry: Enter a long position on a confirmed breakout above resistance with an uptrend signal from the Supertrend. Enter a short position on a confirmed breakout below support with a downtrend signal from the Supertrend.
Exit: Exit the trade if the price reverses and the Supertrend signals a trend change.
3. Swing trading strategy
Swing trading targets medium-term price movements, involving holding positions for several days to weeks to capture price swings within a broader trend.
How to Apply:
Uptrend Swings: Enter long positions at the beginning of an uptrend signaled by the Supertrend and exit near the peak of the price swing.
Downtrend Swings: Enter short positions at the beginning of a downtrend signaled by the Supertrend and exit near the bottom of the price swing.
Exit: Use the Supertrend to identify potential reversal points and exit trades accordingly.
4. Intraday trading strategy
Use the Supertrend in intraday trading for quick, short-term trades. Intraday trading strategy focuses on taking advantage of intraday price movements and capturing small profits throughout the trading day.
How to Apply:
Uptrend: Enter long positions when the Supertrend indicates an uptrend during the trading day.
Downtrend: Enter short positions when the Supertrend indicates a downtrend during the trading day.
Exit: Close positions at the end of the day or when the Supertrend signals a trend reversal.
Key recommendation for beginners
Here are some important points to consider for new traders to effectively use the Supertrend indicator:
Understanding basic concepts. Before trading beginners should understand key trading concepts and the fundamentals of the Supertrend indicator. This includes knowing how the Supertrend identifies trends and signals potential entry and exit points.
Starting with Demo accounts. One of the best ways for beginners to gain practical experience without financial risk is by starting with demo accounts. Look for brokers that offer this facility. Some of the top choices are presented in the following table:
| Trading.com USA | ZForex | Plus500 | OANDA | FOREX.com | |
|---|---|---|---|---|---|
|
Demo |
Yes | Yes | Yes | Yes | Yes |
|
Min. deposit, $ |
50 | 10 | 100 | No | 100 |
|
Leverage, 1: |
Up to 1:400 | Up to 1:30 or 1:300 (for professional accounts only; trading with such leverage forfeits ICF rights) | Up to 1:200 | Up to 1:50 | Up to 1:1000 |
|
Min Spread EUR/USD, pips |
0.9 | 0.1 | 0.5 | 0.1 | 0.7 |
|
Investor protection |
No | No | €20,000 £85,000 SGD 75,000 | £85,000 SGD 75,000 $500,000 | £85,000 |
|
Negative balance protection |
Yes | Yes | No | Yes | Yes |
|
Open account |
Go to broker Your capital is at risk. |
Go to broker Your capital is at risk.
|
Go to broker 80% of retail CFD accounts lose money. |
Go to broker Your capital is at risk. |
Study review |
Setting realistic expectations. Setting realistic expectations helps manage emotions and fosters a disciplined approach to trading. Also, set small, realistic goals when starting out, such as understanding how the Supertrend indicator works or successfully executing a few trades using the indicator.
Always backtest your strategies

As a trading expert, I can tell you that making the most out of the Supertrend indicator requires a balanced approach that includes continuous learning, disciplined trading, and smart risk management.
First off, never stop learning. Keep yourself updated and always look for ways to enhance your trading knowledge. Dive into online courses and webinars, and make it a habit to read market reports and financial news regularly. Backtesting your strategies with historical data is a great way to understand how the Supertrend indicator works in different market conditions.
When it comes to trading, discipline is your best friend. Create a detailed trading plan that uses the Supertrend indicator and stick to it no matter what. Consistency is key here, and you need to manage your emotions to avoid making impulsive decisions that could hurt your trading.
Risk management is just as important. Protect your capital by using proper position sizing based on how much risk you’re comfortable with. Set stop-loss orders according to what the Supertrend indicator tells you, and make sure you adjust them as needed. Don’t forget to diversify your portfolio across different assets and markets to spread out the risk.
Conclusion
The Supertrend indicator is a really handy tool for traders who want to spot and take advantage of market trends. It blends price action with volatility to give clear buy and sell signals, which can fit into many different trading strategies. Whether you're just starting out or you've been trading for a while, knowing how to set up and use the Supertrend indicator can really boost your trading success.
FAQs
What is the Supertrend indicator used for?
The Supertrend indicator is used to identify the direction of the market trend and potential reversal points. It provides clear buy and sell signals based on price action and volatility, making it a valuable tool for trend-following strategies.
How is the Supertrend indicator calculated?
The Supertrend indicator is calculated using the median price and the Average True Range (ATR). The formula involves adding and subtracting a multiple of the ATR from the median price to create the upper and lower bands.
Can the Supertrend indicator be used for all types of trading?
Yes, the Supertrend indicator can be used for various types of trading, including swing trading, day trading, and intraday trading.
What are the potential drawbacks of relying solely on the Supertrend indicator?
Relying solely on the Supertrend indicator can be risky as it may not perform well in all market conditions, particularly in ranging or choppy markets. It is recommended to use it in conjunction with other technical indicators and risk management strategies to enhance its effectiveness.
Editors' Top Picks and Insights

Bitcoin price prediction based on RSI: Is BTC poised for a new rally?

Toncoin becomes Gram: Why Durov restored token's original name

Why Tether flipping Ethereum is a pivotal moment for crypto

MiCA deadline: Why crypto companies are leaving Europe

From “Holy Trinity” to WLD crash: How Arthur Hayes became a market-moving seller

The world's first trillionaire: How Musk built his fortune on electric cars, space and AI
Related Articles
Team that worked on the article
Parshwa is a content expert and finance professional possessing deep knowledge of stock and options trading, technical and fundamental analysis, and equity research. As a Chartered Accountant Finalist, Parshwa also has expertise in Forex, crypto trading, and personal taxation.
Dr. BJ Johnson is a PhD in English Language and an editor with over 15 years of experience. He earned his degree in English Language in the U.S and the UK.
Mirjan Hipolito is a journalist and news editor at Traders Union. She is an expert crypto writer with five years of experience in the financial markets.
An investor is an individual, who invests money in an asset with the expectation that its value would appreciate in the future. The asset can be anything, including a bond, debenture, mutual fund, equity, gold, silver, exchange-traded funds (ETFs), and real-estate property.
Diversification is an investment strategy that involves spreading investments across different asset classes, industries, and geographic regions to reduce overall risk.
Day trading involves buying and selling financial assets within the same trading day, with the goal of profiting from short-term price fluctuations, and positions are typically not held overnight.
Forex indicators are tools used by traders to analyze market data, often based on technical and/or fundamental factors, to make informed trading decisions.
A long position in Forex, represents a positive outlook on the future value of a currency pair. When a trader assumes a long position, they are essentially placing a bet that the base currency in the pair will appreciate in value compared to the quote currency.

-
 Afghanistan
-
 Albania
-
 Algeria
-
 Angola
-
 Argentina
-
 Armenia
-
 Australia
-
 Austria
-
 Azerbaijan
-
 Bahamas
-
 Bahrain
-
 Bangladesh
-
 Belarus
-
 Belgium
-
 Bolivia
-
 Botswana
-
 Brazil
-
 Brunei
-
 Bulgaria
-
 Cambodia
-
 Cameroon
-
 Canada
-
 Chile
Chile
-
 China
China
-
 Colombia
-
 Congo
Congo
-
 Costa Rica
-
 Cote d'Ivoire
-
 Croatia
-
 Cuba
Cuba
-
 Cyprus
-
 Czechia
-
 DR Congo
-
 Denmark
-
 Dominican Republic
-
 Ecuador
-
 Egypt
Egypt
-
 El Salvador
-
 Estonia
-
 Eswatini
-
 Ethiopia
-
 Finland
-
 France
-
 Georgia
-
 Germany
-
 Ghana
Ghana
-
 Greece
-
 Haiti
Haiti
-
 Hong Kong
-
 Hungary
-
 India
India
-
 Indonesia
-
 Iran, Islamic republic
-
 Iraq
Iraq
-
 Ireland
-
 Israel
-
 Italy
Italy
-
 Jamaica
-
 Japan
Japan
-
 Jordan
-
 Kazakhstan
-
 Kenya
Kenya
-
 Korea
Korea
-
 Kuwait
-
 Kyrgyzstan
-
 Laos
Laos
-
 Latvia
-
 Lebanon
-
 Lesotho
-
 Libya
Libya
-
 Lithuania
-
 Luxembourg
-
 Madagascar
-
 Malaysia
-
 Malta
Malta
-
 Mauritius
-
 Mexico
-
 Moldova
-
 Mongolia
-
 Montenegro
-
 Morocco
-
 Mozambique
-
 Myanmar
-
 Namibia
-
 Nepal
Nepal
-
 Netherlands
-
 New Zealand
-
 Nigeria
-
 North Macedonia
-
 Norway
-
 Oman
Oman
-
 Pakistan
-
 Palestine
-
 Panama
-
 Papua New Guinea
-
 Paraguay
-
 Peru
Peru
-
 Philippines
-
 Poland
-
 Portugal
-
 Puerto Rico
-
 Qatar
Qatar
-
 Reunion
-
 Romania
-
 Rwanda
-
 Saudi Arabia
-
 Serbia
-
 Singapore
-
 Slovakia
-
 Slovenia
-
 Somalia
-
 South Africa
-
 Spain
Spain
-
 Sri Lanka
-
 Sweden
-
 Switzerland
-
 Syria
Syria
-
 Taiwan
-
 Tajikistan
-
 Tanzania
-
 Thailand
-
 Trinidad and Tobago
-
 Tunisia
-
 Turkey
-
 UAE
UAE
-
 Uganda
-
 Ukraine
-
 United Kingdom
-
United States
-
 Uruguay
-
 Uzbekistan
-
 Venezuela
-
 Vietnam
-
 Yemen
Yemen
-
 Zambia
-
 Zimbabwe
- Forex
- Crypto
