Best Entry Strategies For Fast Moving Cryptos
Mastering aggressive entry strategies is paramount for traders seeking to capitalize on fast-moving rallies in cryptocurrencies.Let's look at bull flags and pennants, as well as two-day daily and weekly setups. Through case studies featuring popular cryptocurrencies like Render Token (RNDR/USD), Cardano (ADA/USD), and Algorand (ALGO/USD), readers will gain a strategic understanding of using short-term trend continuation setups. Whether you are a seasoned trader or a novice navigating the crypto landscape, this guide equips you with the knowledge needed to navigate fast-moving markets and extract potential profits with confidence. Dive into the intricacies of aggressive trading strategies and elevate your cryptocurrency trading game to a new level.
Start trading cryptocurrencies with BybitCase studies of short-term bullish continuation patterns
Included in the chart examples below are bull flags and pennants, which are classic short-term trend continuation consolidation patterns that typically occur in fast moving markets. In addition, two-day and two-week patterns are considered where upside momentum remains strong. In other words, within a strong rising trend.
Bull Flags and Pennants
Bull flags and pennants are usually preceded by relatively fast moves with the expectation that the aggressive advance will continue once the consolidation pattern is complete. Other technical analysis evidence showing strength can be used to back up bullish signs indicated by the pattern alone and help distinguish the best setups from a selection of opportunities.
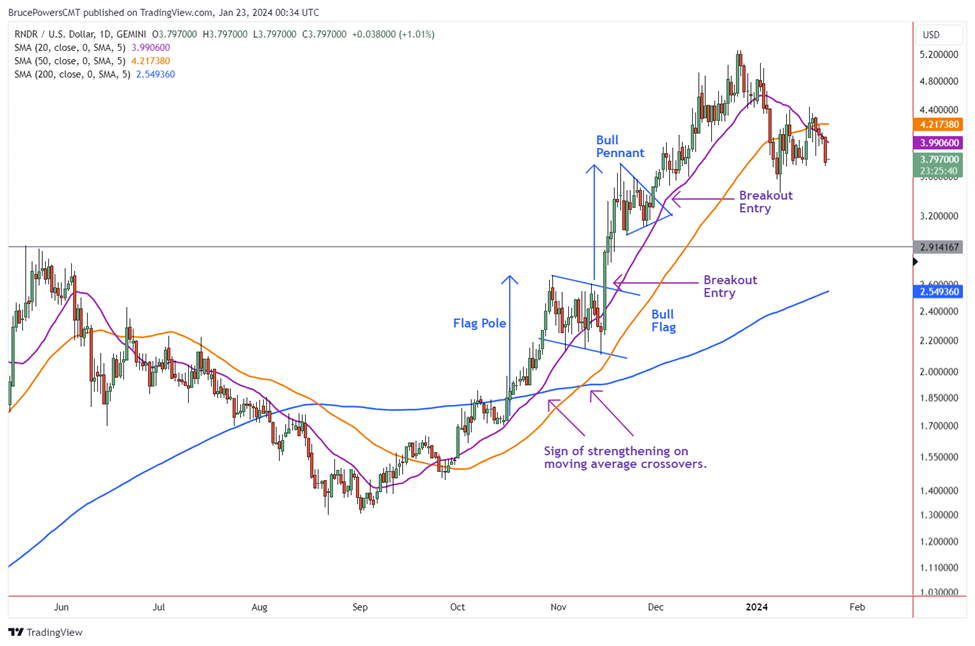
This first daily chart example is of the Render Token (RNDR/USD). The clues that momentum is improving and that an acceleration of the trend may be forthcoming first showed up when price got above and stayed above the 20-day MA (purple) in late-September. It then rose above the 200-day MA (blue). Subsequently, the 20-day and 50-day MAs (orange) crossed above the 200-day MA, further providing signs of strength. Once the rally exhausted the RNDR/USD pair moved into a consolidation phase that took the form of a bull flag. It is the consolidation pattern bounded by parallel lines.
Bull flags and pennants
The bull flag offers a bullish setup with two typical entry possibilities. The first is on the initial breakout and the second is following the first throwback. This is typical of any breakout strategy. The breakout price level can be determined from several price points in this example.
Best crypto exchanges


Three possible entry levels
The first entry possibility is on a breakout of the top trendline of the pattern. This example is like the second entry option, but that will not always be the case. Next, the center swing high that provides the second touch of the top boundary trend line at $2.61 can be used as a breakout trigger. And finally, the top of the pattern and swing high at $2.67 can be used. The high price trigger provides greater confidence that upward momentum may continue as a trend continuation signal is confirmed on the rise above the prior trend high. Moreover, a lower entry means a better price but greater chance that the breakout won’t follow through.
An initial long entry is typically executed a little above the initial breakout level to better ensure that resistance has been cleared. Traders generally look for a breakout entry from $0.08 to $0.20 beyond the breakout signal level. Protective stop triggers can use a similar standard. Following the breakout an initial protective stop can be placed below the lower end of the flag, at a maximum, or halfway through the flag, for example. The 50-Day MA is also a possibility in this example as it is near the low end of the pennant. It can be useful when trailing a stop based on pattern growth, along with the 20-Day line.
What you don’t see in the flag example is a chance for a throwback entry anywhere near the initial breakout as the move is too sharp, underlining the strength of momentum. A more aggressive throwback entry strategy can be implemented to buy around support of the 20-Day MA during short-term weakness. That opportunity did not exist with the flag pattern, but it could have been used for the pennant breakout, discussed in next section.
Bull Pennant in RNDR/USD
Following the breakout and an advance to $3.74, the RNDR/USD pair moved into consolidation once more. This time, the pattern was a bull pennant. A bull pennant takes the form of a small symmetrical triangle. The price range is compressed over time until either the buyers or sellers take control, leading to an upside breakout or breakdown, respectively. Given that the pattern occurs within a bull trend, the expectation is for an upside breakout. A breakdown would signal a pattern failure. And pattern failures do happen, which is why traders use protective stops.
In this example, a typical breakout entry would be placed either $0.15 above the trend line, the swing high in the center of the pattern at $3.60, or the high of the pennant and trend at $3.64. Waiting for the $3.64 breakout would have gotten a trader in relatively late. Given the slope of resistance in a pennant, a trendline break is usually going to provide better reward versus risk. It would have been a better entry in this example. Yet, a topside breakout more clearly confirms the breakout as it is also signaling a continuation of the trend.
Subsequently, entries near lows of the couple throwbacks near the 20-Day MA can be utilized. Typically, a trader would use intraday chart setups to take entries as close as possible to the 20-Day line. By the time a pennant breakout triggered RNDR/USD was rising within the third leg up thereby putting it at greater risk of hitting resistance that leads to a notable correction.
Inside Days
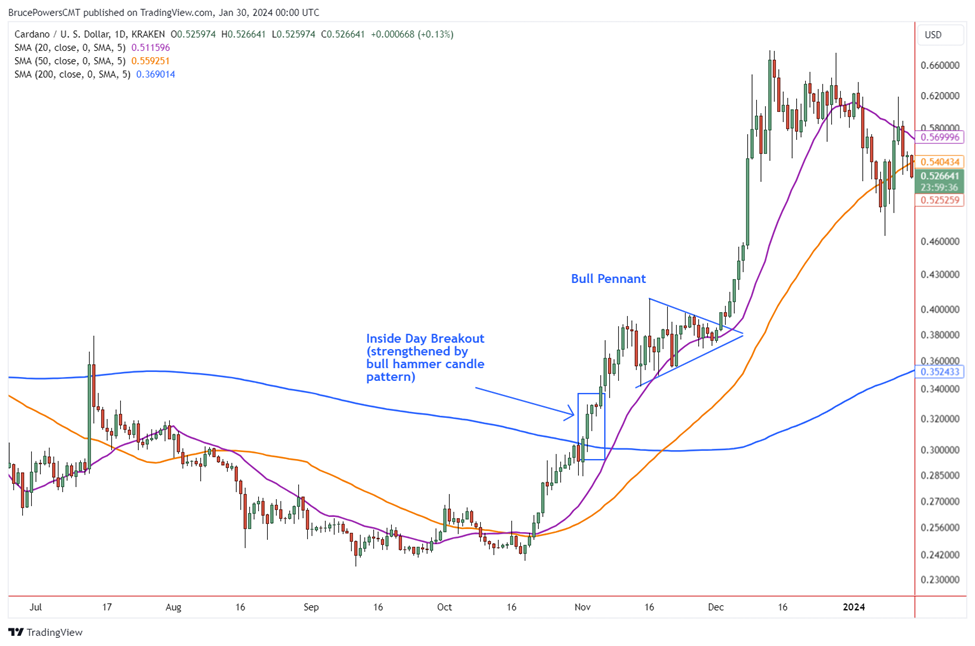
This next example looks at the chart of Cardano (ADA/USD). First, there are signs of strengthening as price rallies up and away from the purple 20- and orange 50-day MAs in October, and then rises above the blue 200-day MA. The breakout above the 200-day line quickly establishes a two-candle setup. An inside day takes the form of a bullish hammer candlestick pattern. It shows sellers in control earlier in the session but by the end of the session buyers were back in control thereby increasing the chance for a continuation the next day. Instead, a breakout did occur, but it was followed by a stall and narrow range day with no upside follow through. The upside continuation started the second day after the breakout. The inside day shows consolidation as the trend did not progress with a higher daily high. Following the inside day breakout, ADA/USD formed a bull pennant.
Inside Days
Inside Week Pattern
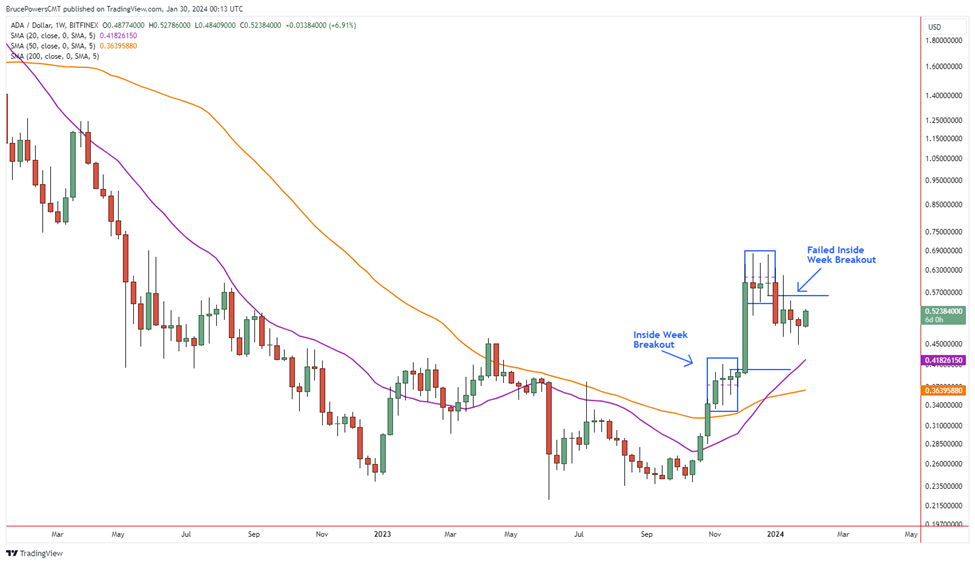
Another way to view the bull pennant or any pattern is with the weekly chart. A weekly chart can be especially useful when the consolidation pattern is not clear and may not conform to classic price patterns on the daily chart. It is also useful in confirming what is assessed in the daily chart.
The first example shows a trend high weekly candle followed by an inside week (also a bull hammer). That is the pennant on the daily chart. An initial breakout triggered above the inside week (blue horizontal), but the pair did not gain momentum until the following week. Typically, the initial protective stop would go below the inside week, and it was not triggered in this example.
Inside Week Pattern
The next highlighted pattern on the weekly chart of ADA/USD is of the top choppier consolidation pattern on the daily chart. Sometimes, seeing price behavior on a different pattern because of the time frame can improve both entries and risk management of a position. A bearish doji inverted hammer marked the trigger to get out of longs or enter shorts and therefore also a failure signal for the bullish breakout.
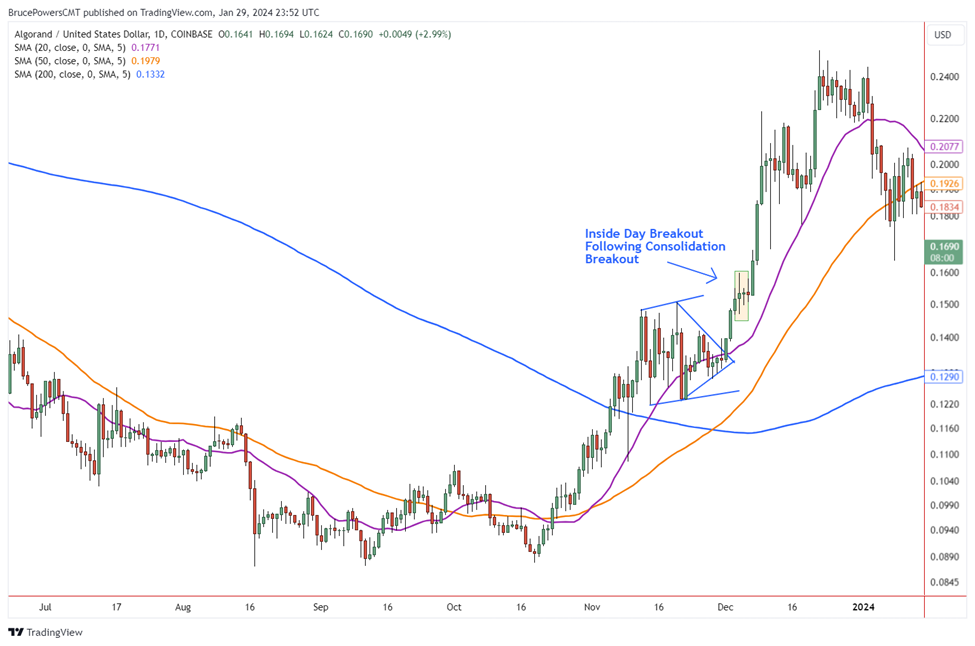
Finally, a chart of Algorand (ALGO/USD) is used for this next example where ALGO/USD breaks out above the 200-day MA in November and then consolidates. But the pattern is choppy and doesn’t become clear. Waiting would have been appropriate and those who did were met with another entry opportunity with an inside day breakout. An upside breakout is triggered on the advance above the inside day high with the initial protective stop below the low of that day at a minimum. Again, the uptrend broke out then took another rest day before proceeding higher with enthusiasm. There were three fast legs up to the advance before topping.
Inside Week Pattern
Glossary for novice traders
-
1
Risk Management
Risk management is a risk management model that involves controlling potential losses while maximizing profits. The main risk management tools are stop loss, take profit, calculation of position volume taking into account leverage and pip value.
-
2
Cryptocurrency
Cryptocurrency is a type of digital or virtual currency that relies on cryptography for security. Unlike traditional currencies issued by governments (fiat currencies), cryptocurrencies operate on decentralized networks, typically based on blockchain technology.
-
3
Bitcoin
Bitcoin is a decentralized digital cryptocurrency that was created in 2009 by an anonymous individual or group using the pseudonym Satoshi Nakamoto. It operates on a technology called blockchain, which is a distributed ledger that records all transactions across a network of computers.
-
4
Leverage
Forex leverage is a tool enabling traders to control larger positions with a relatively small amount of capital, amplifying potential profits and losses based on the chosen leverage ratio.
-
5
Breakout trading
Breakout trading is a trading strategy that focuses on identifying and profiting from significant price movements that occur when an asset's price breaches a well-defined level of support or resistance.
Related Articles


Team that worked on the article

Bruce Powers is an expert trader and technical analyst with over 20 years of experience in Forex, commodities, ETFs, cryptocurrencies and other assets. He is an active trader, technical and fundamental analyst, media commentator, educator and a writer. As an author for Traders Union, he contributes his deep analytical skills, expertise and understanding of the global economy and financial markets to provide market analysis and insights. Powers is also a frequent guest on business TV news shows.

Dr. BJ Johnson is a PhD in English Language and an editor with over 15 years of experience. He earned his degree in English Language in the U.S and the UK. In 2020, Dr. Johnson joined the Traders Union team. Since then, he has created over 100 exclusive articles and edited over 300 articles of other authors.

Tobi Opeyemi Amure is an editor and expert writer with over 7 years of experience. In 2023, Tobi joined the Traders Union team as an editor and fact checker, making sure to deliver trustworthy and reliable content. The topics he covers include trading signals, cryptocurrencies, Forex brokers, stock brokers, expert advisors, binary options.
Tobi Opeyemi Amure motto: The journey of a thousand miles begins with a single step.
