On-Chain Metrics And Indicators
On-chain metrics and indicators are measurements of various aspects of the blockchain. These metrics and indicators are based on the publicly available data that is recorded and verified on the blockchain, which makes them transparent and reliable.
Unlike off-chain metrics and indicators, which rely on external sources such as social media, news, or surveys, on-chain metrics and indicators are directly derived from the blockchain itself, which is the source of truth for the cryptocurrency market.
On-chain metrics and indicators can help investors understand the current state and trends of the market, as well as identify potential opportunities and risks. They can also be used to compare different cryptocurrencies and evaluate their relative strengths and weaknesses.
Start trading cryptocurrencies with BybitUsing on-chain metrics and indicators
On-chain metrics and indicators are not meant to replace other forms of research, but to complement them and provide a more holistic and comprehensive view of the market.
For example, fundamental analysis focuses on the intrinsic value of a cryptocurrency, based on its underlying technology, innovation, adoption, and potential. Technical analysis focuses on the price movements and patterns of a cryptocurrency, based on historical data, trends, and indicators.
On-chain metrics and indicators can add another layer of information and perspective to your research, by revealing the actual behavior and sentiment of the market participants, as well as the network supply and demand dynamics. By combining on-chain metrics and indicators with fundamental analysis and technical analysis, traders gain a deeper and more nuanced understanding of the market, and make more informed and profitable decisions.
Best cryptocurrency exchanges


Types of on-chain metrics and indicators
There are several types of on-chain metrics and indicators, each with its own purpose and significance.
HODL Waves
HODL waves ("distribution waves") track the distribution of Bitcoin holdings among different ownership timeframes. They represent the cumulative amount of Bitcoin held by addresses that have been active within a specific time range.
For example, in the image reproduced below, the colored bands show the relative fraction of Bitcoin in existence that was last transacted within the time window indicated in the legend. The dark blue wave represents the amount of Bitcoin in existence that was last transacted more than 10 years prior to the denoted date (Nov 13, 2021). Similarly, the light blue wave represents the amount of Bitcoin in existence that was last transacted between 7 and 10 years prior to the denoted date (Nov 13, 2021).
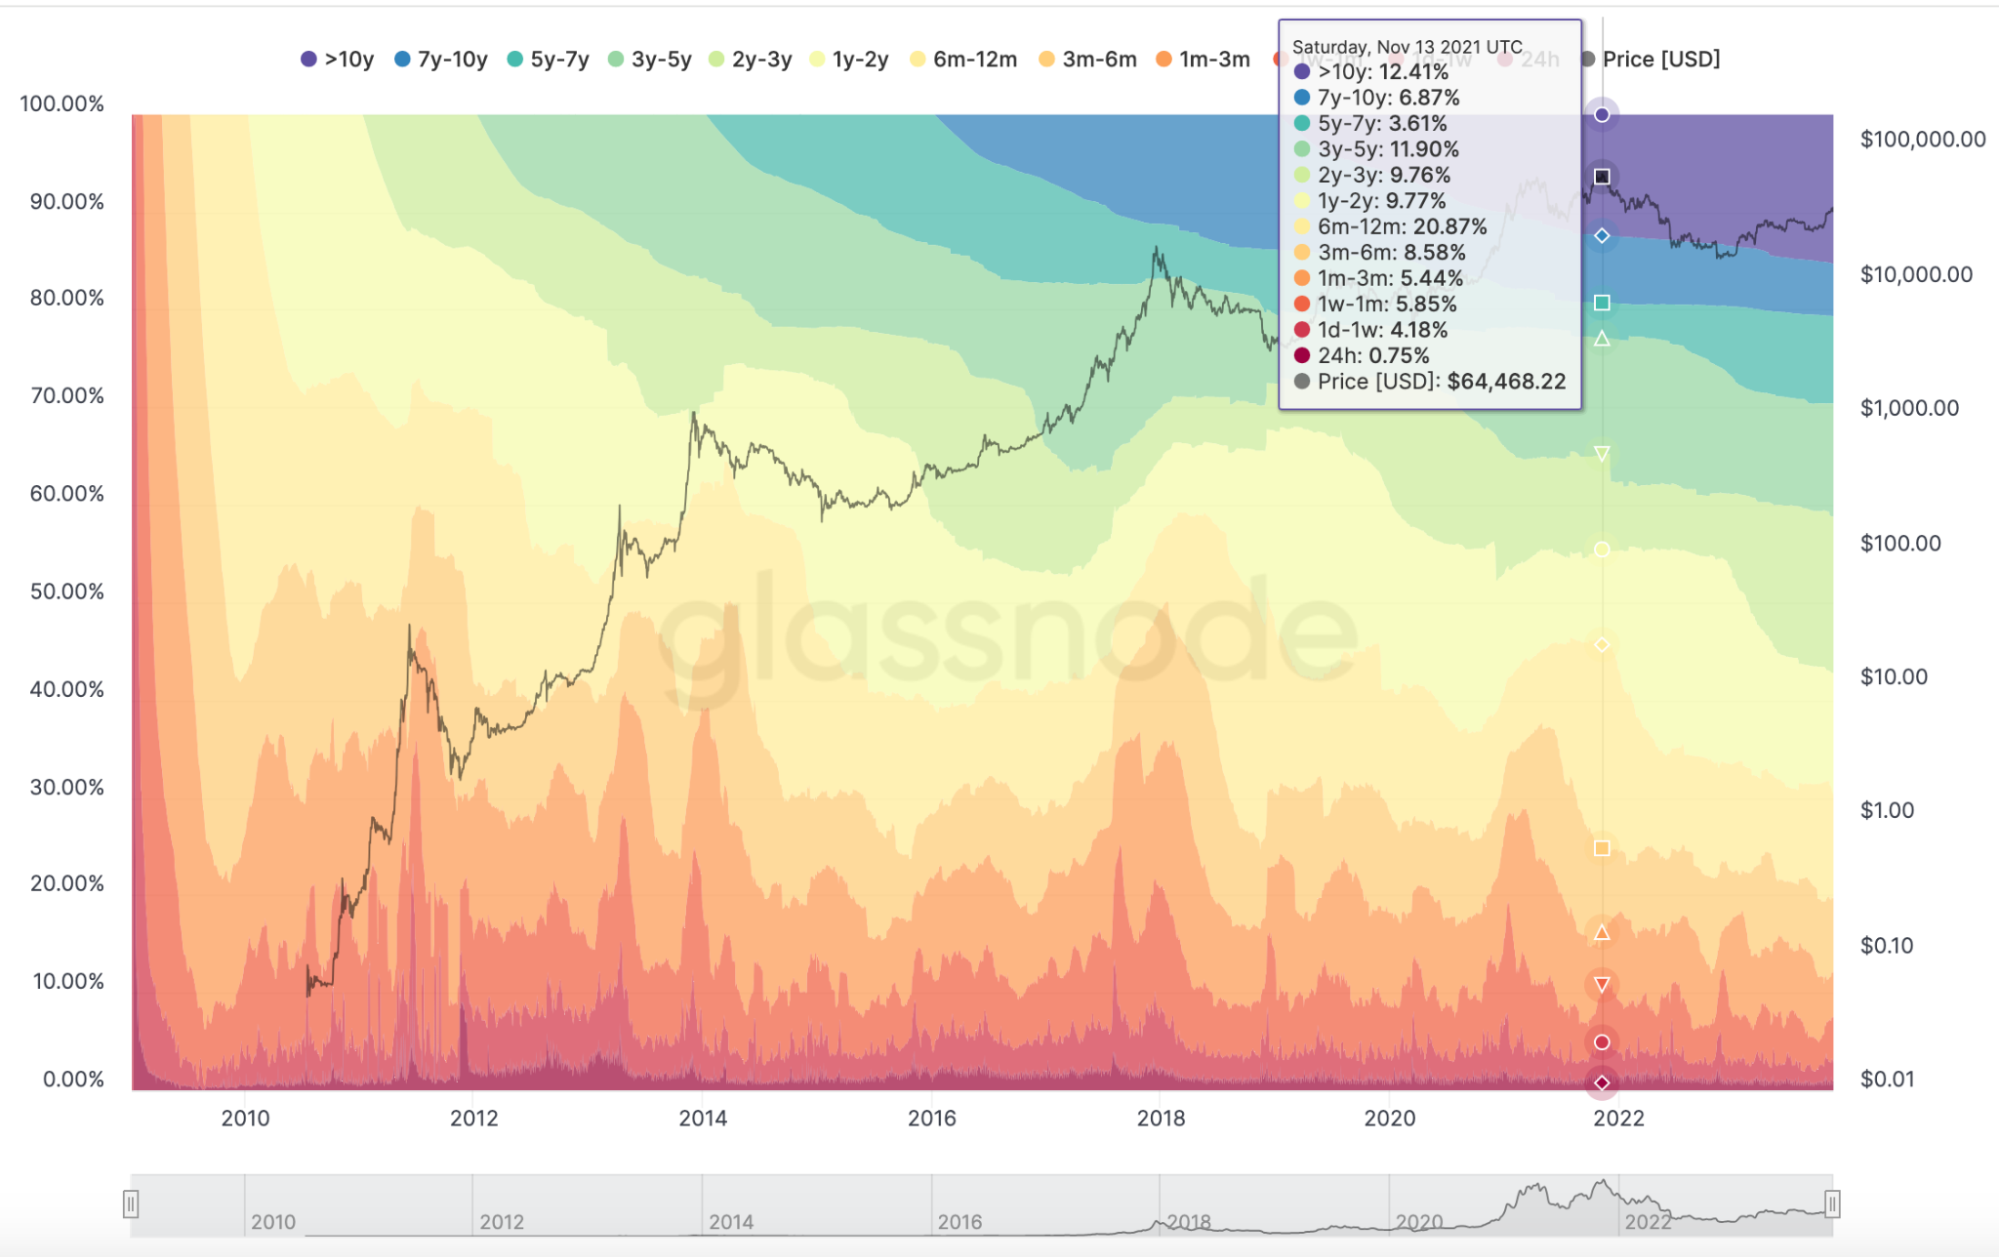
HODL Waves (source : unchained.com)
HODL waves can be used to gauge the overall sentiment of Bitcoin holders and make informed trading decisions.
When HODL waves are ascending, it suggests that a significant portion of Bitcoin holders are accumulating or holding their coins for an extended period. This can indicate growing confidence and long-term bullish sentiment, potentially leading to upward price pressure.
Conversely, descending HODL waves suggest that a significant portion of Bitcoin holders are distributing or selling their coins. This indicates declining confidence and short-term bearish sentiment, potentially leading to downward price pressure.
Total Value Locked (TVL)
Total Value Locked (TVL) represents the total value of digital assets locked or staked in DeFi protocols. It reflects the overall activity and liquidity within the DeFi ecosystem. TVL is measured in US dollars and is calculated by summing up the value of all assets locked in DeFi protocols, such as lending protocols, decentralized exchanges, and yield farming platforms.
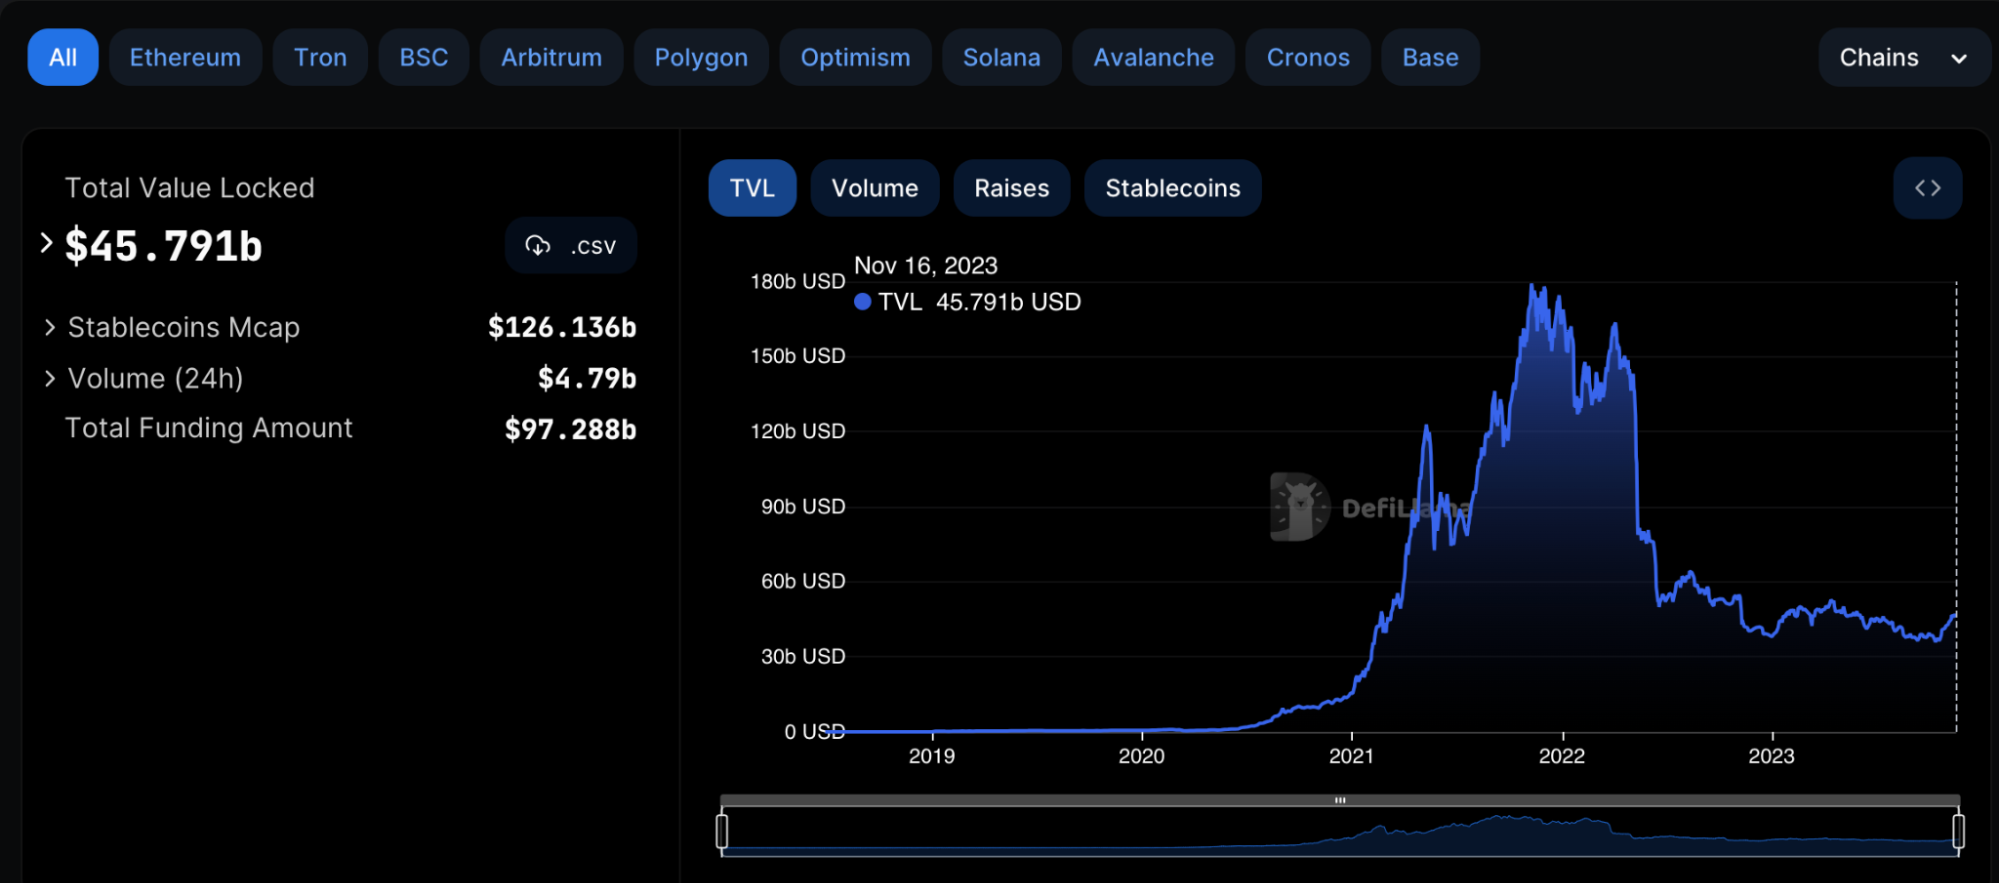
Total Value Locked (source : defilama.com)
Traders utilize TVL to gauge the overall health and growth of the DeFi ecosystem and make informed trading decisions. When TVL is increasing, it suggests that more users are depositing funds into DeFi protocols, potentially indicating growing confidence and demand for DeFi services. This can lead to increased token prices and overall bullish sentiment in the DeFi sector.
When TVL is decreasing, it suggests that users are withdrawing funds from DeFi protocols, potentially indicating a decline in confidence or demand for DeFi services. This can lead to decreased token prices and overall bearish sentiment.
Minor Outflows
Minor outflows refer to a situation where a significant amount of cryptocurrency is being withdrawn from cryptocurrency exchanges. This can be a sign that whales, or large investors, are moving their funds off exchanges and into cold storage. This can happen for several reasons, such as a fear of a market crash or a desire to take profits.
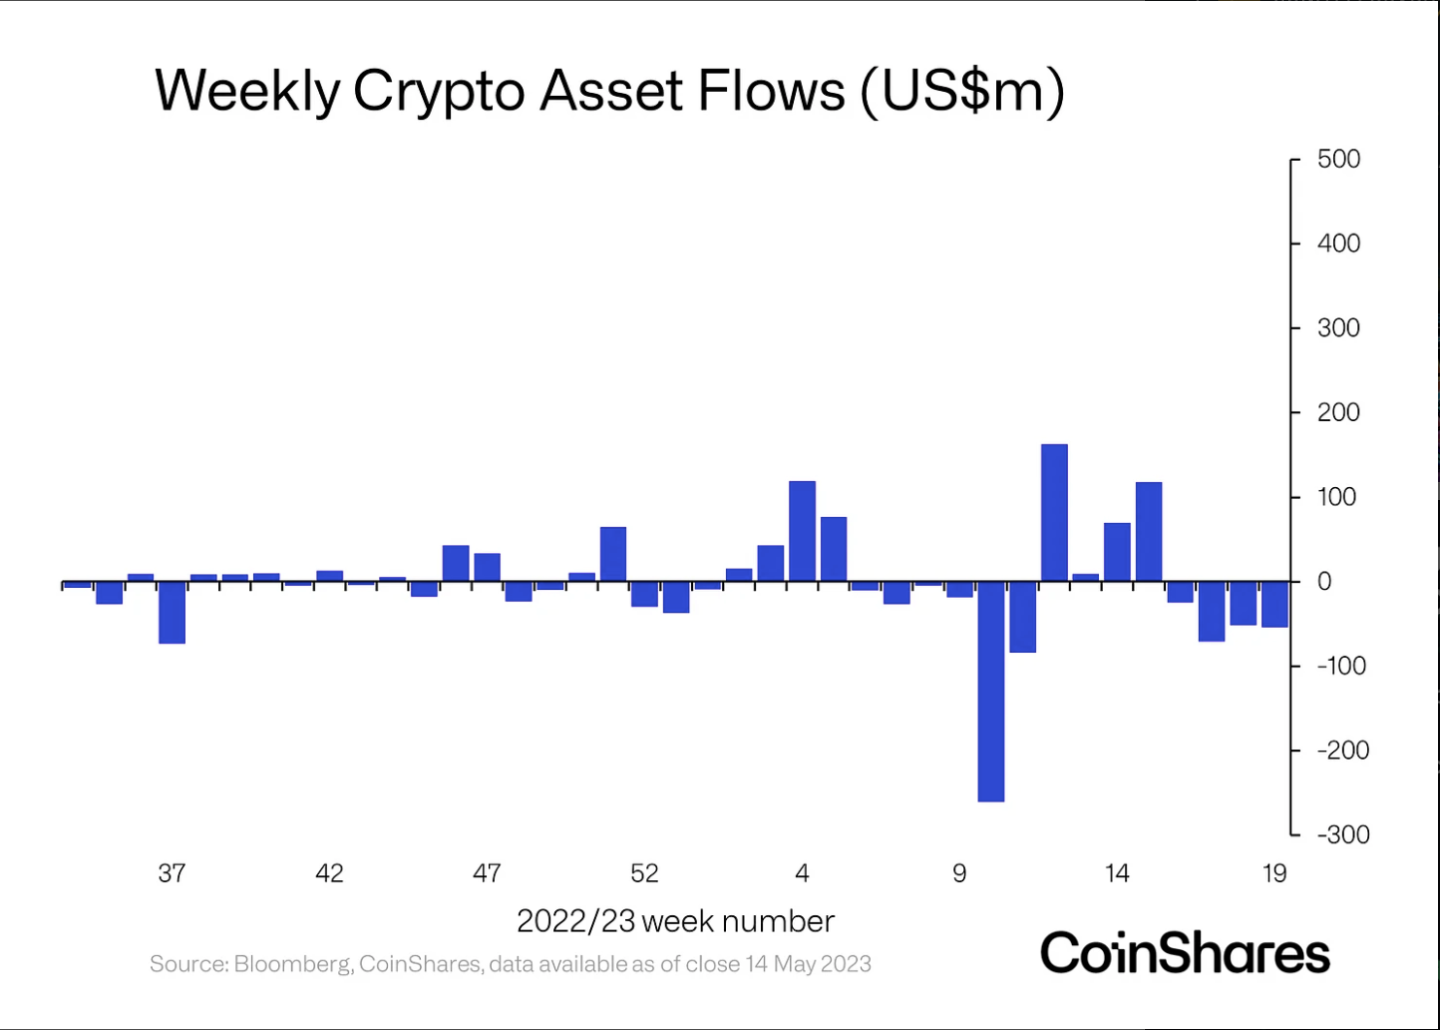
Weekly Crypto Outflows (source : CoinShares.com)
Crypto traders can rely on minor outflows as a signal to make trades. If they see that there are significant outflows from exchanges, they may want to sell some of their cryptocurrency in case the price crashes. Conversely, if they see that outflows are slowing down, they may want to buy some cryptocurrency in anticipation of a price rebound.
Exchange Flows
Exchange Flows measure the movement of cryptocurrencies into and out of cryptocurrency exchanges. It's a key metric for understanding market sentiment and potential price movements.
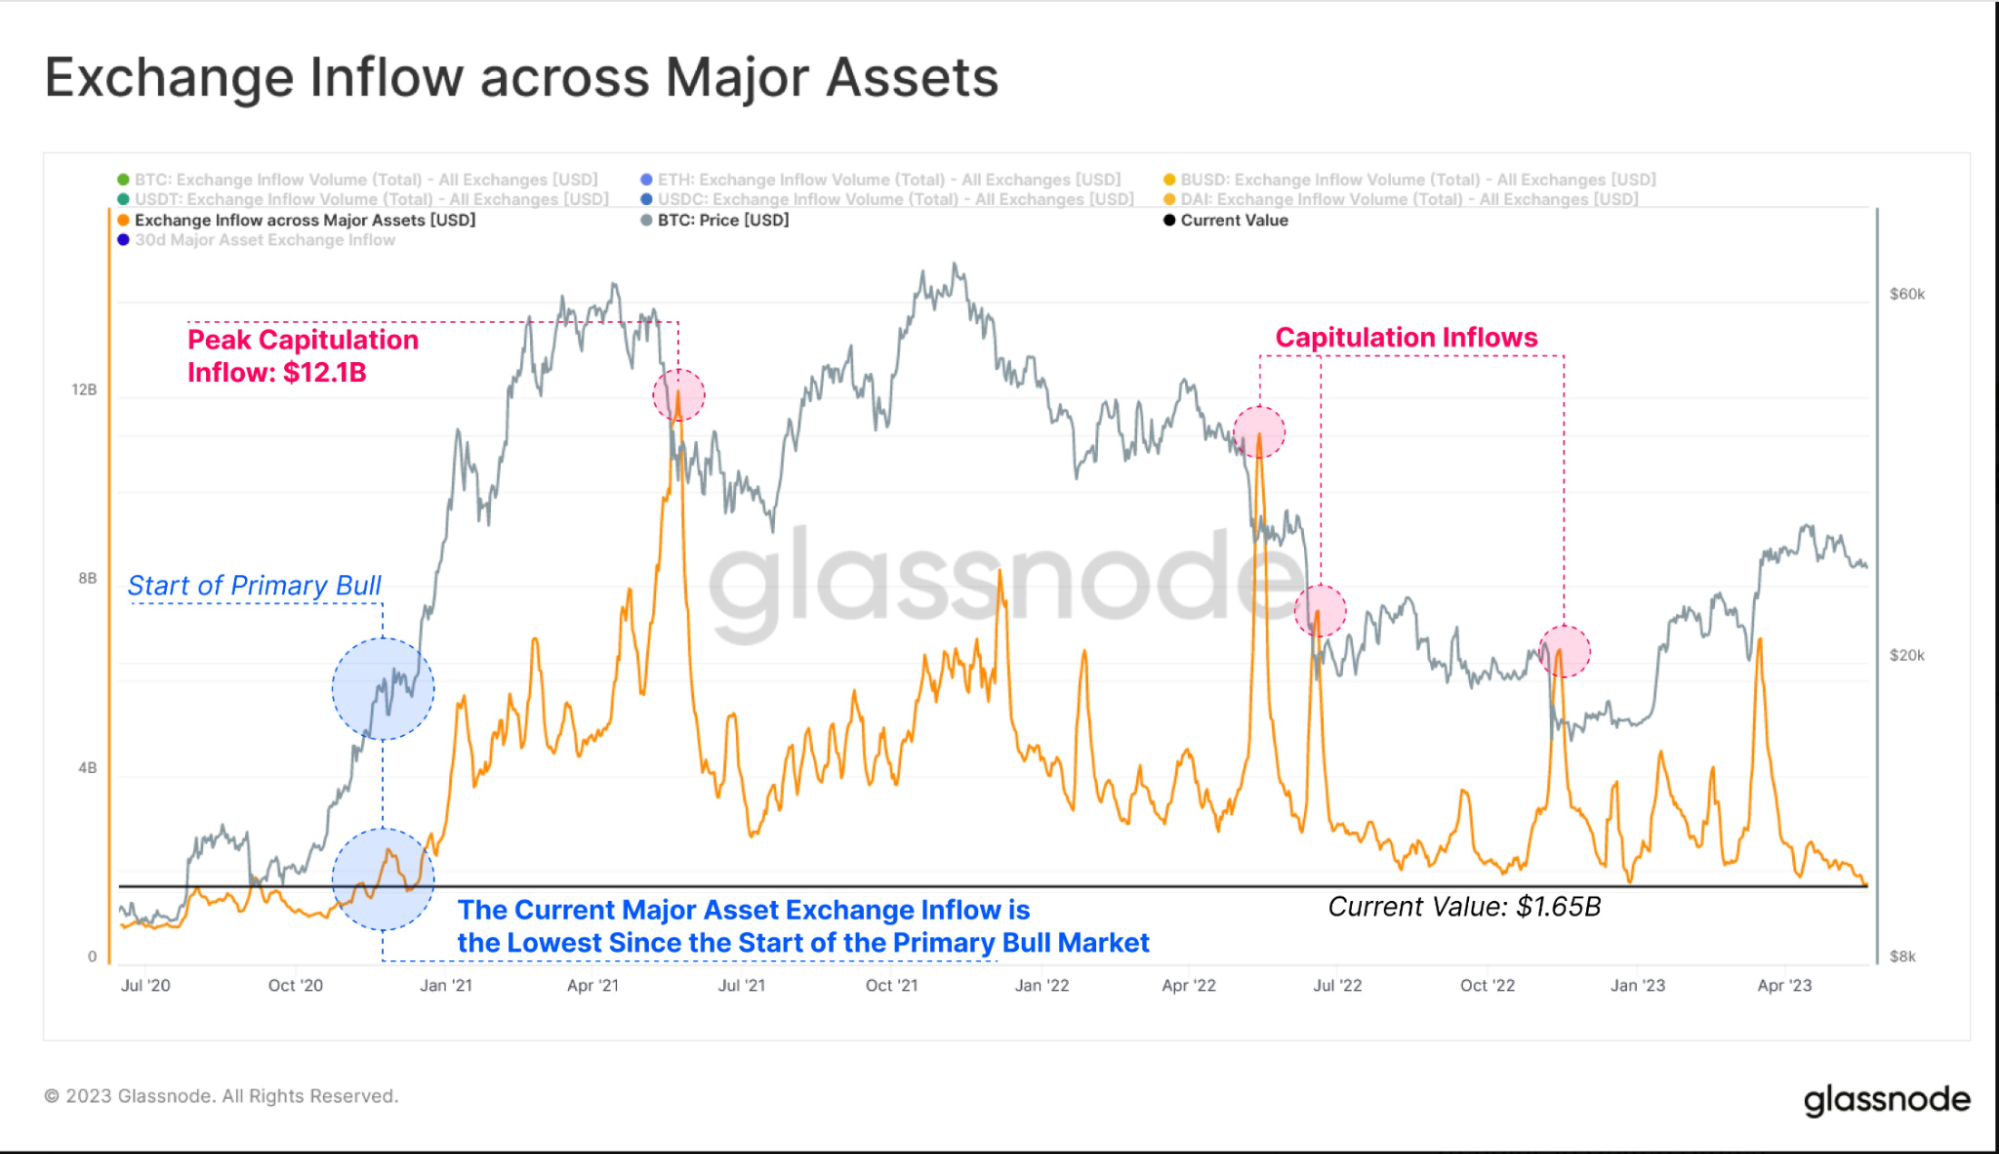
Exchange Flows (source : Glassnode.com)
Traders utilize exchange flows to gauge market sentiment and make informed trading decisions. When exchange flows are positive, indicating a net inflow of cryptocurrencies into exchanges, it suggests that traders are depositing funds to buy cryptocurrencies. This can lead to increased buying activity and upward price pressure.
And when exchange flows are negative, indicating a net outflow of cryptocurrencies from exchanges, it suggests that traders are withdrawing funds to sell cryptocurrencies. This can lead to increased selling activity and downward price pressure.
Net Unrealized Profit/Loss (NUPL)
Net Unrealized Profit/Loss (NUPL) is a crucial metric reflecting the overall profitability or loss of cryptocurrency holders. It represents the average difference between the current market price of a cryptocurrency and the average purchase price of all holders. NUPL is expressed as a percentage, with positive values indicating overall profitability and negative values indicating overall losses.
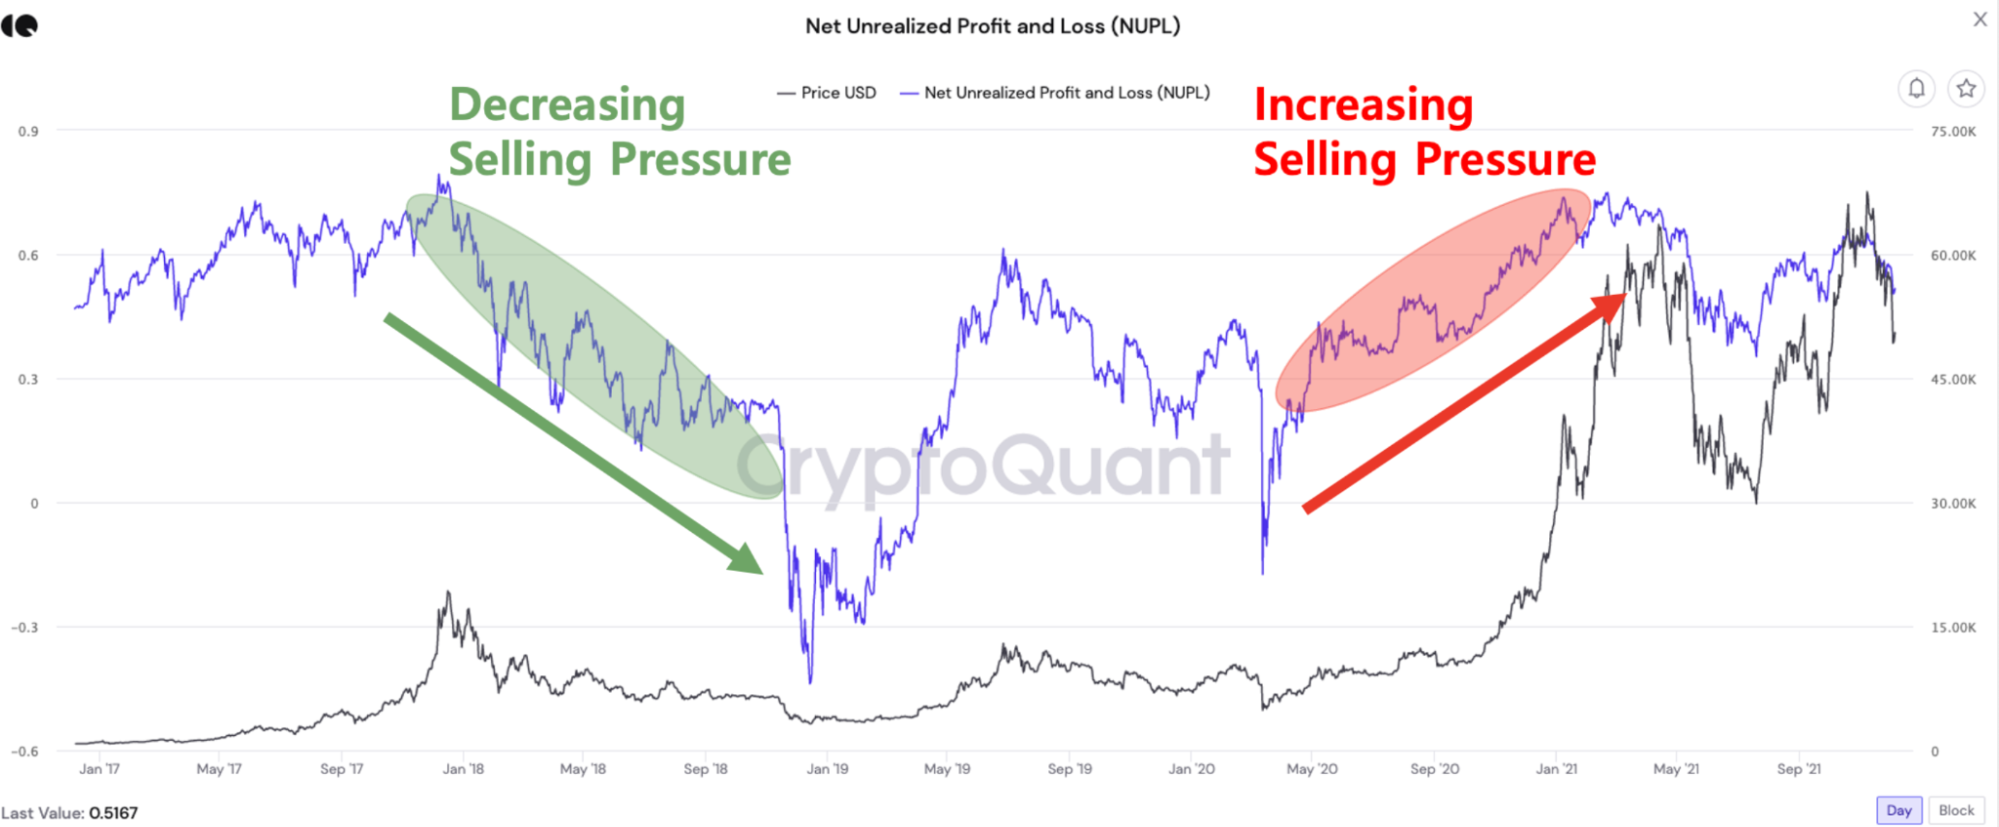
NUPL (source : CryptoQuant.com)
When NUPL values are high, it suggests that a significant portion of holders are in profit, potentially leading to increased selling pressure as they take profits. This can trigger a downward trend in cryptocurrency prices.
Conversely, low NUPL values indicate that a majority of holders are experiencing unrealized losses, potentially decreasing selling pressure. This can lead to a consolidation phase or even a reversal in price direction as traders anticipate a potential recovery.
Market Value to Realized Value (MVRV)
Market Value to Realized Value (MVRV) represents the ratio of the current market capitalization of a cryptocurrency to its realized capitalization, which is the average purchase price of all circulating coins. MVRV is expressed as a multiple, with values greater than 1 indicating overall profitability and values less than 1 indicating overall losses.
When MVRV values exceed 1, it suggests that a significant portion of holders are in profit, potentially leading to increased selling pressure as they take profits. This can trigger a downward trend in cryptocurrency prices.
Alternatively, when MVRV values are significantly below 1, it indicates that a majority of holders are experiencing unrealized losses, potentially reducing selling pressure. This can lead to a consolidation phase or even a reversal in price direction as traders anticipate a potential recovery.
Dormant Coins
Dormant Coins are the coins that have not moved or changed wallets for a long time. They represent the coins that are held by long-term investors or lost by careless users.
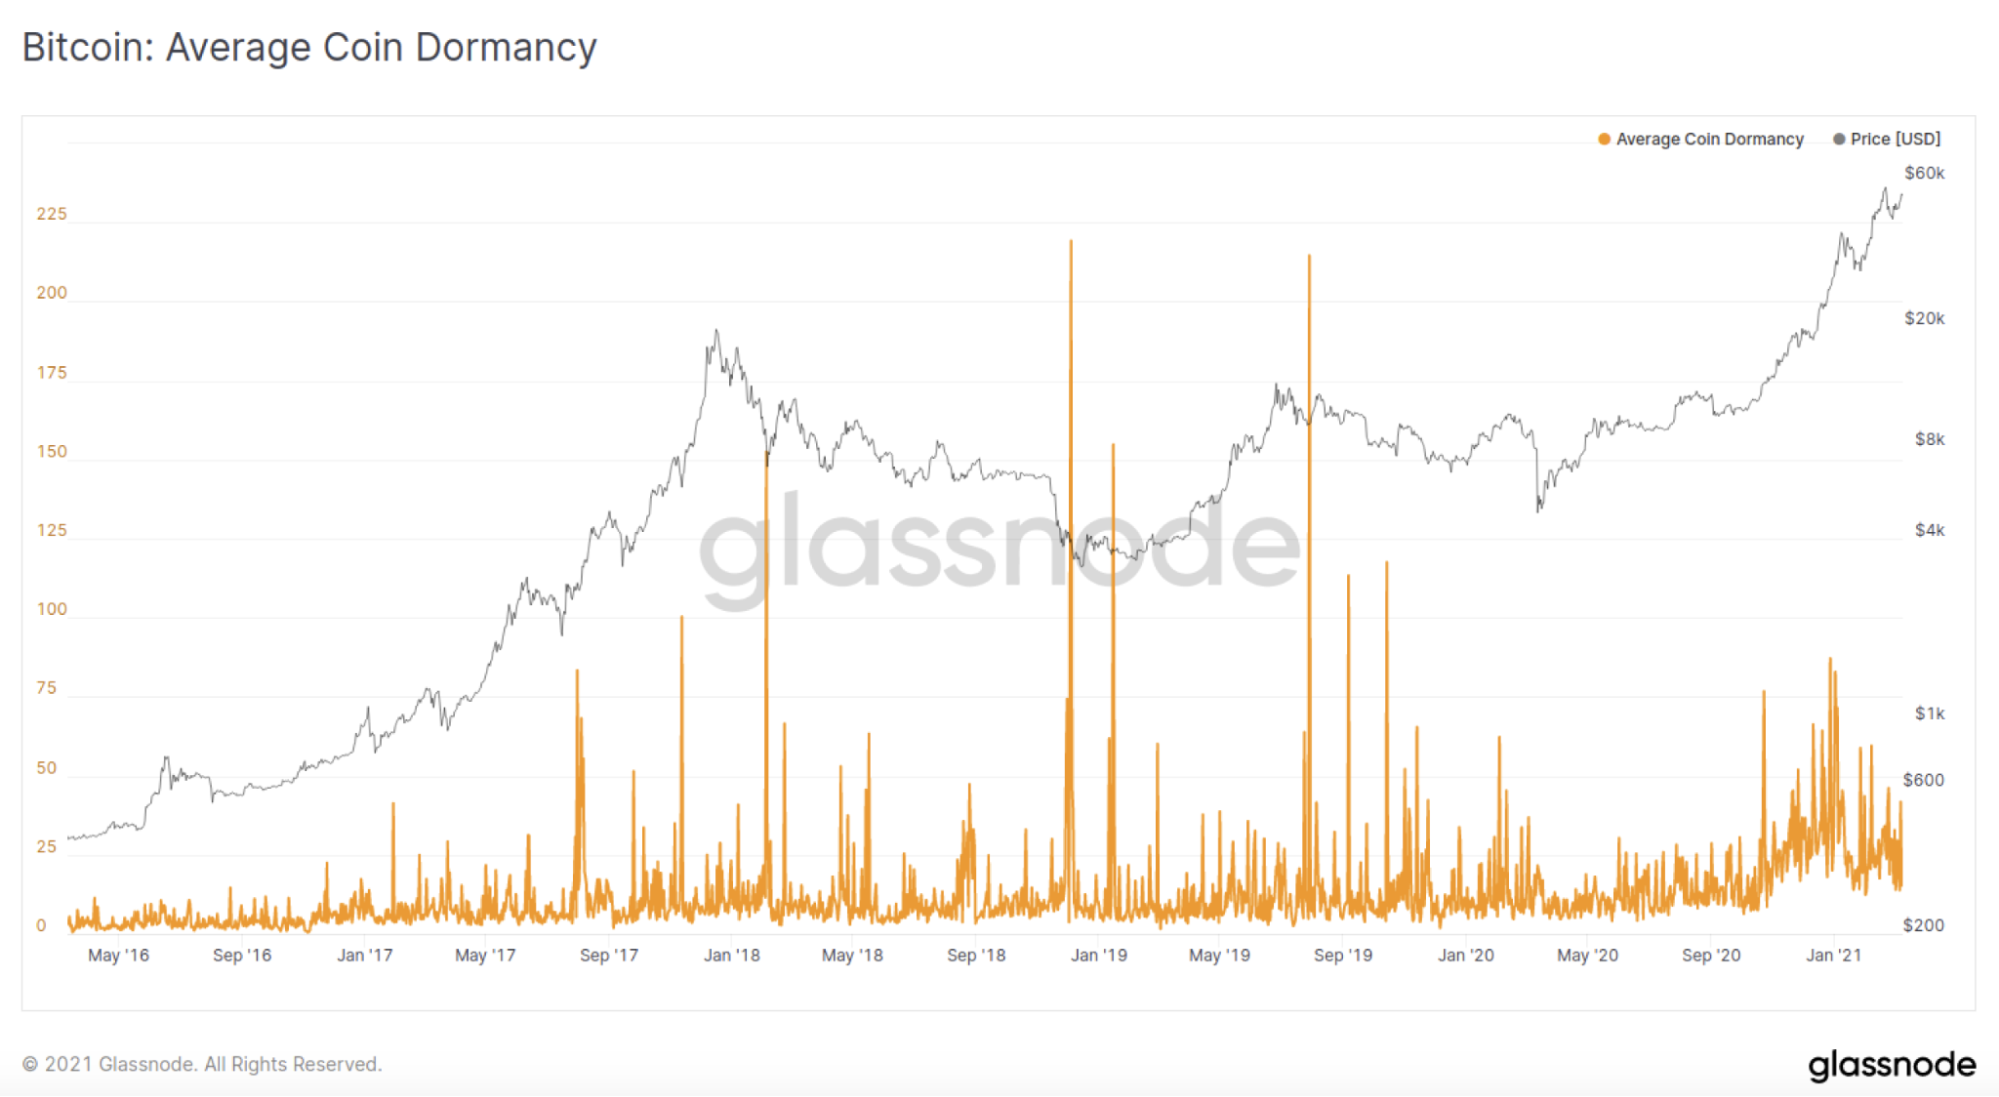
Bitcoin: Average Coin Dormancy (source : glassnode.com)
Dormant coins refer to cryptocurrencies that have not been moved or transferred for an extended period, typically measured in months or years. Tracking dormant coins can provide insights into the overall supply dynamics of a cryptocurrency and potential market movements.
When a significant amount of dormant coins are suddenly activated, it suggests that a portion of the cryptocurrency supply is entering the active market. This can potentially lead to increased trading volume and price fluctuations.
And when dormant coins remain inactive, it suggests that the overall supply is not changing significantly, potentially indicating a stable market or a lack of interest in that particular cryptocurrency.
Advantages of using on-chain metrics and indicators
Using on-chain metrics and indicators offers investors several advantages.
For example, they are based on the data that is recorded and verified on the blockchain, which is open and accessible to anyone. Unlike off-chain metrics and indicators, which may be subject to manipulation, distortion, or error, on-chain metrics and indicators are objective and accurate, and can be independently verified and audited.
On-chain metrics and indicators also provide valuable insights into the activity and transactions on the blockchain, which can reveal the supply and demand dynamics, the sentiment and behavior of investors, and the overall health and performance of the network. By analyzing on-chain metrics and indicators, investors can gain a deeper and more nuanced understanding of the market, and identify potential opportunities and risks.
In addition, by using on-chain metrics and indicators, investors can spot trends and patterns that may not be visible or obvious from other forms of research, and make more informed and profitable decisions.
Conclusion
By using on-chain metrics and indicators, investors can complement their research, understand the current state and trends of the market, compare different cryptocurrencies, and evaluate their relative strengths and weaknesses. On-chain metrics and indicators also provide transparency and reliability, insight and perspective, and edge and advantage. By combining on-chain metrics and indicators with fundamental analysis and technical analysis, investors can gain a more holistic and comprehensive view of the market, and make more informed and profitable decisions.
Glossary for novice traders
-
1
Yield
Yield refers to the earnings or income derived from an investment. It mirrors the returns generated by owning assets such as stocks, bonds, or other financial instruments.
-
2
Ethereum
Ethereum is a decentralized blockchain platform and cryptocurrency that was proposed by Vitalik Buterin in late 2013 and development began in early 2014. It was designed as a versatile platform for creating decentralized applications (DApps) and smart contracts.
-
3
Investor
An investor is an individual, who invests money in an asset with the expectation that its value would appreciate in the future. The asset can be anything, including a bond, debenture, mutual fund, equity, gold, silver, exchange-traded funds (ETFs), and real-estate property.
-
4
Extra
Xetra is a German Stock Exchange trading system that the Frankfurt Stock Exchange operates. Deutsche Börse is the parent company of the Frankfurt Stock Exchange.
-
5
Cryptocurrency
Cryptocurrency is a type of digital or virtual currency that relies on cryptography for security. Unlike traditional currencies issued by governments (fiat currencies), cryptocurrencies operate on decentralized networks, typically based on blockchain technology.
Related Articles


Team that worked on the article

Thomas Wettermann is an experienced writer and a contributor to the Traders Union website. Over the last 30 years, he has written posts, articles, tutorials, and publications on several different high tech, health, and financial technologies, including FinTech, Forex trading, cryptocurrencies, metaverses, blockchain, NFTs and more. He is also an active Discord and Crypto Twitter user and content producer.

Dr. BJ Johnson is a PhD in English Language and an editor with over 15 years of experience. He earned his degree in English Language in the U.S and the UK. In 2020, Dr. Johnson joined the Traders Union team. Since then, he has created over 100 exclusive articles and edited over 300 articles of other authors.

Tobi Opeyemi Amure is an editor and expert writer with over 7 years of experience. In 2023, Tobi joined the Traders Union team as an editor and fact checker, making sure to deliver trustworthy and reliable content. The topics he covers include trading signals, cryptocurrencies, Forex brokers, stock brokers, expert advisors, binary options.
Tobi Opeyemi Amure motto: The journey of a thousand miles begins with a single step.
