ТОР 10 Best Crypto Indicators For Beginners


It is pretty hard to predict the direction a cryptocurrency's price will head, and that is why we have indicators. Used by traders, best crypto indicators are like tools combined with technical analysis to predict the value of a cryptocurrency and the movement at its price with accuracy. If you are a beginner in trading and want to learn about these market signals, this article will help you explore the nitty-gritty details of the best indicator for cryptocurrency.
Start trading crypto right now with Coinbase!What is Technical Analysis and Technical Indicators
Technical analysis crypto is a process or a mechanism through which you can forecast an asset's price direction. The direction depends on the volume of the asset and its past market price.
Technical analysis is a helpful process, and to succeed in it, experts utilize many different technical analysis indicators. These indicators are pattern-based signals generated by volume, price, and interest of a contract or security used by traders who follow technical analysis.
Analysts evaluate and analyze historical data and then utilize these indicators to predict price movements.
How Do Technical Indicators Work?
As mentioned above, technical analysis is a unique trading discipline designed to evaluate and identify any trading opportunities through cryptocurrency. The method analyzes statistical trends collected through certain trading activities.
Technical analysts are pretty different from fundamental analysts. The latter category of professionals uses economic or financial data to evaluate the intrinsic value of a security. On the other hand, a technical analyst focuses on price movements, cryptocurrency technical analysis charts, and trading signals to identify the weaknesses or strengths of a specific cryptocurrency.
Active traders use technical indicators to perform technical analysis. These indicators are also known as "technicals" that focus on trading data, including volume, open interest, and price.
What's more, technical indicators are often designed for short-term predictions on price movements. However, many long-term investors also utilize them to evaluate exit and entry points.
There are two different types of technical indicators:
-
Overlays: These indicators use a similar scale that plots prices on a specific stock chart.
-
Oscillators: These indicators oscillate between a maximum or minimum local and are plotted below or above a price chart.
Traders often use more than one technical indicator to analyze and predict the price of a cryptocurrency. However, it is imperative that you understand an indicator well before using it to predict the price of a currency. You can also combine these indicators with other forms and categories of technical analysis to generate better predictions and results.
The next section of this article looks at different technical indicators available for cryptocurrencies. Again, since you are a beginner, go through each indicator's detail so that you can use them correctly in your trading strategy.
Best Technical Indicators for Cryptocurrency
Before selecting a technical indicator for cryptocurrency trading, you need to consider a few factors below:
-
Signal Interpretation: The best indicator is the one that interprets every signal. Even if used correctly, an indicator that generates false signals isn't worth your trading strategy.
-
Delays: Before using an indicator, ask yourself, does it generate results quickly, or are there any delays in its performance? An indicator that takes longer than usual to predict changes in prices and trend movements may not prove fruitful for you.
-
Your Crypto Understanding: Even if you are a beginner or a professional, you can't use an indicator until you have a good understanding of your cryptocurrency. If you don't have that, you might end up using it incorrectly and generating false results for your trading strategy.
Now that you know how to select a suitable indicator, below is the list of our top 10 technical indicators for cryptocurrency.
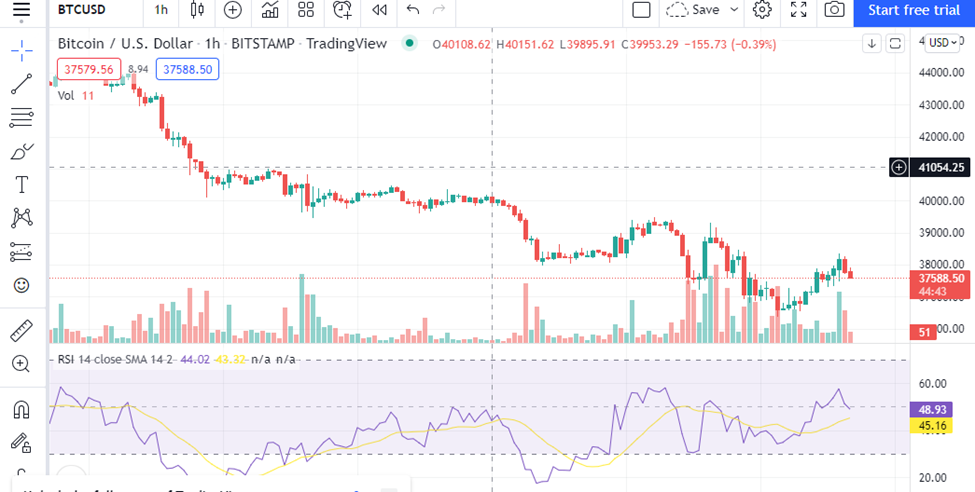
RSI
RSI or Relative Strength Index is a technical indicator that measures and identifies the weakness and strength of a particular asset during a change in its price. This analysis helps to evaluate whether an asset has been oversold or overbought.
Below is the formula used to calculate RSI for crypto trading:
RSI=100-100/1+RS
RSI is the average of periods that close up in prices divided by the average of periods that show a decrease in the price. Most times, traders use 14 periods, but it all comes down to individual preferences.
For instance, if the value of RSI is below 30, it signifies that a particular asset has been oversold. Alternatively, if its value exceeds 70, the asset has been overbought.
RSI
Here are some good and downsides of this indicator
👍 Pros
• Easy to implement
• Efficient in locating minimum loss of momentum
• Design to work in most non-trending zones
👎 Cons
• Entirely ignores volume during key reversal levels
Stochastic Oscillator
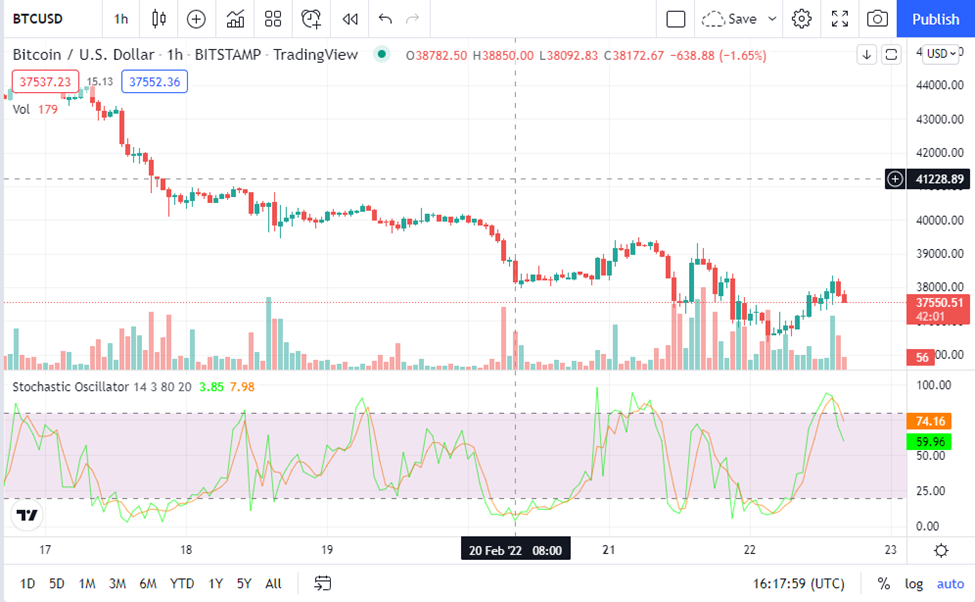
Designed to be a momentum indicator, Stochastic Oscillator compares a specific closing price of a cryptocurrency with a wide range of its prices during a particular time. The indicator generates oversold and overbought trading signals using a specific range of values.
Below is the formula used for this indicator:
Slow %K= 100 [Sum of the (C – L14) for the %K Slowing Period / Sum of the (H14 – L14) for the %K Slowing Period] Slow %D = SMA of Slow %K
C=Latest Close
L14=Lowest low in the last 14 days
H14= Highest high for the same period
%K Slowing period is 3
One of the best things about this indicator is that you don't have to measure it manually. Instead, trading platforms and chart software will automatically calculate the formula for you.
Stochastic Oscillator
Here are some positive features and downsides of the Stochastic Oscillator indicator.
👍 Pros
• Clear exit and entry signals
• Signals occur frequently
• Indicator available on many charting packages
👎 Cons
• Can generate false signals if utilized incorrectly
OBV
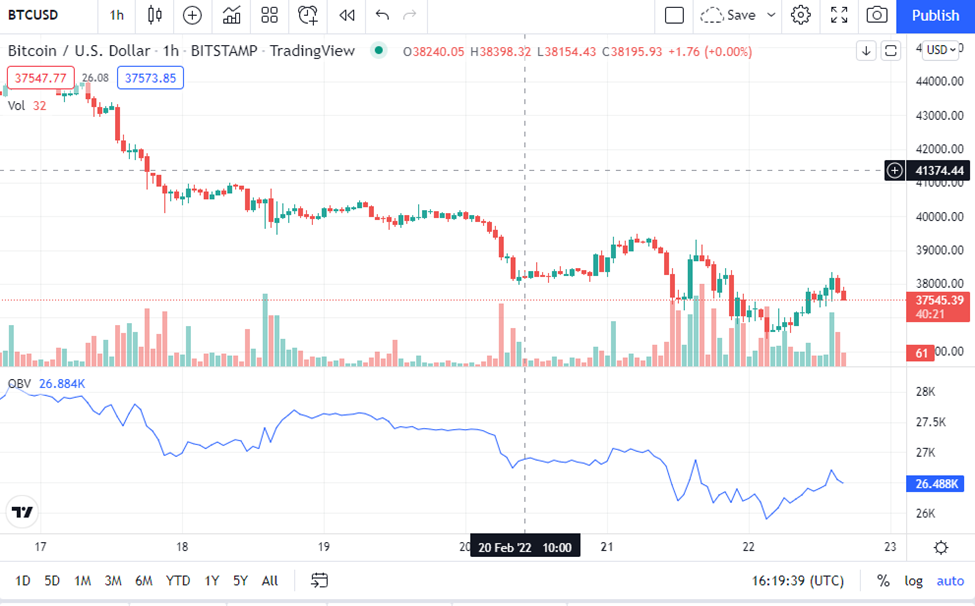
OBV or On Balance Volume utilizes an asset's volume flow to predict price changes. Further, it also determines the strength of a signal to sell or buy an asset.
This indicator is often used as a cumulative tool. For instance, if the price of an asset closes up, the day's volume is added to the total of OBV.
However, if the price of an asset closes down, the day's volume is subtracted from the total of OBV. If the price remains the same, no calculations happen.
OBV
Here are some good and bad points of this indicator:
👍 Pros
• Considered as a leading indicator
• Performs well during a good, trending market scenario
• Works well at identifying divergences
👎 Cons
• May produce false signals when used for short timeframes
• Not suitable for scalping
Aroon
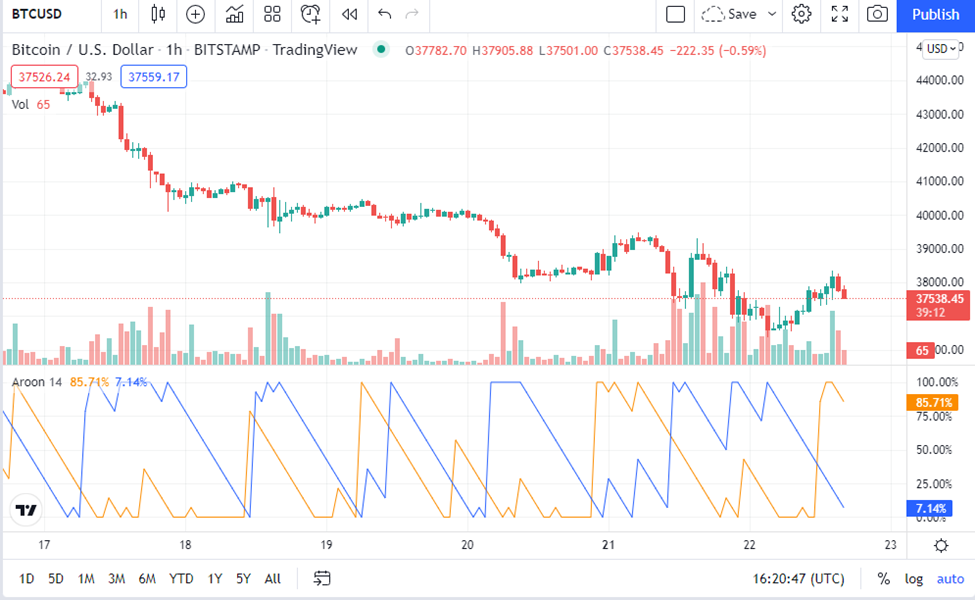
The Aroon indicator measures the strength of the trend and also evaluates all the changes in the price of an asset. In addition, it also measures the time between highs and lows over a certain period.
This is the formula for this indicator:
Aroon Up= 25-Period Since 25 Period High/25*100
Aroon Down= 25-Period Since 25 Period low/25*100
This calculation tracks the low and high prices during the last 25-day period. For this calculation to be accurate, you should measure the number of periods in the last lows and highs. Once you have found them, use them in the above formula.
Aroon
Here are some advantages and disadvantages of using this indicator.
👍 Pros
• Helps define an overall trend
• Accurate for long-term and short-term trading
• Generates good-quality signals
👎 Cons
• May produce lagging signals at times.
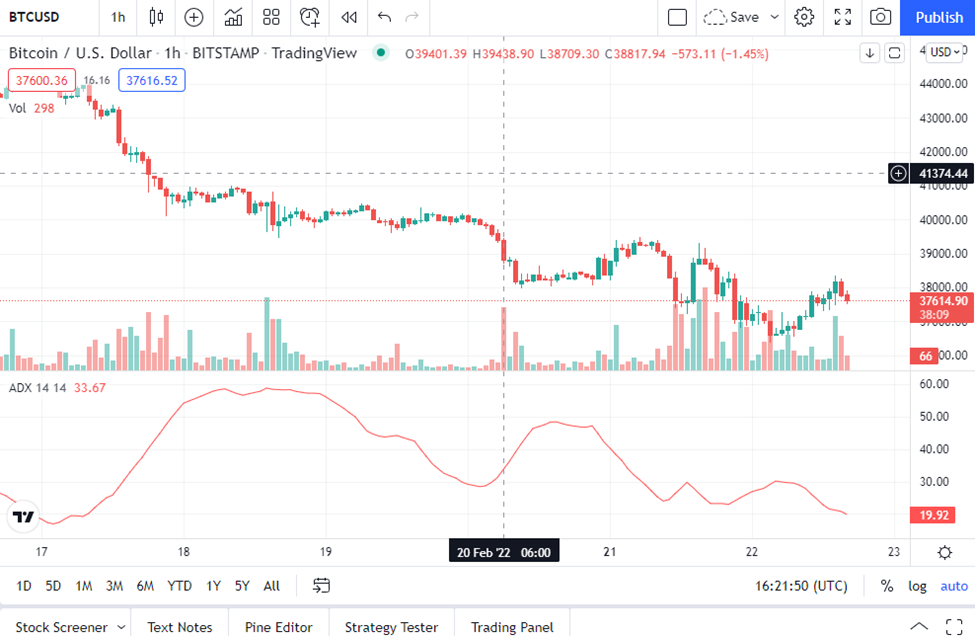
ADX
ADX or Average Directional Movement Index is also a fantastic indicator to measure the overall strength of a particular trend. It measures the average of the expanding range of price values.
The formula of this indicator is quite simple. You just have to take the mean of ADX values over a certain period. If an ADX is more than 25, it signifies a strong trend. Alternatively, if an ADX is below 20, there is no trend present.
In some cases, you may also notice the ADX declining. This means that an inevitable trend might be getting weak. However, if ADX is rising, it indicates that the trend is strengthening.
ADX
👍 Pros
• Readily available on all famous trading platforms
• Can be used with other indicators as well
• Easy to use
👎 Cons
• May show wrong signals when used alone
• Not suitable to be used in all market conditions
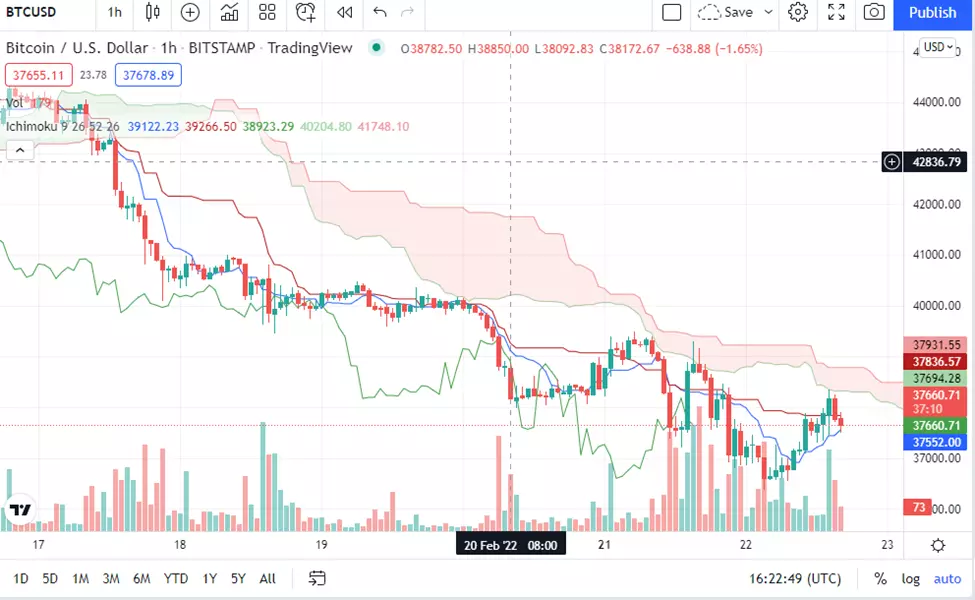
Ichimoku Cloud
This indicator is a collection of different indicators that display resistance levels and support. Additionally, this indicator also shows trend direction and momentum.
How does this indicator achieve that? First, it measures multiple averages and plots them all on a chart. Moreover, the indicator uses these values to create a cloud that forecasts the time in which a price may find resistance and support.
The Ichimoku Cloud indicator has five lines, and each has its own formula.
Conversion line=9-PH+9-PL/2
Base line = 26-PH+26-PL/2
Leading Span A=CL+ Base Line/2
Leading Span B= 52-PH+52-PL/2
Lagging Span= Close plotted 26 periods
In this formula, the:
PH stands for period high
PL stands for period low
CL stands for conversion line
Ichimoku Cloud
👍 Pros
• Measures support and resistance level
• Strong indicator
• Used for various market trends
👎 Cons
• Complicated formula
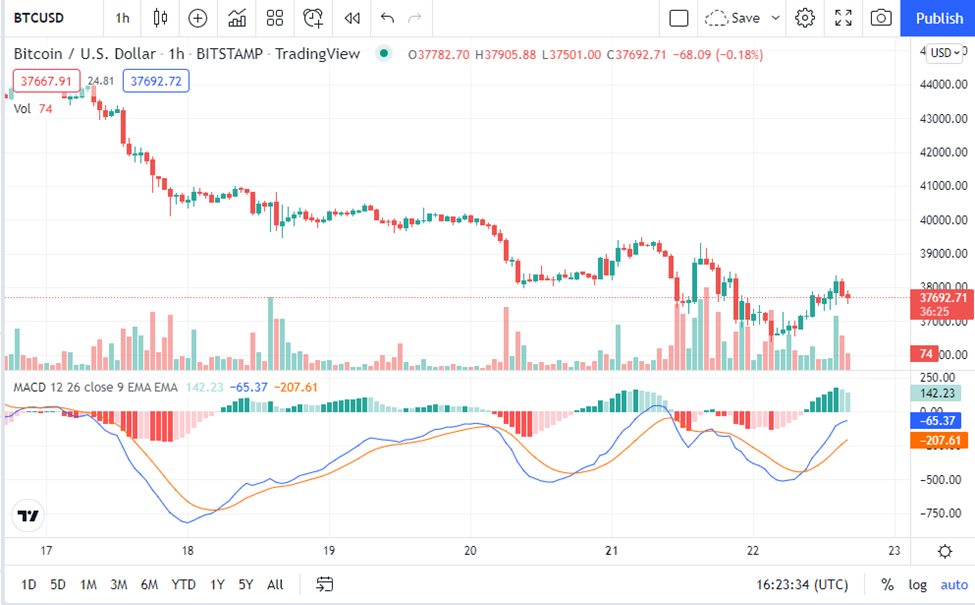
MACD
MACD or Moving Average Convergence or Divergence is a straightforward indicator to use. Moreover, it is also quite effective when it comes to providing strong trading signals for crypto. It is a trend-following indicator that measures whether the direction of the short and long-term momentum is the same or not.
This indicator has four components:
MACD line
Signal line
Histogram
Zero line
Below is the formula for this indicator:
26 period EMA (Exponential Moving Average) – 12 period EMA (at closing prices)
A positive MACD means an upside momentum. Alternatively, a negative MACD indicates a downwards momentum.
MACD
Here are some positive and negative points of using this technical indicator.
👍 Pros
• Easy to use
• Measure trend conveniently
• Can be used with other indicators conveniently
👎 Cons
• May generate false reversals.
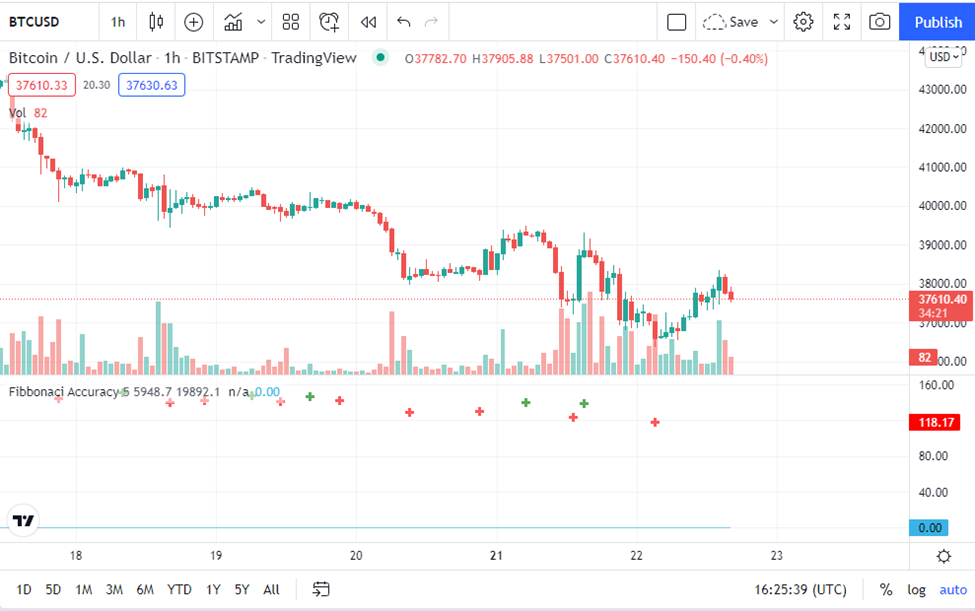
Fibonacci Retracement
What does this indicator do? Fibonacci Retracement predicts the resistance and support levels for the action price of an asset. This indicator is a little complicated to use, but it can help you understand the price actions if applied correctly.
The formula for this indicator is as follow:
UR= High price- {[High Price-Low Price]*percentage}
This formula is for the upward market trend. For the downward market trend, you can replace the initial high price with a low price.
Fibonacci Retracement
👍 Pros
• Offers accuracy
• Easy formula
• Available for both upwards and downward market trends
👎 Cons
• May produce false results when used incorrectly.
Bollinger Bands
This indicator determines an asset's price movement within a certain band. The indicator allows the lower and upper bands to move in line with fluctuations in price.
So, for instance, if the asset's price moves beyond the lower and upper band, this means a price reversal may happen. Here are the formulas used for all bands.
Middle Band: SMA or simple moving average of 20 days
Upper Band: SMA over 20 days+(Price deviation over 20 days *2)
Lower Band: SMA over 20 days-(Price deviation over 20 days*2)
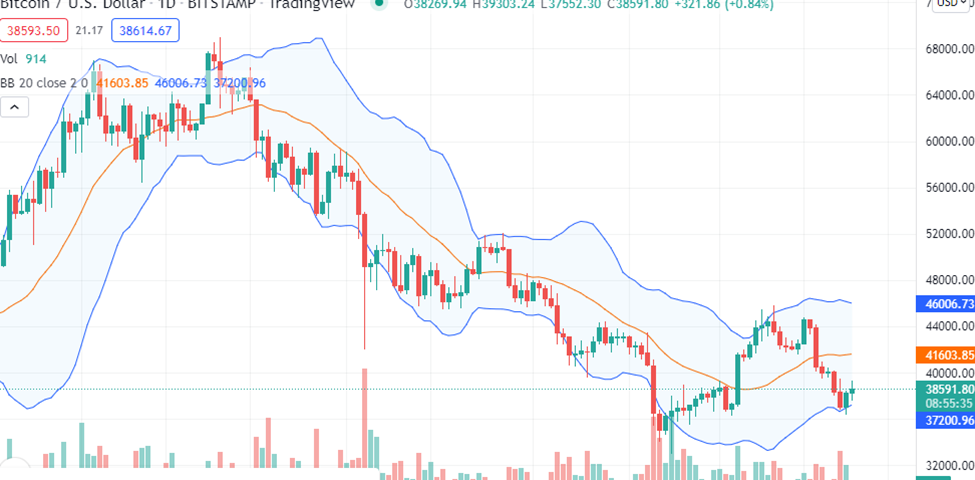
Bollinger Bands
Here are the pros and cons of this indicator.
👍 Pros
• Easy to use
• Helps to identify new trends in the market
• User-friendly indicator
👎 Cons
• Do not predict price patterns
• Shouldn't be relied on when using this indicator alone
MYC Trading Indicator
Our final popular indicator is the MYC trading indicator. This unique private predictor utilizes a powerful combination of momentum oscillators and pattern analysis to evaluate when a cryptocurrency reaches a bearish or bullish period.
You can access this indicator by contacting the official website contact@mycryptopedia.com.
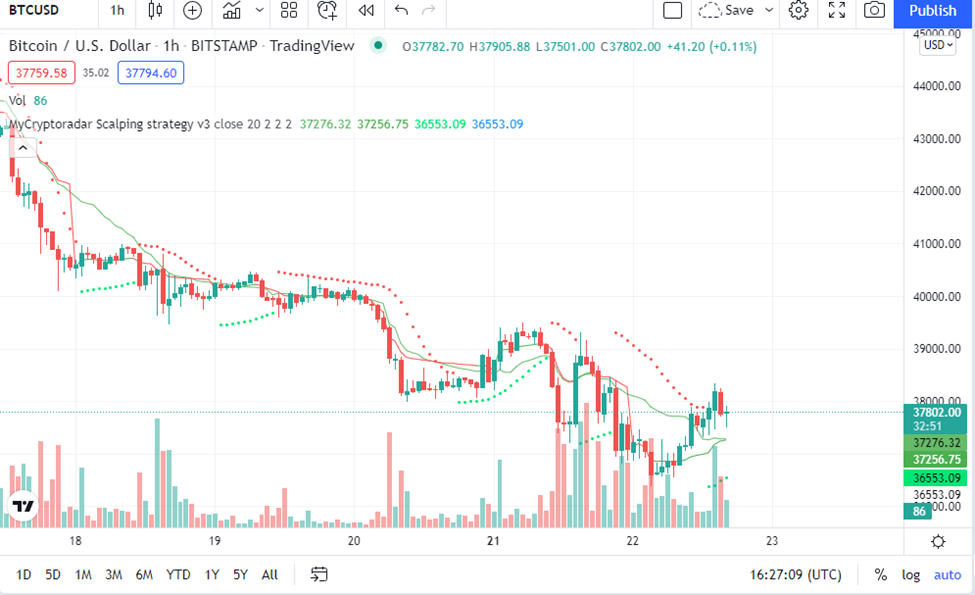
MYC Trading Indicator
👍 Pros
• Accurate indicator
• Easy to use
👎 Cons
• Private so access can be difficult
How to Trade With Best Crypto Indicators
Relative Strength Indicator (RSI)
This section details ways to trade with three different best crypto indicators.
RSI is best for day trading, and here are some of the steps you can take to use this indicator in your strategy.
-
Plot a simple moving average (SMA ) 200-period. This action will help determine the price trend.
-
Once done, add the indicator and then change the plotted setting to 2 periods.
-
Finally, adjust the values of oversold and overbought to 10 and 90, respectively.
You will get an RSI Buy Signal when the price exceeds 200 SMA and the RSI(2) is below 10. Alternatively, you will get an RSI Sell Signal when the price is below 200 SMA and the RSI is above 90.
On Balance Volume (OBV)
Trading with OBV is relatively easy. As mentioned above, the indicator is used as a momentum indicator that utilizes the flow of the volume to predict any changes in crypto prices.
This indicator provides a cumulative value of the volume. However, it uses three rules after being implemented:
-
If today's closing price is higher than the closing price of yesterday, the current OBV is the sum of the previous OBV and today's volume.
-
However, if today's closing price is below yesterday's, the current OBV is the difference between the previous OBV and today's volume.
-
Finally, the closing prices of both today and yesterday are equal; the value of the current OBV is similar to the previous OBV.
Moving Average Convergence Divergence (MACD)
As discussed earlier, this indicator has four different components. The formula for each line is different.
For instance, to attain the MACD line, subtract 26-EMA from 12-EMA. The signal line is the 9-period EMA, and the zero line is equal to the level where the MACD line is zero. Finally, the histogram indicates the distance between the signal line and the MACD line.
Unfortunately, this indicator doesn't have a specific range, and that is why you can't use it to assess overbought or oversold conditions. Below is how you can use this indicator to predict results:
-
If the signal line and the MACD line rise together, this is a bullish sign representing a positive momentum.
-
However, if the MACD line falls, this is considered a bearish sign and represents a negative momentum.
MACD is often considered a helpful indicator for beginners and trade professionals alike.
How to Build a Crypto Trading Strategy
If you want to excel in crypto trading, you need to have a strategy in mind. But do you know how to build one? Here are the steps you can take to create a strong crypto trading strategy.
There are different trading strategies, including day trending, scalping, trend trading, position trading, and swing trading. However, each of them follows some basic rules.
Every trader chooses a trading interval based on their strategy. For instance, day traders use low-interval charts, so they can predict price movement within a certain period.
Once done, traders add indicators and oscillators to forecast the market trends and price movements.
It is important to mention here that using one indicator isn't adequate enough for your trading strategy. Traders use multiple indicators at one time to attain accuracy in their forecasts.
Graphical analysis is a part of every trading strategy that helps traders evaluate whether the price trend shows a bearish divergence or bullish divergence. This process is crucial when building a crypto strategy.
Finally, the strategy also includes adding fundamental analysis to the picture. It measures the cryptocurrency's intrinsic value by considering all related financial and economic factors.
The Best Strategy With Crypto Indicators
Here is the best strategy with crypto indicators used for Bitcoin.
With Bitcoin, RSI and MACD are the best and simplest technical indicators to use.
When RSI is below 30, it indicates that it is oversold and it is the right time to buy Bitcoin.
Alternatively, if the RSI is above 70, it means that it is the right time to sell it and close the deal.
If the RSI is low and the signal line crosses the MACD line, this is bullish divergence and a buy signal to the open deal.
However, if the RSI is high and the MACD line falls, it is time to sell Bitcoin and close the deal.
Again, it is imperative to note that every indicator works differently, and so the strategy for each also varies. Moreover, the best strategy also depends on the cryptocurrency that you might want to sell or buy.
Best Crypto Trading Platforms
Lucky for you, many trading platforms can help you trade your chosen cryptocurrency. Both exchanges and brokers are a great way to invest in crypto and benefit from its rising price.
However, before you choose a trading platform, make sure to consider a few factors such as commission fee, benefits, and trading conditions. All exchanges and brokers have different rules when it comes to crypto trading, and while many may suit you, some might not.
Below, we have looked at the two best trading platforms you might want to try. These platforms are easily accessible and among the most popular exchanges globally.
Coinbase

Coinbase is one of the US's largest cryptocurrency exchanges. While it has a higher fee than most of its competitors, it provides access to over 100 cryptocurrencies and requires a low minimum amount to fund its account.
Moreover, every cryptocurrency is insured, which is quite rare in such exchanges. Coinbase also offers a unique facility of Coinbase Earn through which you can earn specific cryptocurrencies after attending some video classes and surveys on cryptocurrency trading.
Coinbase is one of the best platforms for people who want to experience convenience during trading. Moreover, it offers an excellent service for people who wish to exchange one currency for another easily.
This platform charges a spread of around 0.5% for crypto purchases and sales. This rate may fluctuate according to the market trends.
In addition to this, Coinbase also charges a specific fee that is either greater than the variable fee or flat fee. The final fee depends on the type of payment and the quantity of crypto purchased.
Summary
This article explored the best crypto indicators and how each plays a significant role in technical analysis. If you are new to crypto trading, knowing about these indicators is imperative to benefit from your trading strategy. Moreover, these indicators also help you open or close a deal with efficiency.
We hope this guide has served you well, and you can't wait to dig into the world of cryptocurrency and enjoy some earnings. Best of luck!
FAQs
Here are some common questions that might help you understand this topic much better.
Is there an accurate indicator for crypto?
Yes, many analysts consider Moving Average Convergence Divergence (MACD), Relative Strength Index (RSI), and On Balance Volume (OBV) among the accurate indicators.
Which indicators are suitable for beginners?
Beginners often consider Simple Moving Averages (SMA), Bollinger bands, and Stochastics as their popular technical indicators.
Are indicators helpful for professional traders as well?
Yes, professional traders do use indicators on some occasions. However, traders that don't like to rely on technical patterns keep the usage as low as possible.
Which indicator is best for day trading?
According to experts, the Stochastic Oscillator is the best day trading indicator. It follows the price's speed and compares the stock's closing price with different ranges of prices selected over a period.
Glossary for novice traders
-
1
Volatility
Volatility refers to the degree of variation or fluctuation in the price or value of a financial asset, such as stocks, bonds, or cryptocurrencies, over a period of time. Higher volatility indicates that an asset's price is experiencing more significant and rapid price swings, while lower volatility suggests relatively stable and gradual price movements.
-
2
Investor
An investor is an individual, who invests money in an asset with the expectation that its value would appreciate in the future. The asset can be anything, including a bond, debenture, mutual fund, equity, gold, silver, exchange-traded funds (ETFs), and real-estate property.
-
3
Bollinger Bands
Bollinger Bands (BBands) are a technical analysis tool that consists of three lines: a middle moving average and two outer bands that are typically set at a standard deviation away from the moving average. These bands help traders visualize potential price volatility and identify overbought or oversold conditions in the market.
-
4
Deviation
The deviation is a statistical measure of how much a set of data varies from the mean or average value. In forex trading, this measure is often calculated using standard deviation that helps traders in assessing the degree of variability or volatility in currency price movements.
-
5
Forex indicators
Forex indicators are tools used by traders to analyze market data, often based on technical and/or fundamental factors, to make informed trading decisions.


Team that worked on the article

Chinmay Soni is a financial analyst with more than 5 years of experience in working with stocks, Forex, derivatives, and other assets. As a founder of a boutique research firm and an active researcher, he covers various industries and fields, providing insights backed by statistical data. He is also an educator in the field of finance and technology.
As an author for Traders Union, he contributes his deep analytical insights on various topics, taking into account various aspects.

Dr. BJ Johnson is a PhD in English Language and an editor with over 15 years of experience. He earned his degree in English Language in the U.S and the UK. In 2020, Dr. Johnson joined the Traders Union team. Since then, he has created over 100 exclusive articles and edited over 300 articles of other authors.

Mirjan Hipolito is a journalist and news editor at Traders Union. She is an expert crypto writer with five years of experience in the financial markets. Her specialties are daily market news, price predictions, and Initial Coin Offerings (ICO).
