How To Use The RSI Indicator In Crypto Trading?
To use the RSI indicator for crypto trading, apply it to your chart to identify trend direction and potential overbought and oversold market conditions. Для этого Open a Price Chart, Click the Indicator Icon, Search for RSI Indicator и потом Add the RSI Indicator.
The Relative Strength Index (RSI), a momentum oscillator developed by J. Welles Wilder Jr., is one of the most widely used technical indicators in the financial markets, including cryptocurrency trading. In this article, we explore the versatility of the RSI indicator and its significance within the cryptocurrency industry. We also shed light on the practical applications of the RSI in crypto trading, exploring various strategies to maximize its effectiveness. By providing insight into RSI utilization and strategy, we aim to equip crypto traders with knowledge and skills to harness the RSI indicator effectively for optimal trading outcomes.
-
Is RSI good for crypto?
Yes. The RSI indicator is suitable for crypto trading; it provides traders with potential overbought and oversold zones for reversal trade entries or exits.
-
Is RSI enough for crypto trading?
The RSI indicator is one of the most widely used trend analysis indicators for crypto trading worldwide. However, relying on the RSI as a stand-alone indicator for making trading decisions may not yield optimal results in the long run.
-
When should I use RSI?
The RSI indicator can be used in different market conditions to identify trend direction and the potential overbought/oversold price levels.
-
Which RSI is best for crypto?
The optimal RSI value for overbought and oversold zones for cryptocurrency trading is 80 and 20, respectively. Nevertheless, traders may adjust these values to suit their trading styles and preferences.
Understanding RSI in crypto trading
The Relative Strength Index (RSI) is a momentum-based indicator that osculates between 0 and 100 levels, depicting the recent price changes, market trends, and the overbought and oversold levels. It is used in crypto to identify overbought and oversold zones, price divergence, and trend confirmation. Now, let’s delve into each of the uses of the RSI indicator in crypto trading:
-
Identification of Overbought and Oversold Zones: The RSI indicator is used to identify extreme zones known as overbought and oversold levels where a crypto asset may likely reverse. The default overbought zone on the RSI is 70, while the oversold zone is 30. However, it is worth noting that in cryptocurrency trading, 80 for overbought and 20 for oversold zones are commonly used to identify extreme zones of the price. The overbought and oversold zones imply that a crypto asset has reached a potential exhaustion limit, suggesting an imminent trend reversal. Hence, crypto traders may anticipate a potential trend reversal for a buy, sell, or exit a position if the price of a cryptocurrency reacts to the overbought or oversold zone.
-
Divergence Identification: The RSI indicator is one of the notable technical indicators used in identifying price divergences. For context, price divergence in financial markets is when the price of a cryptocurrency and the RSI indicator moves in opposite directions, which suggests a potential trend reversal. So, a bullish divergence occurs when the price of crypto is falling while the RSI is rising, which suggests that the selling pressure is diminishing and may lead to a move to the upside (bullish). Conversely, a bearish divergence occurs when the price of crypto is increasing while the value of the RSI is decreasing, which depicts a weakening buying pressure and a potential move to the downside (bearish).
-
Trend Confirmation: Lastly, the RSI indicator may be used in synergy with price action or other technical indicators to validate the trend direction of a crypto asset. For instance, a crypto asset is bullish if price action displays higher highs and lows while the RSI indicator is above level 50.
Best crypto exchanges


How to Apply the RSI Indicator in Crypto Trading
Here’s a general step-by-step guide on how to apply the RSI indicator to the chart, using TradingView as an example:
-
Open a Price Chart: Log in to your TradingView account account and choose a cryptocurrency pair, e.g., BTC/USDT.
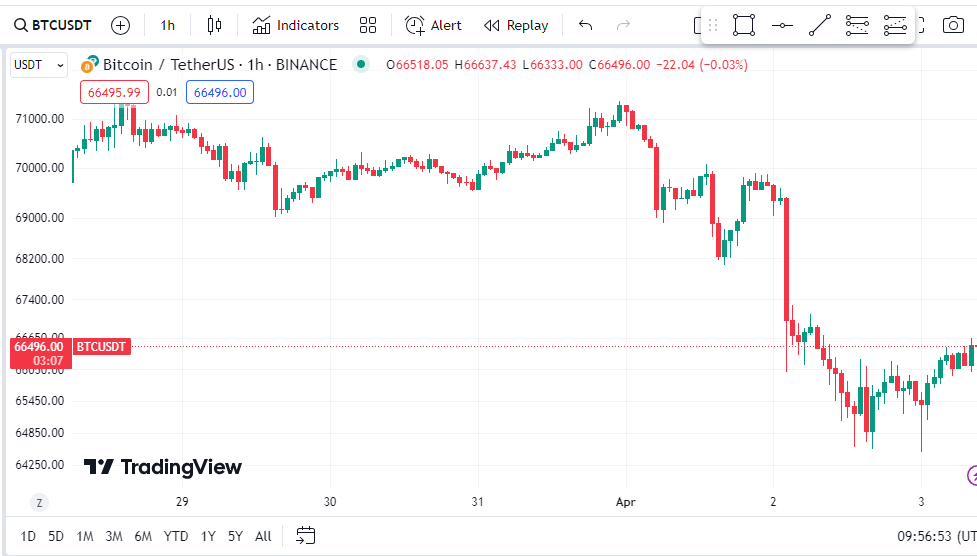
Applying the RSI indicator to the chart
Applying the RSI indicator to the chart
-
Click the Indicator Icon: Locate the indicator icon on the chart and click on it to display a list of available technical indicators, such as 24-hour Volume, Accumulation/Distribution, Advance decline line, etc.
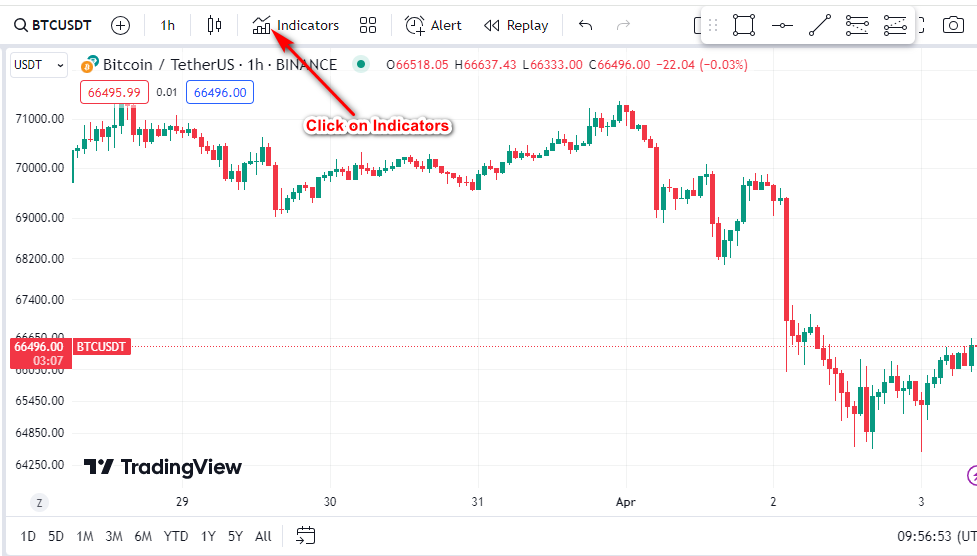
Applying the RSI indicator to the chart
-
Search for RSI Indicator: Type the indicator’s name, in this case RSI, into the search bar. The Relative Strength Index will be displayed among other indicators in the search result.
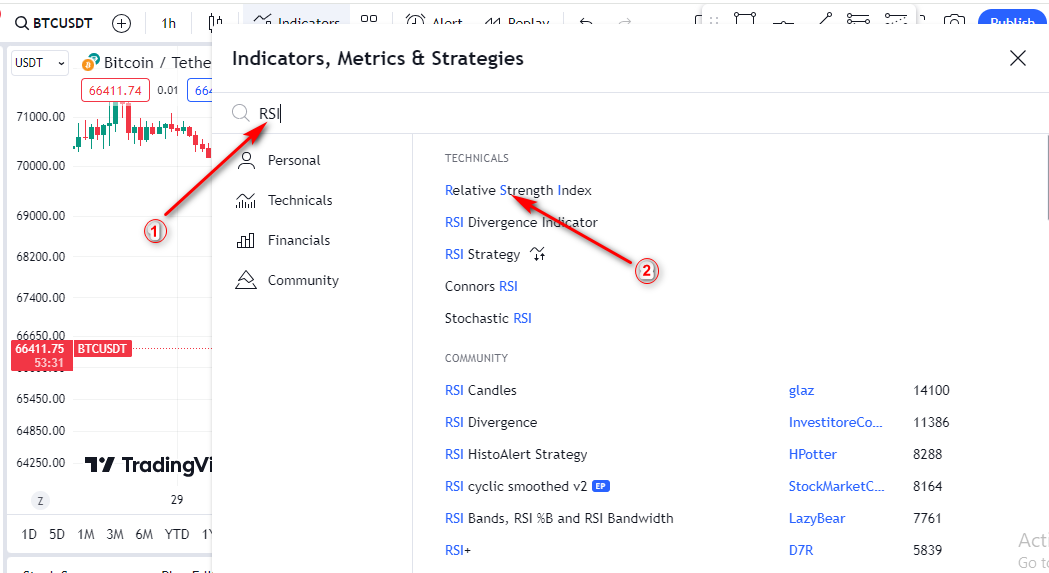
Applying the RSI indicator to the chart
-
Add the RSI Indicator: Click the Relative Strength Index to add it to your chart.
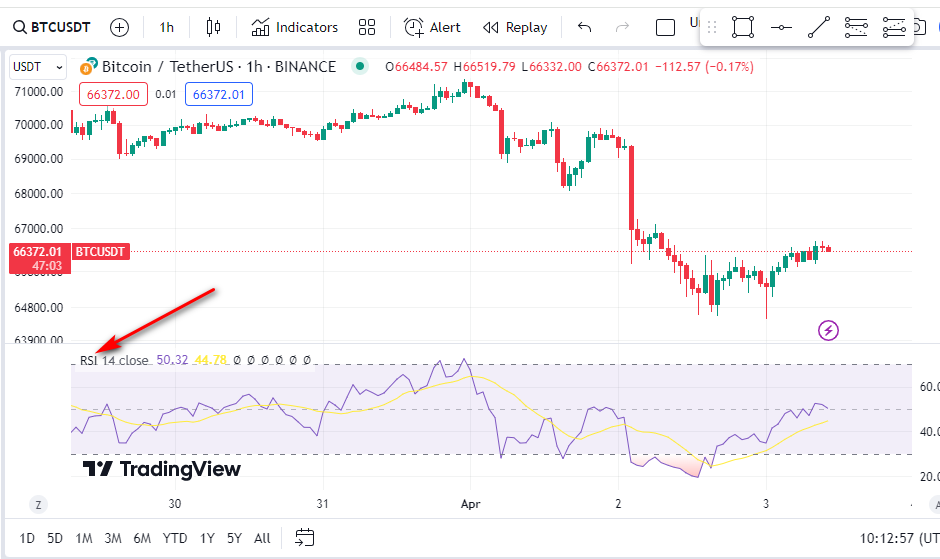
Applying the RSI indicator to the chart
RSI setting parameters
RSI oscillator shows the ratio (in %) of "bullish" and "bearish" bars for a certain period, which helps the trader to correctly assess the state of the market. There are only two calculation parameters: period (number of bars) and price type.
In addition to the balance line at the level of 50, the following variants of critical zones are used:
-
(80/20) - recommended on a strong trend;
-
(70/30) - during flat periods;
-
(60/40) - on weakly volatile assets.
You can use any type of price, for example, SMA or SMMA, but in today's volatile market the exponential smoothing (EMA) is considered optimal.
The author of the indicator used a period of two weeks for calculation, hence the default value of the parameter (14); that is, daily RSI will use data for 9 or 14 days, weekly - 9 or 14 weeks, and minute - 9 or 14 minutes. Now most often used RSI(9) and RSI(25), but it is recommended to select the parameter depending on the working timeframe.
The smaller the calculation period, the more active the indicator will react to price dynamics. RSI (9) or RSI(14) is recommended for intraday trading, and for work on the H1 period - RSI(5) or RSI(7). You should use the 5% rule: the RSI line should be inside the channel for at least 5% of the total trading time. As soon as the main price max/min becomes displayed by the indicator in the critical zones - the optimal RSI period has been found.
RSI trading strategies for crypto
The Relative Strength Index (RSI) is a versatile indicator in the cryptocurrency markets used for various trading strategies. Let’s explore some common RSI trading strategies for crypto:
-
RSI with Moving Average Strategy: This is one of the most common strategies of the RSI indicator for identifying trading opportunities in the crypto market. Crypto traders often combine the RSI with the moving average to identify a potential buy or sell entry. Traders may consider buying a crypto asset when the RSI crosses above the moving average indicator. Conversely, a sell signal occurs when the RSI crosses below the moving average.
-
RSI Overbought/Oversold Strategy: The RSI is also widely used among crypto traders to identify trend reversal trading opportunities at an overbought level of 70 and an oversold level of 30.
Buy Signal: Traders may consider buying a crypto asset when the RSI shows reversal signs at the oversold level of 30.
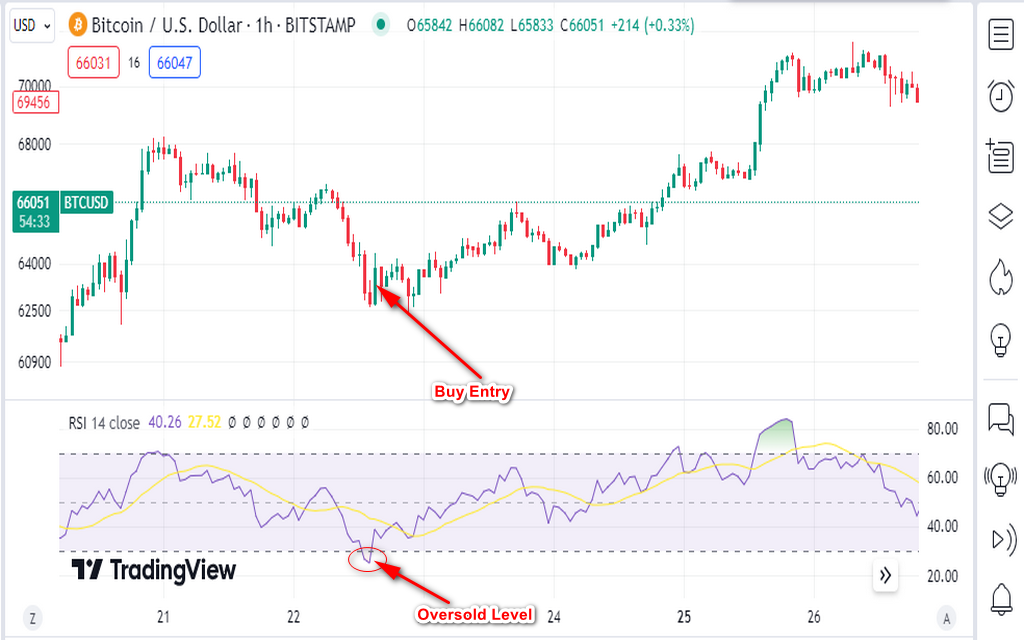
RSI Overbought/Oversold Strategy
Sell Signal: Traders may consider selling a crypto asset when the price reverses at an overbought RSI level of 70, which indicates that the asset has reached a potential exhaustion zone and may reverse.
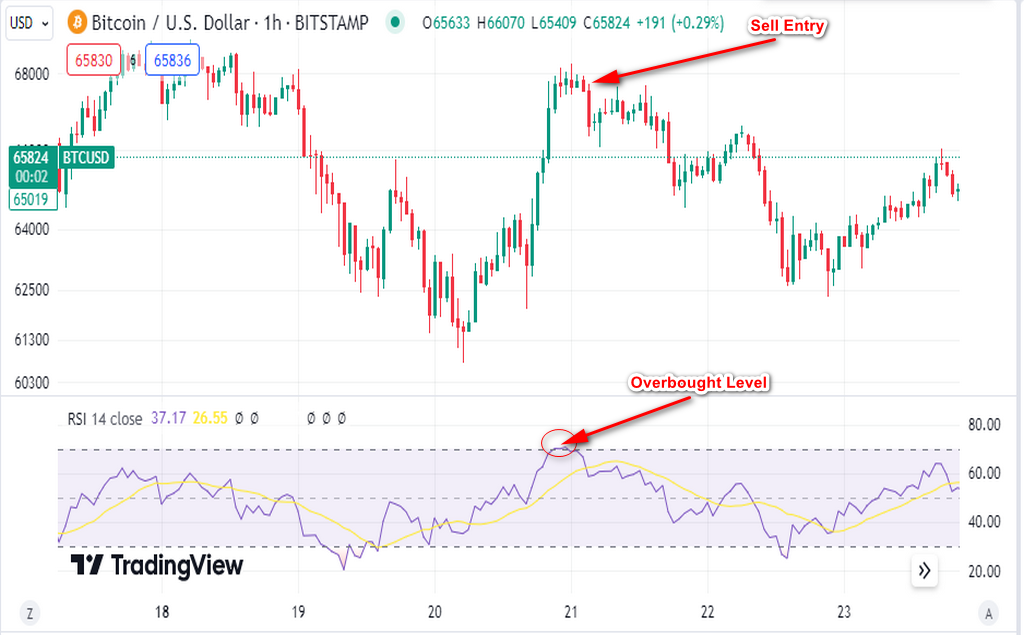
RSI Overbought/Oversold Strategy
-
RSI Divergence Strategy: The last RSI strategy on our list is the Divergence strategy. It is a trading technique where potential trend reversal trading opportunities are identified when the RSI moves in the opposite direction to the price of a crypto asset. Therefore, traders may seek a buy/sell entry position in the direction of the RSI. In a bearish divergence, for instance, where the price of crypto is rising while the RSI is falling (indicating a likely forthcoming bearish movement), traders may look for a sell-entry position in the direction of the RSI.
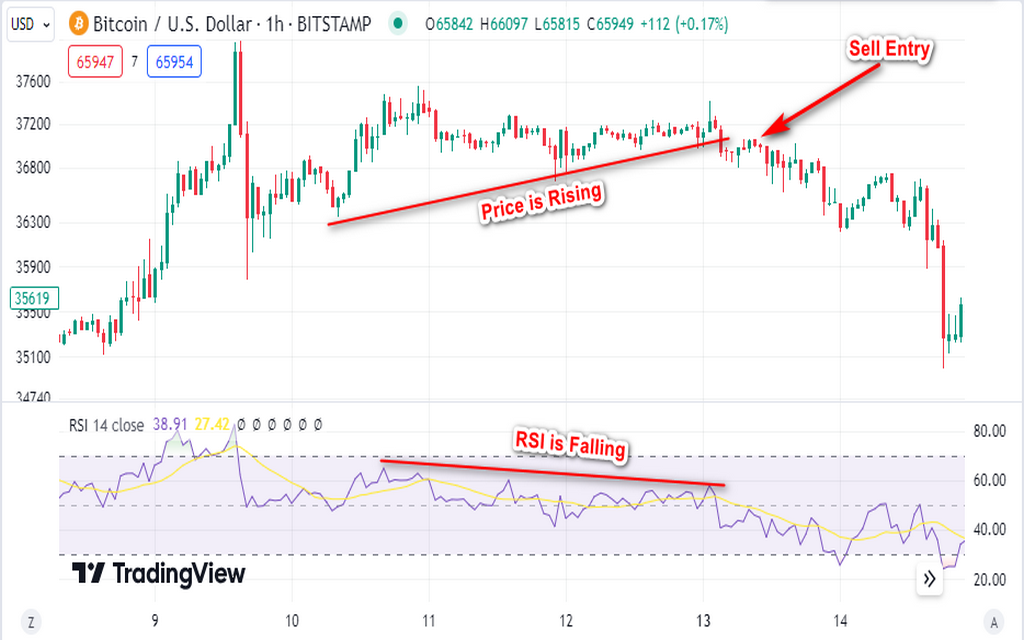
RSI Overbought/Oversold Strategy
Limitations of RSI in crypto trading
As earlier mentioned, the Relative Strength Indicator (RSI) is a widely used technical indicator in the cryptocurrency industry for making informed trading decisions. However, the RSI indicator has some limitations, just like other technical trading tools. Here are some of the notable limitations of trading crypto with the RSI indicator:
-
Lagging: Firstly, the RSI indicator tends to lag behind the price, especially for financial assets with high volatility, such as cryptocurrencies. The lagging of the RSI can lead to a delayed response to the price change, potentially causing missed signals or late entries.
-
Whipsaw: Whipsaw in the financial trading context refers to a situation where traders enter or exit a position prematurely due to false signals. The RSI indicator can lead to whipsaw trades because it tends to produce false signals when there is high volatility in the market.
-
Overbought/Oversold Conditions: The indicator is often used to detect overbought and oversold zones of the price. However, the levels are sometimes not reliable, especially in a strong market trend where the price may continue to extend beyond the overbought and oversold levels, leading to losses.
Is RSI good for crypto?
The RSI can be an invaluable technical indicator for analyzing the cryptocurrency markets, which helps traders in making objective decisions. The RSI indicator is beginner-friendly and suitable for experienced crypto traders, assisting them in identifying market trend direction and potential trend reversal trading opportunities. However, crypto traders should note that the RSI isn’t suitable to be used as a stand-alone indicator for making trading decisions. The indicator can be used along with chart patterns or other technical indicators, such as moving averages, trendlines, etc., to mitigate false signals and enhance better trading decisions.
Expert Opinion
The RSI is a momentum oscillator that identifies periods when security is considered to be either overbought or oversold. Essentially, it measures the rate of speed of price, either up or down, and oscillates between 0 and 100. Included are a marked-up level of 70 and a lower level of 30. Above 70 is considered overbought and below 30 is oversold. The RSI indicator is standard on all charting platforms, usually with a default of 14 periods. However, traders can adjust that measure if they like.

Conclusion
In conclusion, the Relative Strength Index (RSI) is a noteworthy technical trading indicator that aids decision-making within the crypto industry. Its versatility in identifying the trend direction of the market, overbought and oversold zones, and price divergences make it an incredible indicator for cryptocurrency trading. However, it is essential to acknowledge the limitations of the indicator, such as the tendency to lag behind the price and the potential for false signals in volatile market conditions. Therefore, crypto traders can use the RSI in synergy with other technical indicators or chart patterns to make better trading decisions.
Glossary for novice traders
-
1
Volatility
Volatility refers to the degree of variation or fluctuation in the price or value of a financial asset, such as stocks, bonds, or cryptocurrencies, over a period of time. Higher volatility indicates that an asset's price is experiencing more significant and rapid price swings, while lower volatility suggests relatively stable and gradual price movements.
-
2
Cryptocurrency
Cryptocurrency is a type of digital or virtual currency that relies on cryptography for security. Unlike traditional currencies issued by governments (fiat currencies), cryptocurrencies operate on decentralized networks, typically based on blockchain technology.
-
3
Day trading
Day trading involves buying and selling financial assets within the same trading day, with the goal of profiting from short-term price fluctuations, and positions are typically not held overnight.
-
4
Forex market trend
In the Forex market, a “trend” is the label used to describe the general direction that the prices of currency pairs are moving in, over a specific period of time. Trends are basically the pattern that a currency pair appears to be following and can help traders determine when to enter and exit a trade.
-
5
Yield
Yield refers to the earnings or income derived from an investment. It mirrors the returns generated by owning assets such as stocks, bonds, or other financial instruments.
Related Articles


Team that worked on the article

Joshua Francis is a professional Forex trader with 4+ years of experience in the financial industry. He trades the XAU/USD and GBP/JPY pairs. He is also a ghostwriter and author for Indicatorspot and Traders Union, where he puts his intensive research skills and deep knowledge of the financial markets into freelance writing.

Dr. BJ Johnson is a PhD in English Language and an editor with over 15 years of experience. He earned his degree in English Language in the U.S and the UK. In 2020, Dr. Johnson joined the Traders Union team. Since then, he has created over 100 exclusive articles and edited over 300 articles of other authors.

Mirjan Hipolito is a journalist and news editor at Traders Union. She is an expert crypto writer with five years of experience in the financial markets. Her specialties are daily market news, price predictions, and Initial Coin Offerings (ICO).
