How To Identify Trends In Cryptocurrency Trading


Editorial Note: While we adhere to strict Editorial Integrity, this post may contain references to products from our partners. Here's an explanation for How We Make Money. None of the data and information on this webpage constitutes investment advice according to our Disclaimer.
How to identify cryptocurrency trends:
Crypto trend analysis is a fundamental aspect of trading that involves predicting the future direction of cryptocurrency prices by examining historical price movements and patterns. Understanding these trends helps traders make better trading decisions, whether the market is rising (uptrend), falling (downtrend), or moving sideways.
How to identify cryptocurrency trends
Analyze сhart patterns
Chart patterns are key tools for identifying trends and potential market movements in cryptocurrency trading. Triangles (ascending, descending, and symmetrical) and wedges (rising and falling) are common patterns that signal either a trend continuation or a potential reversal.
Triangles. An ascending triangle often signals a potential breakout to the upside, while a descending triangle could indicate a breakdown.
Wedges. A falling wedge is often seen as a bullish indicator, while a rising wedge suggests a possible bearish reversal.
Use technical indicators
Technical indicators provide valuable insights into market trends and momentum. Two of the most effective indicators for identifying trends in cryptocurrency are moving averages and the Relative Strength Index (RSI).
Moving averages (SMA/EMA). Moving averages smooth out price data over time to show the direction of the trend. A Simple Moving Average (SMA) calculates the average price over a set period, while the Exponential Moving Average (EMA) gives more weight to recent prices. Crossovers of short-term and long-term moving averages (e.g., the 50-day and 200-day moving averages) are often used to confirm trend changes.
RSI (Relative Strength Index). RSI measures the speed and change of price movements, helping traders determine whether an asset is overbought or oversold. An RSI above 70 indicates that the asset may be overbought and due for a correction, while an RSI below 30 suggests it may be oversold and poised for a potential rally.
Track macroeconomic data
Macroeconomic data plays a crucial role in shaping the overall market environment, and cryptocurrencies are no exception. Pay attention to factors like inflation, interest rates, and monetary policy, as these can have significant impacts on crypto trends.
Inflation. Rising inflation often pushes investors toward inflation-resistant assets like Bitcoin and other cryptocurrencies, as they may serve as a hedge against currency devaluation.
Interest rates. Changes in interest rates, especially from central banks like the Federal Reserve, can affect market liquidity and investor appetite for risk. Low interest rates tend to encourage more speculative investments, which can benefit the crypto market.
Monitor market news and sentiment
Cryptocurrency markets are highly sensitive to news events and market sentiment. Staying updated on current events, such as regulatory changes, partnership announcements, or technological advancements(e.g., network upgrades, forks), is crucial for identifying trends.
Regulatory announcements. Government regulations or bans on cryptocurrencies in certain countries can trigger market fluctuations, either positively or negatively.
Technological developments. Major upgrades to blockchain networks, such as Ethereum's move to Proof of Stake (PoS), can signal potential long-term bullish trends.
Social sentiment. Tools like Google Trends, Twitter sentiment analysis, and platforms like LunarCrush can help gauge overall market sentiment and the mood of the investor community. Bullish or bearish sentiment, driven by news and social media, often leads to price trends in the cryptocurrency space.
Key factors in crypto trend analysis
Identifying trends in cryptocurrency trading requires focusing on several key factors:
Technical indicators. Tools like Moving Averages (MA), Relative Strength Index (RSI), Moving Average Convergence Divergence (MACD), and Bollinger Bands help identify and confirm trends. For example, during the entire 2023, RSI above 70 indicated overbought conditions in 60% of analyzed cases, leading to potential trend reversals.
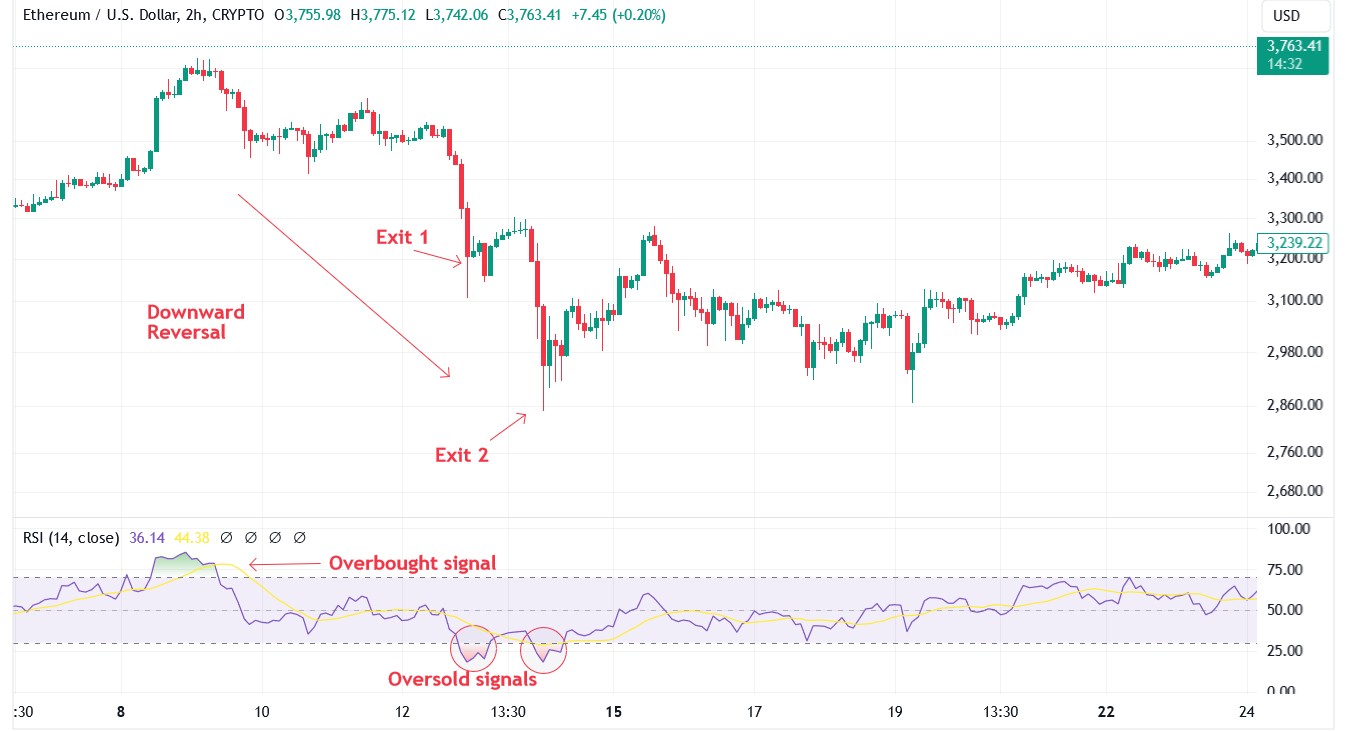
Chart patterns. Recognizable patterns such as triangles, flags, and head and shoulders signal potential trend continuations or reversals. For instance, a descending triangle breaking downward typically signals a continuation of a bearish trend.
Trading volume. High trading volume during price changes often confirms the strength of a trend. During 2023, a study found that significant price movements with corresponding high volume had an 80% likelihood of trend continuation.
Time frame analysis. Analyzing trends across different time frames — daily, weekly, and monthly — provides insights into both short-term and long-term market movements.
The role of trendlines
Trendlines are essential for visually identifying the direction and strength of a trend. Here’s how traders can effectively use trendlines:
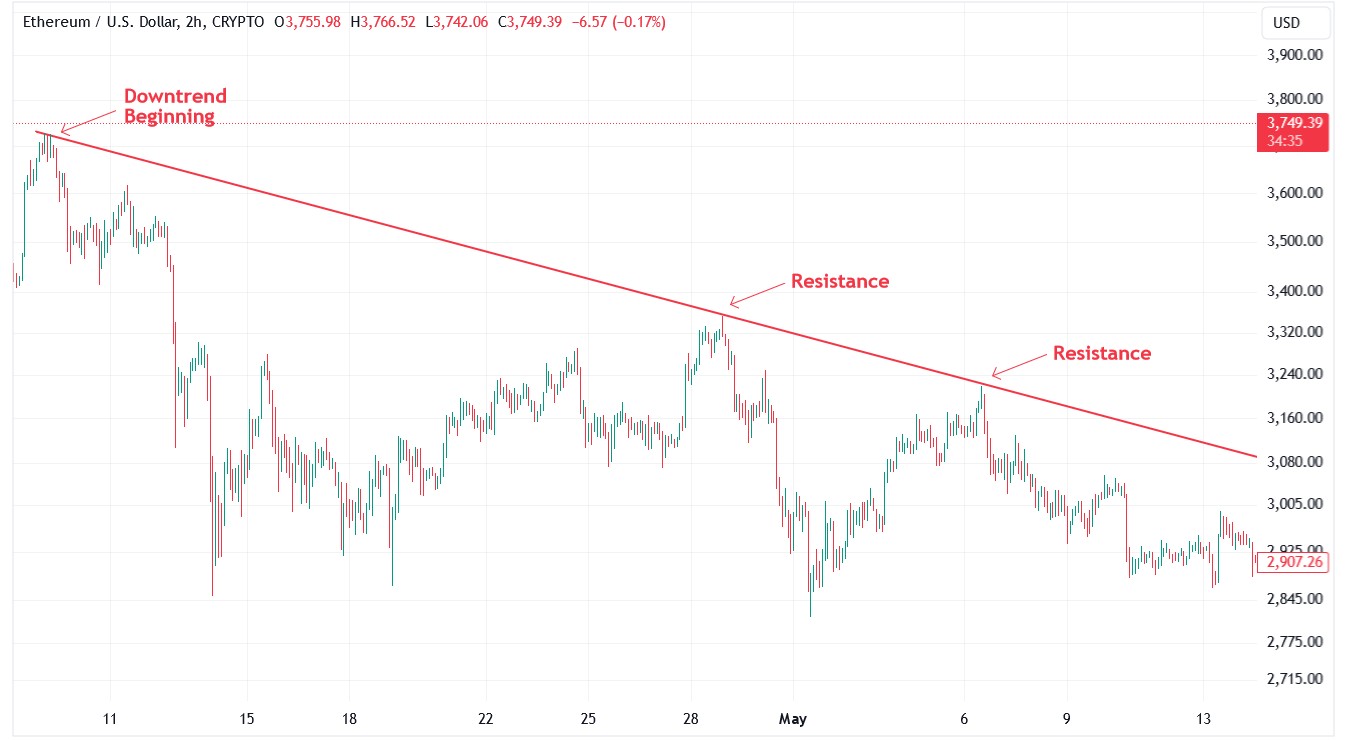
Drawing trendlines. Connect the lowest lows in an uptrend and the highest highs in a downtrend to create a trendline. These lines serve as guides, helping traders anticipate where the price might move next.
Support and resistance. In an uptrend, the trendline often acts as a support level, signaling potential buying opportunities. Conversely, in a downtrend, it acts as resistance, indicating potential sell points.
Breakouts. When the price breaks through a trendline, it often signals a shift in market sentiment. For instance, a breakout above a downtrend line could indicate the beginning of a new uptrend.
Technical analysis tools for trend identification
Technical analysis involves using specific tools to identify and analyze trends:
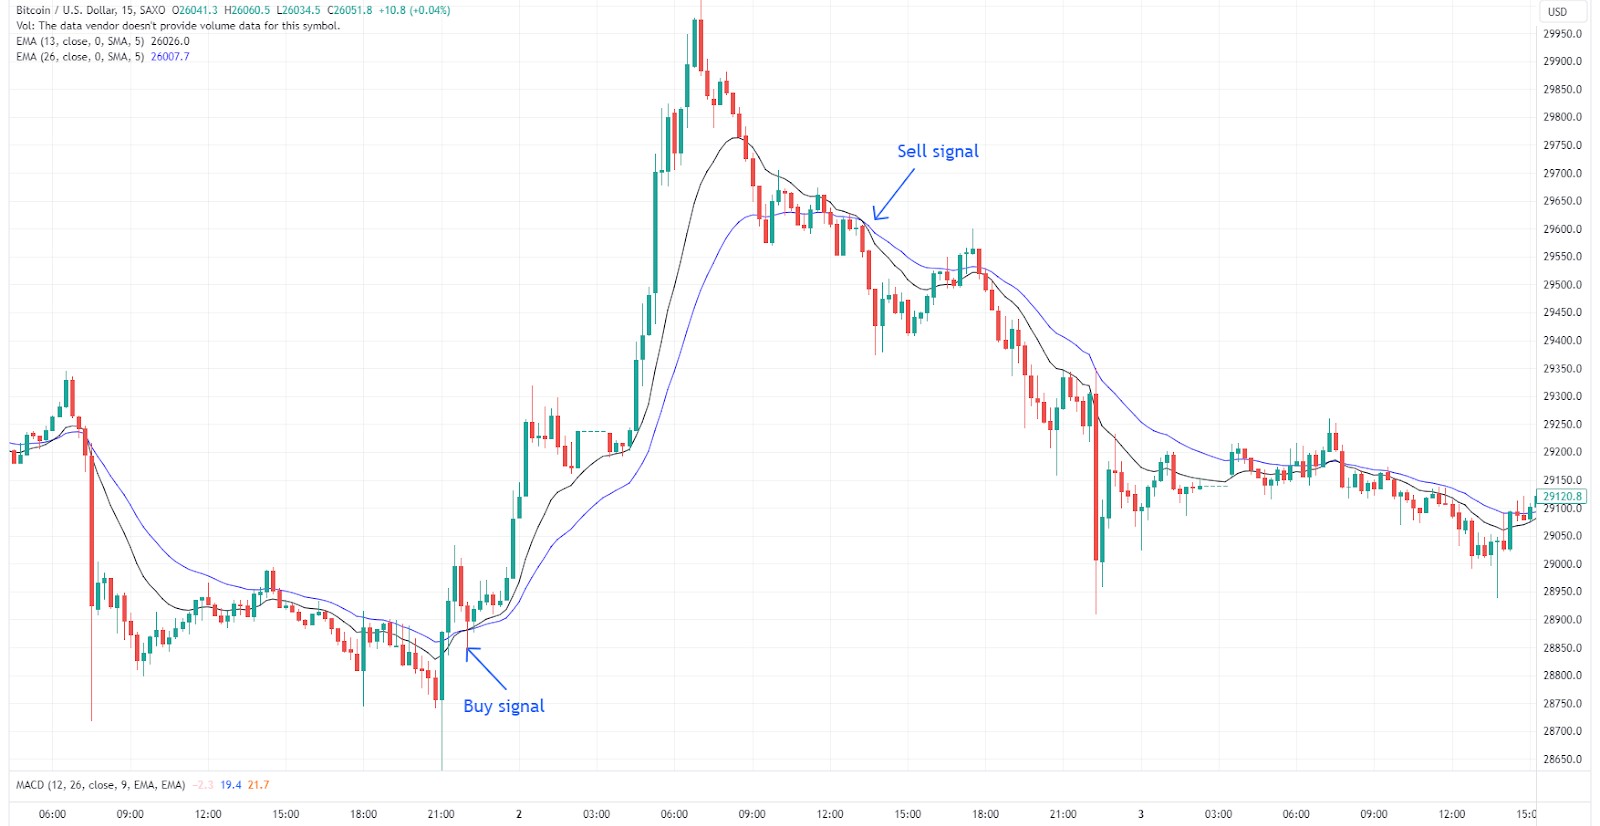
Moving averages (MA). Moving averages smooth out price data, making it easier to identify the overall direction of a trend. The Simple Moving Average (SMA) and Exponential Moving Average (EMA) are commonly used.
Relative strength index (RSI). RSI is a momentum indicator that measures the speed and change of price movements. It ranges from 0 to 100, with values above 70 indicating an overbought market and values below 30 suggesting oversold conditions.
Bollinger bands. These bands measure market volatility and help identify overbought or oversold conditions based on price proximity to the bands.
On-balance volume (OBV). OBV tracks the buying and selling activity of an asset over time, helping to confirm trends and validate breakouts.
Fundamental analysis for trend identification
Fundamental analysis complements technical analysis by focusing on external factors that influence cryptocurrency prices:
Macroeconomic data. Factors such as inflation rates, interest rates, and GDP growth can significantly impact the crypto market.
Market news. News events, such as regulatory changes or technological advancements, can cause sudden shifts in market trends.
Combining technical and fundamental analysis provides a comprehensive view, helping traders identify trends with greater accuracy.
Pros and cons of trend trading
Trend trading is a widely adopted strategy in the cryptocurrency market, providing both opportunities for profit and inherent risks. Here’s a breakdown of the key advantages and disadvantages:
- Pros
- Cons
Simplicity. Trend trading is relatively easy to understand and implement. Traders focus on buying during uptrends and selling during downtrends, following the market’s momentum without the need for complex strategies.
Profit potential. Riding a strong trend can lead to significant gains. For example, during a sustained uptrend, holding positions can result in substantial returns as the trend progresses.
Risk management. Trend trading allows for effective risk management. By following the trend’s direction, traders can set stop-loss orders to limit losses in case of unexpected market reversals.
Lagging entry and exit points. A common challenge in trend trading is recognizing trends after they have already started, which can result in missed opportunities. Traders may enter late and miss out on the initial gains, or exit too late and face losses.
Risk of false trends. Not all trends are long-lasting. Traders may mistake short-term market movements for long-term trends, leading to premature entries or exits that can result in losses.
Market volatility. The cryptocurrency market is highly volatile, and trends can reverse quickly. This volatility can lead to unexpected losses if traders are not vigilant.
Risks of trend trading and how to manage them
While trend trading offers significant opportunities, it also comes with risks. Here’s how traders can manage these risks effectively:
Common risks
False trends. Sometimes, what appears to be a new trend might just be a temporary market fluctuation. Traders who enter too early can find themselves on the wrong side of the market when the trend reverses.
Market volatility. The cryptocurrency market is known for its high volatility. Sudden price swings can disrupt trends, leading to unexpected losses.
Lagging indicators. Relying solely on lagging indicators like moving averages can result in late entries or exits, missing the optimal points to maximize profit or minimize loss.
Overtrading. The allure of catching every trend can lead to overtrading, which increases transaction costs and the risk of losses.
How to manage these risks
Set stop-loss orders. Protect against sudden market reversals by setting stop-loss orders. This risk management tool automatically sells your position if the market moves against you by a predetermined amount, limiting potential losses.
Diversify your strategy. Don’t rely on a single trend. Diversify your portfolio and trading strategies to spread risk across different assets and approaches.
Stay informed. Keep up with market news and events that could impact trends. Being aware of broader economic factors helps traders anticipate market movements and adjust their strategies accordingly.
Expert glance on mastering trend analysis in crypto trading

When you start exploring the crypto markets, always look at the "volume precedes price" rule. Put simply, before a crypto's price jumps up or down, the amount of trading often increases. This early sign can help you spot upcoming trends. To make this useful, set up your trading app to alert you when there's a big increase in trading volumes for less popular coins. These increases often show early interest from the community, sometimes before influencers and the broader market notice, giving you an early advantage.
Another smart move is to keep an eye on developer activity on sites like GitHub. Cryptos with busy and expanding development teams are often more reliable and ready for growth, suggesting that their prices might go up soon. Instead of just following the general mood of the market, check out the "commit logs" or "issue discussions" of a crypto project. These logs show you what new updates or improvements are coming — major changes can lead to price increases.
Summary
Understanding the trends in cryptocurrency trading is incredibly important if you want to make smart choices and boost your earnings. By using technical analysis tools such as trendlines, the Relative Strength Index (RSI), and Moving Averages, along with keeping an eye on fundamental factors like market news and economic indicators, you can get a clearer picture of where the market's headed. Remember, the keys to doing well in the hectic world of crypto are staying patient, sticking to your strategies, and never stopping learning.
FAQs
What is the most important tool for identifying crypto trends?
Moving Averages and RSI are among the most effective tools for identifying trends in the cryptocurrency market. They help smooth out price data and indicate overbought or oversold conditions.
How does trading volume affect trend analysis?
Trading volume confirms the strength of a trend. High volume during price changes usually indicates that the trend is strong and likely to continue.
Can fundamental analysis alone identify trends?
While fundamental analysis is important, it is most effective when combined with technical analysis. Together, they provide a comprehensive view of the market, helping traders make better decisions.
How often should traders review their trend analysis?
Traders should review their trend analysis regularly, especially during periods of high volatility. This allows them to adjust their strategies as market conditions change.
Editors' Top Picks and Insights

Bitcoin mining is getting greener, but the debate isn't over

Asia's largest IPO: How CXMT became China's most valuable company

Global fintech in 2026: Three trends that matter

From Jesus Christ to aliens: Polymarket's most absurd prediction markets

Hunting crypto owners: Why criminals have gone offline

BitMEX is shutting down: Why Trump could not save the exchange
Related Articles
Team that worked on the article
Parshwa is a content expert and finance professional possessing deep knowledge of stock and options trading, technical and fundamental analysis, and equity research. As a Chartered Accountant Finalist, Parshwa also has expertise in Forex, crypto trading, and personal taxation.
Chinmay Soni is a financial analyst with more than 5 years of experience in working with stocks, Forex, derivatives, and other assets. As a founder of a boutique research firm and an active researcher, he covers various industries and fields, providing insights backed by statistical data.
Mirjan Hipolito is a journalist and news editor at Traders Union. She is an expert crypto writer with five years of experience in the financial markets.
Risk management is a risk management model that involves controlling potential losses while maximizing profits. The main risk management tools are stop loss, take profit, calculation of position volume taking into account leverage and pip value.
Crypto trading involves the buying and selling of cryptocurrencies, such as Bitcoin, Ethereum, or other digital assets, with the aim of making a profit from price fluctuations.
Ethereum is a decentralized blockchain platform and cryptocurrency that was proposed by Vitalik Buterin in late 2013 and development began in early 2014. It was designed as a versatile platform for creating decentralized applications (DApps) and smart contracts.
Bollinger Bands (BBands) are a technical analysis tool that consists of three lines: a middle moving average and two outer bands that are typically set at a standard deviation away from the moving average. These bands help traders visualize potential price volatility and identify overbought or oversold conditions in the market.
Day trading involves buying and selling financial assets within the same trading day, with the goal of profiting from short-term price fluctuations, and positions are typically not held overnight.

-
 Afghanistan
-
 Albania
-
 Algeria
-
 Angola
-
 Argentina
-
 Armenia
-
 Australia
-
 Austria
-
 Azerbaijan
-
 Bahamas
-
 Bahrain
-
 Bangladesh
-
 Belarus
-
 Belgium
-
 Bolivia
-
 Botswana
-
 Brazil
-
 Brunei
-
 Bulgaria
-
 Cambodia
-
 Cameroon
-
 Canada
-
 Chile
Chile
-
 China
China
-
 Colombia
-
 Congo
Congo
-
 Costa Rica
-
 Cote d'Ivoire
-
 Croatia
-
 Cuba
Cuba
-
 Cyprus
-
 Czechia
-
 DR Congo
-
 Denmark
-
 Dominican Republic
-
 Ecuador
-
 Egypt
Egypt
-
 El Salvador
-
 Estonia
-
 Eswatini
-
 Ethiopia
-
 Finland
-
 France
-
 Georgia
-
 Germany
-
 Ghana
Ghana
-
 Greece
-
 Haiti
Haiti
-
 Hong Kong
-
 Hungary
-
 India
India
-
 Indonesia
-
 Iran, Islamic republic
-
 Iraq
Iraq
-
 Ireland
-
 Israel
-
 Italy
Italy
-
 Jamaica
-
 Japan
Japan
-
 Jordan
-
 Kazakhstan
-
 Kenya
Kenya
-
 Korea
Korea
-
 Kuwait
-
 Kyrgyzstan
-
 Laos
Laos
-
 Latvia
-
 Lebanon
-
 Lesotho
-
 Libya
Libya
-
 Lithuania
-
 Luxembourg
-
 Madagascar
-
 Malaysia
-
 Malta
Malta
-
 Mauritius
-
 Mexico
-
 Moldova
-
 Mongolia
-
 Montenegro
-
 Morocco
-
 Mozambique
-
 Myanmar
-
 Namibia
-
 Nepal
Nepal
-
 Netherlands
-
 New Zealand
-
 Nigeria
-
 North Macedonia
-
 Norway
-
 Oman
Oman
-
 Pakistan
-
 Palestine
-
 Panama
-
 Papua New Guinea
-
 Paraguay
-
 Peru
Peru
-
 Philippines
-
 Poland
-
 Portugal
-
 Puerto Rico
-
 Qatar
Qatar
-
 Reunion
-
 Romania
-
 Rwanda
-
 Saudi Arabia
-
 Serbia
-
 Singapore
-
 Slovakia
-
 Slovenia
-
 Somalia
-
 South Africa
-
 Spain
Spain
-
 Sri Lanka
-
 Sweden
-
 Switzerland
-
 Syria
Syria
-
 Taiwan
-
 Tajikistan
-
 Tanzania
-
 Thailand
-
 Trinidad and Tobago
-
 Tunisia
-
 Turkey
-
 UAE
UAE
-
 Uganda
-
 Ukraine
-
 United Kingdom
-
United States
-
 Uruguay
-
 Uzbekistan
-
 Venezuela
-
 Vietnam
-
 Yemen
Yemen
-
 Zambia
-
 Zimbabwe
- Forex
- Crypto
