Triangle Patterns in Trading | Beginner’s Guide
The ability to identify patterns to trade in financial markets efficiently is an integral part of technical analysis. In this article, Traders Union explores triangle patterns, their types, and how their identification can help traders to achieve better results.
What is a Triangle Pattern?
An instrument price “behavior” directly depends on the actions of market participants. When most traders buy, the price rises. When most sell, the price drops. And when the efforts of both sides are more or less the same, the price consolidates. In the course of its consolidation, a corresponding price pattern forms, and in this article we will take a closer look at one of the most frequently forming patterns called a “triangle”.
Having reached a strong bearish resistance within an uptrend, the price begins to swing between resistance and support, i.e., in the area where the instrument is still being actively bought. Over time, price swings start narrowing and converging toward the middle of the range (highs get lower and lows get higher), and then a triangle pattern forms, which can be clearly seen if you draw two lines: one along descending highs and the other along ascending lows. Within a downtrend, patterns form the same way.
The narrowing of price swings reflects volatility reduction, which usually precedes a price breakout in either direction, and the instrument continues to either rise or drop. Unfortunately, the triangle is not a definitive pattern of trend continuation or reversal, but if it forms within an active, strongly-pronounced trend, it’s highly probable that a breakout and exit from the range will take place in the direction of the trend.
Like many technical analysis patterns, the triangle is most reliable within a long-term trend, i.e., when price swings narrow for several months due to volatility reduction. Otherwise, when the process lasts from several days to several weeks, another pattern may form, which can also be a trend continuation or reversal pattern.
The diagram below shows triangles within an uptrend (bullish) and a downtrend (bearish). Both are trend continuation patterns:
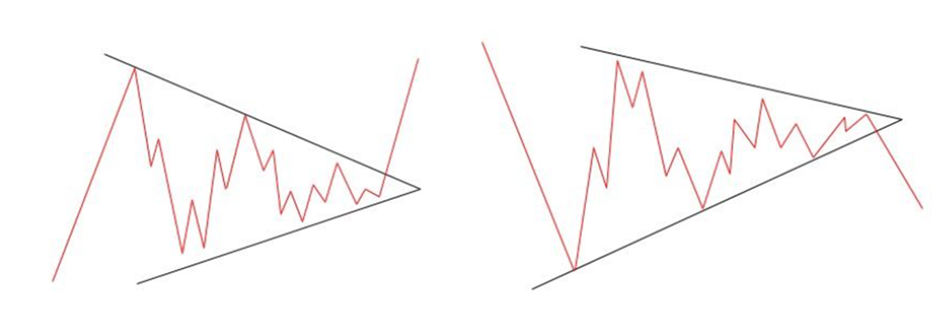
Triangles within an uptrend and a downtrend
A triangle pattern is considered to be formed if the price has touched support and resistance at least 5 times. For example, you see 2 touches of support and 3 touches of resistance or vice versa.
Notably, perfectly-shaped triangles, like the ones in the diagram above, do not occur very often. For this reason, novice traders are usually advised not to fixate on looking for beautiful, distinct pictures and counting how many times the price has touched a triangle’s sides, but to approach this matter more creatively, i.e., try to see what the market is saying.
Triangle pattern types
When there is a horizontal resistance line and an ascending support line, drawn along the rising lows, the triangle is called ascending.
And vice versa, a descending triangle is where a descending resistance line is drawn along the declining highs, and a horizontal support line.
If the price almost stops swinging, and the descending resistance line and the ascending support line converge in the middle of the consolidation range, a symmetrical triangle forms.
The Head and Shoulders Pattern: How to Spot and Apply ItAscending triangle pattern
The ascending triangle pattern reflects a situation when there is a steady demand for an instrument, which is pushing the price higher and higher, but the bulls still cannot “beat” the bears’ supply. Nevertheless, at some point, the bulls gain enough volume to absorb the supply. The price gets an additional momentum due to the triggering of stop loss orders and rises rapidly.
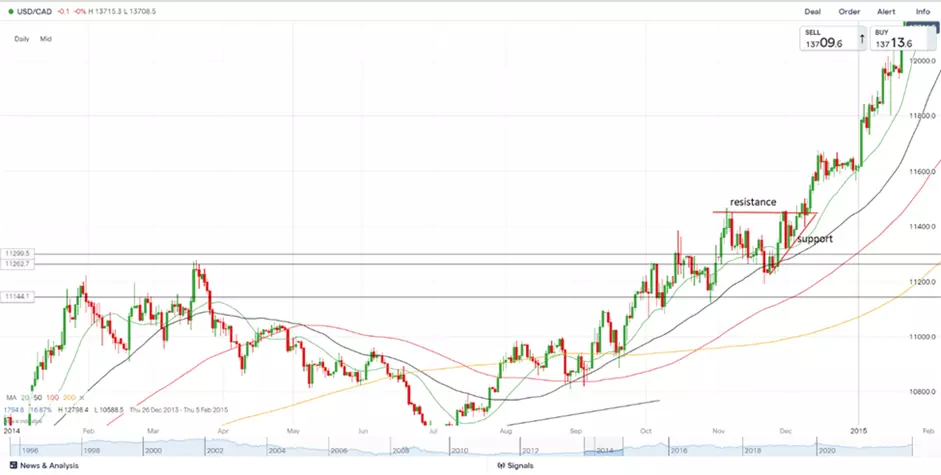
An ascending triangle pattern
The example above shows the formation of an ascending triangle in the USD/CAD pair, where the resistance line is horizontal and the support line, drawn along the rising lows, is ascending. In this example, the triangle forms within an uptrend, and a resistance breakout leads to a further rise in the price of the pair.
Descending triangle pattern
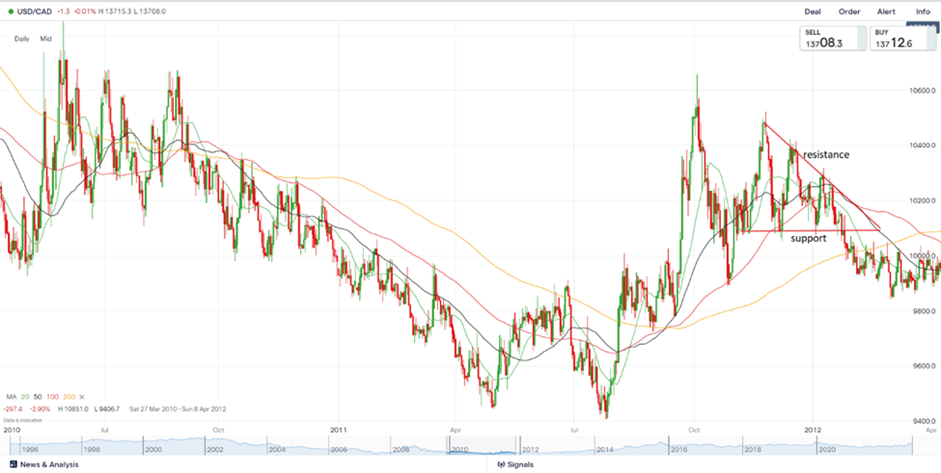
A descending triangle pattern
In this example, with the same USD/CAD pair, we see the formation of a descending triangle, this time during a correction within a downtrend, with a subsequent breakout below the horizontal support line. The descending resistance line is drawn along the falling highs. In this case, after the support breakout, the price does not get a significant momentum.
Symmetrical triangle pattern
Next example with the USD/JPY pair shows the formation of a symmetrical triangle pattern:
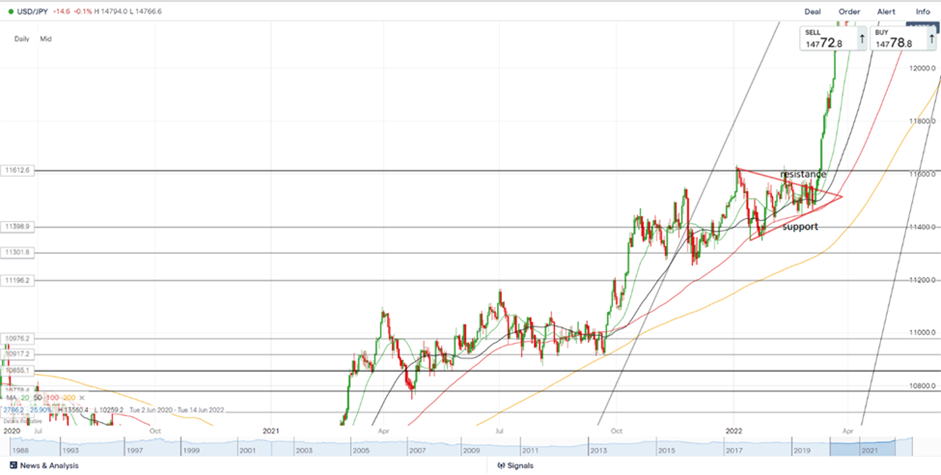
Symmetrical triangle pattern
Here we see a descending resistance line, drawn along the falling highs, and an ascending support line, drawn along the rising lows. Both lines converge almost in the middle of the range. This triangle pattern formed within an uptrend where the resistance line was broken and the ascending price action continued.
How to Trade Using Triangle Patterns
Ascending and descending triangles are the most reliable trend continuation patterns. It means that when an ascending triangle is forming, the price is rather likely to keep rising, and when a descending triangle is forming, the price is rather likely to keep falling. Therefore, in the former case, the ascending line will be a rather strong support level, above which you can get ready to buy in expectation of a resistance breakout. And in the latter case, the descending line will be a rather strong resistance level, below which you can get ready to sell in expectation of a support breakout. The symmetrical triangle can be a pattern of both continuation and reversal of a trend.
Trading strategies that use triangle patterns
Triangle patterns are used in breakouts trading the most. When an ascending triangle is forming, experienced traders prepare to open a buy position after resistance is broken. The best resistance or support breakout point is at ½ or ¾ of the pattern development path or time period. Breakouts before ½ of the path are deemed premature.
Most often, traders expect the price to bounce backto the broken level and a chart candle to close above this level (the time frame is at least 4H).
Example of a USD/CAD buy during a rollback after a breakout:
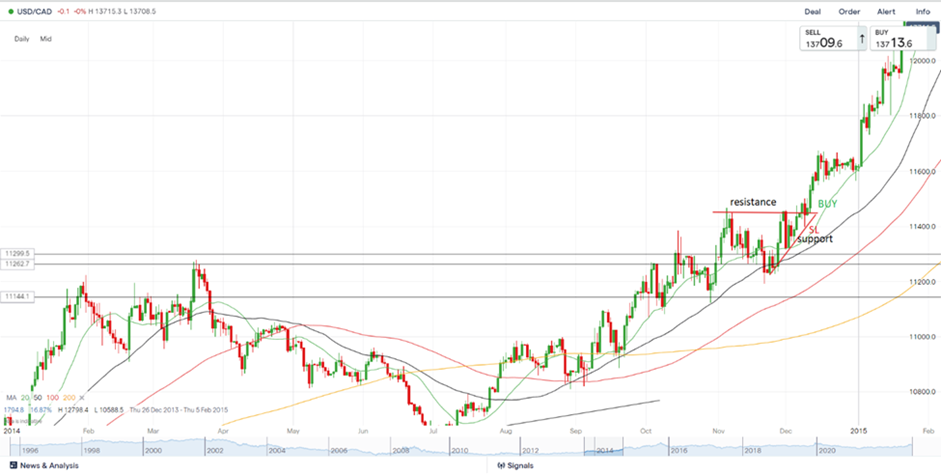
Example of a USD/CAD buy during a rollback after a breakout
In the same USD/CAD chart, we see the formation of an ascending triangle, a break above the horizontal resistance line, a rollback, and a buy during the rollback with a stop loss order below the last low (under the ascending support line). The pair continues to rise, and the trader gains a good profit. As you can see, such a trade offers a very good risk-reward ratio.
The minimum target is set at the distance that equals the distance between the maximum and the minimum points of the triangle. In this case, you can place a trailing stop loss order below МА20.
Selling after a support breakout works the same way:
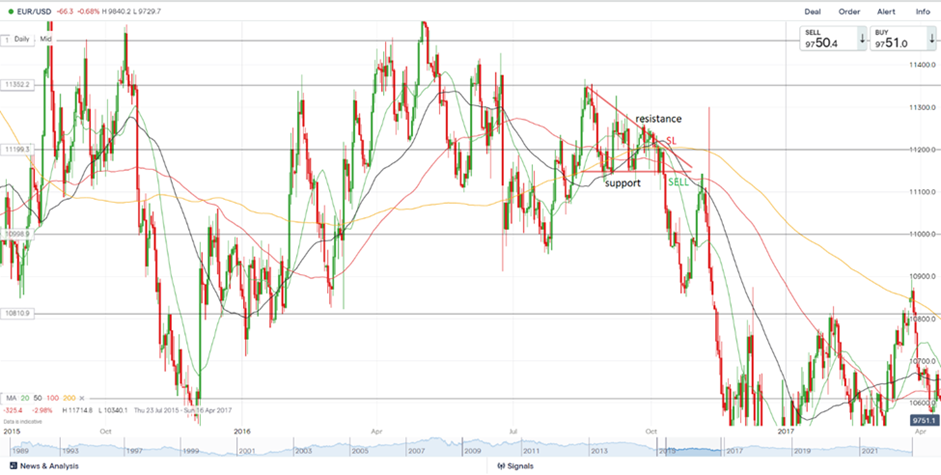
The formation of a descending triangle
In this EUR/USD chart, we see the formation of a descending triangle. The pair sells after a break below the horizontal support line with the placement of a stop loss order above the last high (over the descending resistance line). The minimum target is determined by the same principle as in the previous example with the buy, and a trailing stop loss order placed above МА20 as well.
With ascending and descending triangles, besides the breakout strategy, you can buy or sell above the ascending support line (ascending triangle) or sell below the descending resistance line (descending triangle). In these cases, the risk-reward ratio is very good as well.
There are situations when the price keeps rising or falling without going back to the broken resistance or support level, and a trader opens a buy or sell position with a delay, i.e., when the price has passed a certain distance. In such cases, the trader takes much higher risks because he/she has to place a stop loss order below the broken level.
Example of a symmetrical triangle:
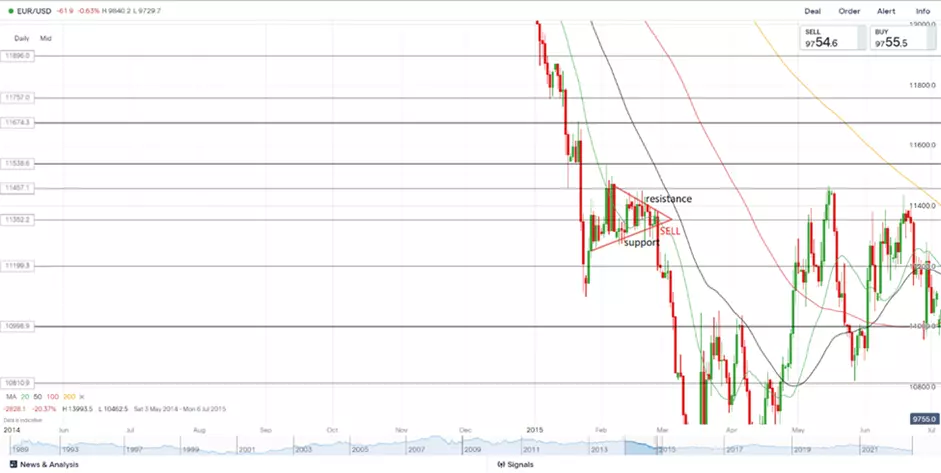
The example of a symmetrical triangle
Here, the price of the EUR/USD pair forms a symmetrical triangle pattern within an active and strong downtrend. In this case, the triangle is a trend continuation pattern where it makes sense to sell after the breakout below the lower side (ascending support line) and place a stop loss order above the upper side (descending resistance line). The minimum profit target is set the same way as in the previous examples, and a trailing stop loss order can be placed above МА50.
How to use triangle patterns more efficiently
As with many other technical analysis patterns or indicators, triangle patterns are best used in combination with other indicators. Moving averages allow traders to identify pronounced trends, as well as support and resistance lines, above or below which stop loss orders should be placed. Also, if the price of an instrument is moving a rather long distance away from the moving average within a 200-day period, it may indicate the strength of the long-term trend.
The relative strength index (RSI) can be used to determine whether an instrument is overbought or oversold. If it’s overbought, a resistance breakout is not likely to happen, and if the instrument is oversold, a support breakout is an unlikely event . At the same time, the state of being overbought increases the chances of a resistance breakout, and the state of being oversold increases the chances of a support breakout.
Volume indicators can also be used to make a decision to enter the market. Volume growth along with the narrowing of price swings near resistance or support increases the likelihood of a breakout. But this indicator can hardly be called reliable because volume growth may also be connected to an increasing interest in selling as the price approaches resistance or an increasing interest in buying as the price descends to support.
Best Brokers 2024


Conclusion
In recent years, many technical analysis patterns have seized to occur as often as, say,10-15-20 years ago. Nevertheless, triangle patterns (ascending, descending, and symmetrical) are still found today, so traders should not exclude them from their trading practice.
Unfortunately, there is a probability of the trend reversal after the formation of any of these triangles, especially symmetrical. For this reason, triangle patterns cannot be called absolutely reliable.
Moreover, every breakout to either side may turn out to be a false breakout, and predicting it is extremely difficult, if not say impossible. The use of confirming signals and indicators can improve your chances of success, but cannot give you a 100% guarantee.
Also, there may be situations where the price truly breaks a level, passes most of the predicted distance but, at some point, reverses, returns to the range, triggers a stop loss order, and then moves in the desired direction again.
Be that as it may, as a trader develops theri skills, they learn to predict movements after consolidations with a higher probability and make money on it. Even after acquiring enough experience in trading with triangle patterns, you should not disregard other technical analysis patterns, fundamental factors, and intermarket analysis.
FAQ
What is a triangle pattern?
A triangle pattern is when the lines, drawn along resistance and support levels, form a triangle.
What are the types of triangle patterns?
Ascending, descending, and symmetrical.
In what trading strategies are triangle patterns used?
The most common strategies are breakouts trading, buying above support level when the price goes up, and selling below resistance level when the price goes down.
Is triangle a trend continuation pattern?
Unfortunately, the symmetrical triangle can be a pattern of both continuation and reversal of a trend. Ascending triangles that occur when the price rises and descending triangles that occur when the price drops are more reliable in this respect.
Glossary for novice traders
-
1
CFD
CFD is a contract between an investor/trader and seller that demonstrates that the trader will need to pay the price difference between the current value of the asset and its value at the time of contract to the seller.
-
2
Forex Trading
Forex trading, short for foreign exchange trading, is the practice of buying and selling currencies in the global foreign exchange market with the aim of profiting from fluctuations in exchange rates. Traders speculate on whether one currency will rise or fall in value relative to another currency and make trading decisions accordingly. However, beware that trading carries risks, and you can lose your whole capital.
-
3
Trailing Stop Order
A Trailing Stop Order is a type of order that automatically adjusts the stop-loss level as the market price moves in a favorable direction, helping to protect profits.
-
4
Day trading
Day trading involves buying and selling financial assets within the same trading day, with the goal of profiting from short-term price fluctuations, and positions are typically not held overnight.
-
5
Options trading
Options trading is a financial derivative strategy that involves the buying and selling of options contracts, which give traders the right (but not the obligation) to buy or sell an underlying asset at a specified price, known as the strike price, before or on a predetermined expiration date. There are two main types of options: call options, which allow the holder to buy the underlying asset, and put options, which allow the holder to sell the underlying asset.
Related Articles


Team that worked on the article

Oleg Tkachenko is an economic analyst and risk manager having more than 14 years of experience in working with systemically important banks, investment companies, and analytical platforms. He has been a Traders Union analyst since 2018. His primary specialties are analysis and prediction of price tendencies in the Forex, stock, commodity, and cryptocurrency markets, as well as the development of trading strategies and individual risk management systems. He also analyzes nonstandard investing markets and studies trading psychology.
Also, Oleg became a member of the National Union of Journalists of Ukraine (membership card No. 4575, international certificate UKR4494).

Dr. BJ Johnson is a PhD in English Language and an editor with over 15 years of experience. He earned his degree in English Language in the U.S and the UK. In 2020, Dr. Johnson joined the Traders Union team. Since then, he has created over 100 exclusive articles and edited over 300 articles of other authors.

Mirjan Hipolito is a journalist and news editor at Traders Union. She is an expert crypto writer with five years of experience in the financial markets. Her specialties are daily market news, price predictions, and Initial Coin Offerings (ICO).
