How to use the OBV indicator
Trading volume analysis appeared in the capital market in the middle of the last century and later gradually moved to Forex in a slightly changed form. In technical analysis, volume-based methods of prediction and trading are placed in a separate group – Volume Spread Analysis (VSA). Although in Forex trading systems these methods are used relatively rarely, developers of MetaTrader 4 have put VSA tools in a separate block consisting of four volume-type indicators. One of them is On Balance Volume. This indicator is also present in most other broker trading platforms and on TradingView.
The OBV indicator | A review
The On Balance Volume indicator compares price changes with trading volume changes. Increasing volumes mean that big investors have come to the market, whose transactions push prices up or down. Seeing price changes, small investors join the market, making the trend even stronger. The indicator was developed in the mid-1940s by supporters of the theory of dependence of prices on the market capital, determining investors’ current interest for the asset.
The indicator is part of the standard set of technical tools found in MT4 and MT5. It’s placed under the price chart in a separate window, in the form of a line, and has no fixed movement range. To the right of the indicator, there’s a scale showing trading volumes.
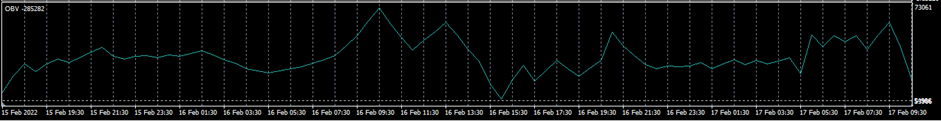
OBV Indicator
What does the On Balance Volume indicator show?
Changes in price and the total volume of executed client orders, followed by impulse price movement.
Big players’ attitude or the reaction of most traders to the fundamental factors.
Traders’ activity extent.
The indicator’s advantage is that it precedes the asset price change. For example, there can be a situation in the market, when big investors start investing in an asset, which most other participants are still selling. Trading volumes increase, OBV goes up, but the price continues to go down by inertia. At some point, trading volumes reduce, purchase volumes rise, and the price goes up following the indicator.
The OBV indicator calculation formula. The indicator compares prices of the current and preceding candlesticks (prices of the Close by default, but their type can be changed in settings). If the price is higher, the volume is added to the preceding candlestick OBV value. If it’s lower, the volume is subtracted. If prices are equal, the preceding indicator value is used.
The pros
Advantages of the OBV indicator:
-
Leading indicator without redrawing, which allows you to estimate the traders’ activity and determine the price movement mode. If the indicator goes up, the preceding candlestick was “bullish”. If it goes down, then it was “bearish”:
-
Understandable signals with clear interpretation.
-
Requires a minimal number of settings.
The On Balance Volume tool is the indicator used in trend markets. It can help to determine reversal points or continuation of the pricing tendency.
The cons
Disadvantages of the OBV indicator:
-
False signals. Prices don’t always rise along with increasing trading volumes. For example, traders’ activity rises at the beginning of the trading session, after holidays, at the moment of fundamental volatility. The number of claims and their volumes increase simultaneously on the part of buyers and sellers, maintaining the market balance. The indicator shows a rapid rise in volumes, but the price remains flat.
-
Low effectiveness at short-term intervals. In M5-M15 timeframes there’s natural volatility that makes the indicator line sharper.
There is a rarely mentioned nuance in calculations of the indicator value. In the capital exchange market, the volumes are registered by the exchange. Forex is an over-the-counter market, which is why one can’t determine transaction volumes here in the same form as at the exchange. Forex has tick volumes. The number of transactions is registered here. It means that to the indicator a 1 USD and a 1,000 USD transaction are equivalent. It considers the number of transactions. That’s why they recommend using it at long intervals, where separate large claims get “blurred” amid a big number of small orders. It doesn’t mean that the indicator doesn’t work in Forex. But if you apply it to one asset of a real capital market and to a CFD for the same asset, it will show different values.
How does the OBV work?
How to use the OBV indicator | The basic signals:
Divergence.
Divergence is the difference in motion directions of the indicator and price. This is one of the strongest signals, which means that the price will also reverse towards the indicator soon. Divergence can be:
Bullish. Lower price minimums and higher indicator minimums.
Bearish. Higher price maximums and lower indicator maximums.
Note that bullish divergence is based on minimums, while bearish divergence is based on maximums.
Example:
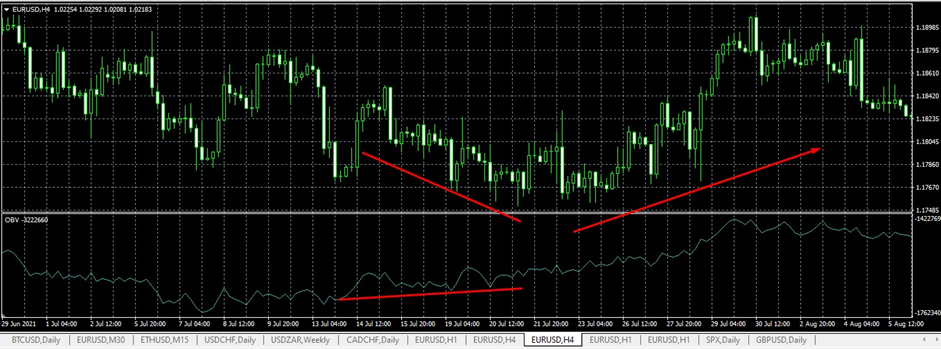
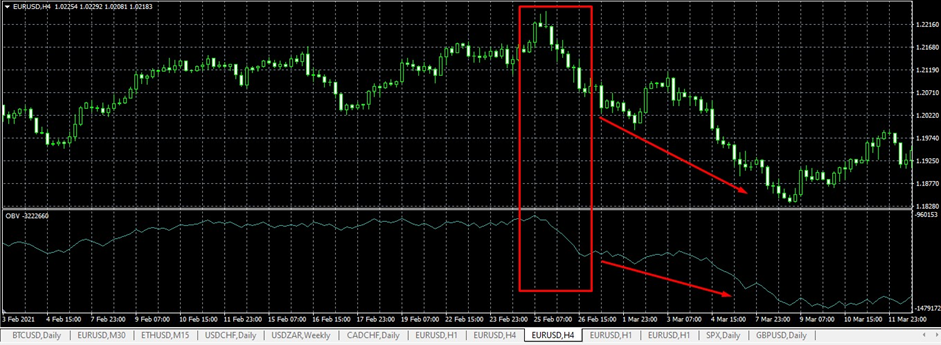
Divergence
Bullish divergence. The indicator gradually rises as the price goes down. The indicator continues to rise, and the price reverses to follow it towards the ascending movement.
Trend confirmation.
If the directions of the indicator and price coincide, it suggests that the tendency continues. The signal is confirming, but it’s important to understand that any ascending movement ends. Therefore, the trader’s task is to enter the market just in time, not too late, and look for the trend-ending signals, for example, with Price Action. Or open a transaction after the trend reverses.
Example:
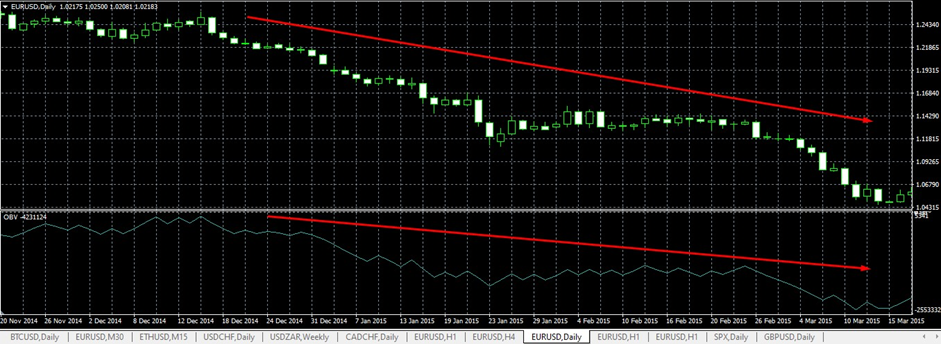
Trend confirmation
A long descending indicator movement is confirmed by a descending price movement. The fluency of the indicator line points to a strong trend.
Level breach.
The idea of the signal is that during certain periods of time each asset has its own trading volume. Its abrupt changes are followed by price changes. To search for the signal, one specifies horizontal levels, denoting the range in which the indicator has been staying the longest. To determine the range, one sets a minimal scale. A breach in the resistance level will be the signal to open a transaction.
Example:
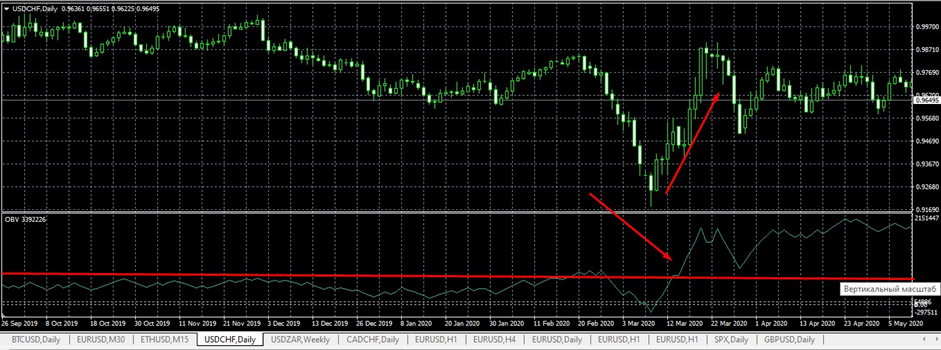
Level breach
Comparatively the same trading volumes have been observed in the daily timeframe for a long time. Their abrupt rise with the resistance line breach is followed by a no less abrupt price surge.
Abrupt volume surge.
An abrupt change in the indicator value suggests that big players have entered the market and they will be followed by an abrupt rise in price. If the indicator is moving against the trend, it’s a reversal signal, confirmed by the trend.
Example:
Level breach
For a long time, the indicator line has been practically horizontal without abrupt jumps. An abrupt drop in the trading volumes caused a descending trend.
OBV settings
The indicator has practically no settings, which is partially an advantage and a downside. On the one hand, the absence of settings simplifies its adjustment to a timeframe or an asset. On the other hand, it makes its optimization impossible. But the indicator code is open, so if you want, you can go to the freelance section of the MQL5 website and order its improvement by an individual algorithm.
Indicator settings consist of three tabs:
1. Parameters. The main settings tab:
Apply to – Here you specify the price type used to calculate the indicator value. There are 7 options, including open and close prices, median and weighted prices, and so on.
Style – Here you set the indicator visualization type. Color, line thickness, dotted line, etc.
Level assignment – Activation of this parameter assigns the chart level values, which are specified in settings. If the OBV value goes higher than the maximum or lower than the minimum, the indicator line will disappear from the chart.
2. Levels. Here you can add any number of levels that will be visualized in the indicator window as horizontal lines. It’s convenient when you need to visually trace trading volumes going higher or lower than a certain value (analog of the levels that limit overbought and oversold zones).
3. Visualization. Activation of the indicator visualization in separate timeframes. For instance, if you only activate H1, the indicator disappears from the chart when you switch to other intervals.
Best strategies based on the OBV indicator
General recommendations on strategies that use On Balance Volume:
The rise of the indicator to a new maximum means that the “bulls” are strong and confirms that the ascending movement will most likely continue. Open transactions at the “top” of the new indicator. In a “bear” market it’s the other way around. The price drops, then after upward correction updates the new minimum, while the indicator draws new maximums. It’s a signal to open a long position. For a short position, the situation is contrary.
If the price is at the bottom limit of its channel, the OBV draws new maximums. It’s a signal to open a long position. The price is at the top limit of the channel when the OBV draws new minimums. That is a signal to open a short position.
The OBV indicator application. An example of a strategy.
A simple strategy for beginners, based on the SMA trend indicator, as it gives basic signals. In that situation, the On Balance Volume serves as a confirming tool.
Initial conditions:
-
Currency pair – AUD/USD. The classic, commonly linked EUR/USD pair is less convenient because it reacts to fundamental factors dramatically.
-
Timeframe: H4. This strategy suggests making small directed moves 3-5 candlesticks long. That’s why a relatively big candlestick body is important.
-
Indicators: SMA (14), OBV.
A signal to open a transaction is when the price crosses the moving average. If at that moment OBV draws new maximums or minimums, open a transaction at the next candlestick.
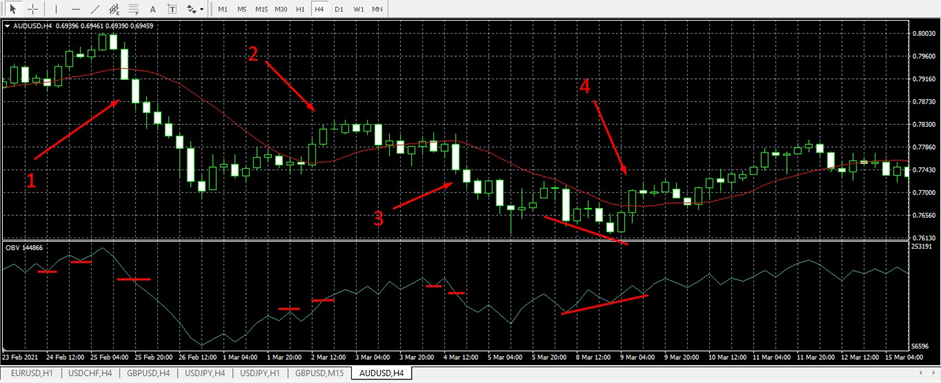
How to Use OBV Indicator
1 – A strong signal for several reasons. First, the OBV is high and its reversal means the beginning of a strong descending movement. You can add an oscillator to make sure the price is in the overbought zone. Second, descending candlesticks have a relatively big body, which means the “bears” are getting stronger. Open a transaction at the next candlestick after the price crosses the MA (moving average).
2 – False signal. Although all conditions have been observed, the ascending movement quickly ended. It’s better to close such a transaction manually and not wait for the automatic stop. The reason for closing is the emergence of a Doji candlestick pattern, a thin-line candlestick, which points to the balance between the “bulls” and “bears”.
3 – Weak signal. If there is a candlestick closing under the MA, the OBV goes down. Despite the signal weakness, it’s still profitable. But it’s also better to close the transaction manually. The signal is the emergence of a reversal pattern, in this case, the “hammer”.
4 – Strong signal, divergence. The price goes down, each following an OBV minimum that is higher than the previous one. Open a transaction right after the price crosses the MA.
Leaving the market is an individual decision. It’s desirable to control open transactions and close them manually on reversal signals. Transactions can be insured by trailing if you set it a bit further than the local extremum.
Should I use the OBV indicator?
The On Balance Volume function is one of many technical analysis tools, which is useful in its own way and has advantages and downsides. It can be used in the following cases:
In the capital market. For instance, in the MT5 trading platform, where there’s a full market depth.
On assets, which follow the Elliott Wave Principle and have a visible cycle of operation for long periods. For example, currency pairs AUD/USD, AUD/CAD, and NZD/USD.
For preliminary market analysis: traders’ activity, price movement direction, upcoming reversal probability.
At short intervals and at the moment of news publication the indicator shows a lot of false signals. Its movements become more abrupt and don’t correspond to the price movement. Use On Balance Volume as an additional indicator that confirms the signal.
FAQs
What signals does the On Balance Volume indicator give?
How to use the OBV indicator. Basic signals:
Trend confirmation. Appears in the chart as matching movement directions of the indicator and price. Helps to find long trends at daily and weekly intervals. Can be used to search for price reversal points.
Divergence. One of the strongest, but rare signals. The difference between the indicator and price movement directions means that the price will soon follow the indicator.
Breach of the OBV resistance level. The indicator leaving the main range suggests the local increase in trading volumes, which will be followed by the price rise.
All signals require confirmation by oscillators, trend indicators, and patterns.
The OBV is compatible with which trading systems?
The On Balance Volume tool is a leading indicator that works well with trend tools. Trading systems that use it suggest searching for the points of price movement change. Therefore, OBV can be used as an addition to Moving Averages, the Alligator, and other channel indicators. The end of a trend movement can also be determined by patterns or oscillators.
In what situations does the indicator show the most accurate signals?
In the capital market, the indicator can be applied in any timeframe. In Forex, due to the specific character of the tick volumes accounting, it’s not the position volume in lots that is taken into account, but the number of transactions. That’s why the indicator more accurately reflects the market situation at daily and weekly intervals, where the number of transactions is enough to reduce the influence of separate big orders.
The indicator also helps to find signals in trend markets. Therefore, use it on assets, which are highly liquid and volatile in a long-term period. For instance, for EUR/USD the indicator gives more false signals than for pairs with CAD, AUD, and NZD.
How much can you trust the indicator signals?
The indicator is based on logical conclusions, which suggest the trend price movement following the trading volume increase. That’s why the indicator signals can be called accurate. But the volume rise can also take place when the balance between supply and demand is kept, so the indicator sometimes gives false signals. To filter the signals, use timeframes from H1, in which there’s no price fluctuation and the influence of market makers is minimal. Confirm the indicator signals with other oscillators and watch the patterns forming in the price chart.
Glossary for novice traders
-
1
Price action trading
Price action trading is a trading strategy that relies primarily on the analysis of historical price movements and patterns in financial markets, such as stocks, currencies, or commodities. Traders who use this approach focus on studying price charts, candlestick patterns, support and resistance levels, and other price-related data to make trading decisions.
-
2
Volatility
Volatility refers to the degree of variation or fluctuation in the price or value of a financial asset, such as stocks, bonds, or cryptocurrencies, over a period of time. Higher volatility indicates that an asset's price is experiencing more significant and rapid price swings, while lower volatility suggests relatively stable and gradual price movements.
-
3
Forex indicators
Forex indicators are tools used by traders to analyze market data, often based on technical and/or fundamental factors, to make informed trading decisions.
-
4
Short selling
Short selling in trading involves selling an asset the trader doesn't own, anticipating its price will decrease, allowing them to repurchase it at a lower price to profit from the difference.
-
5
Forex Trading
Forex trading, short for foreign exchange trading, is the practice of buying and selling currencies in the global foreign exchange market with the aim of profiting from fluctuations in exchange rates. Traders speculate on whether one currency will rise or fall in value relative to another currency and make trading decisions accordingly. However, beware that trading carries risks, and you can lose your whole capital.
Related Articles


Team that worked on the article

Andrey Mastykin is an experienced author, editor, and content strategist who has been with Traders Union since 2020. As an editor, he is meticulous about fact-checking and ensuring the accuracy of all information published on the Traders Union platform. Andrey focuses on educating readers about the potential rewards and risks involved in trading financial markets.
He firmly believes that passive investing is a more suitable strategy for most individuals. Andrey's conservative approach and focus on risk management resonate with many readers, making him a trusted source of financial information.
Also, Andrey is a member of the National Union of Journalists of Ukraine (membership card No. 4574, international certificate UKR4492).

Dr. BJ Johnson is a PhD in English Language and an editor with over 15 years of experience. He earned his degree in English Language in the U.S and the UK. In 2020, Dr. Johnson joined the Traders Union team. Since then, he has created over 100 exclusive articles and edited over 300 articles of other authors.
