Top 8 Best Trend Indicators You Should Know


Editorial Note: While we adhere to strict Editorial Integrity, this post may contain references to products from our partners. Here's an explanation for How We Make Money. None of the data and information on this webpage constitutes investment advice according to our Disclaimer.
Top Best Trend Indicators You Should Know:
- Moving Averages - the most often used indicators in the stock market;
- Relative Strength - commonly used to determine overbought and oversold levels;
- Price Action - flashes of activity that indicate the formation of a trend;
- Multiple Time Frame - an excellent tool for determining how higher time frames are trending;
- Bollinger Bands - a type of indicator that is generated from standard deviation and moving averages.
This guide will break down our top eight picks for the best trend indicators for traders. We'll also explore what trend indicators actually are, how they work, who should use them, and how to use them to benefit one's trading strategy. We will also break down how to match different trend indicators and which trading platforms are the best for using trend indicators. Let's start by breaking down what trend indicators actually are.
What are Trend Indicators?
Trend trading is a form of trading strategy that aims to benefit traders by analyzing the current trend in a certain direction utilizing trend indicators. A trend occurs when the price of a stock goes in a specific direction, such as up or down.
When the stock is heading upward, traders who follow trend trading will opt to take a long position. When an asset is going downhill, trend traders will then take a short position. Trading with market and asset trends is profitable for trend traders because they essentially automate the research needed to make more accurate predictions. This form of trend trading makes money by analyzing stock or asset momentum in a specific direction.
Traders can use trend indicators to determine if trends will continue or reverse. Of course, no one technical signal can help you make money. Traders must also have a clear risk management strategy and trading mindset. Nonetheless, trend indicators may be quite beneficial to both day traders and casual traders.
Top 8 Best Trend Indicators in Technical Analysis
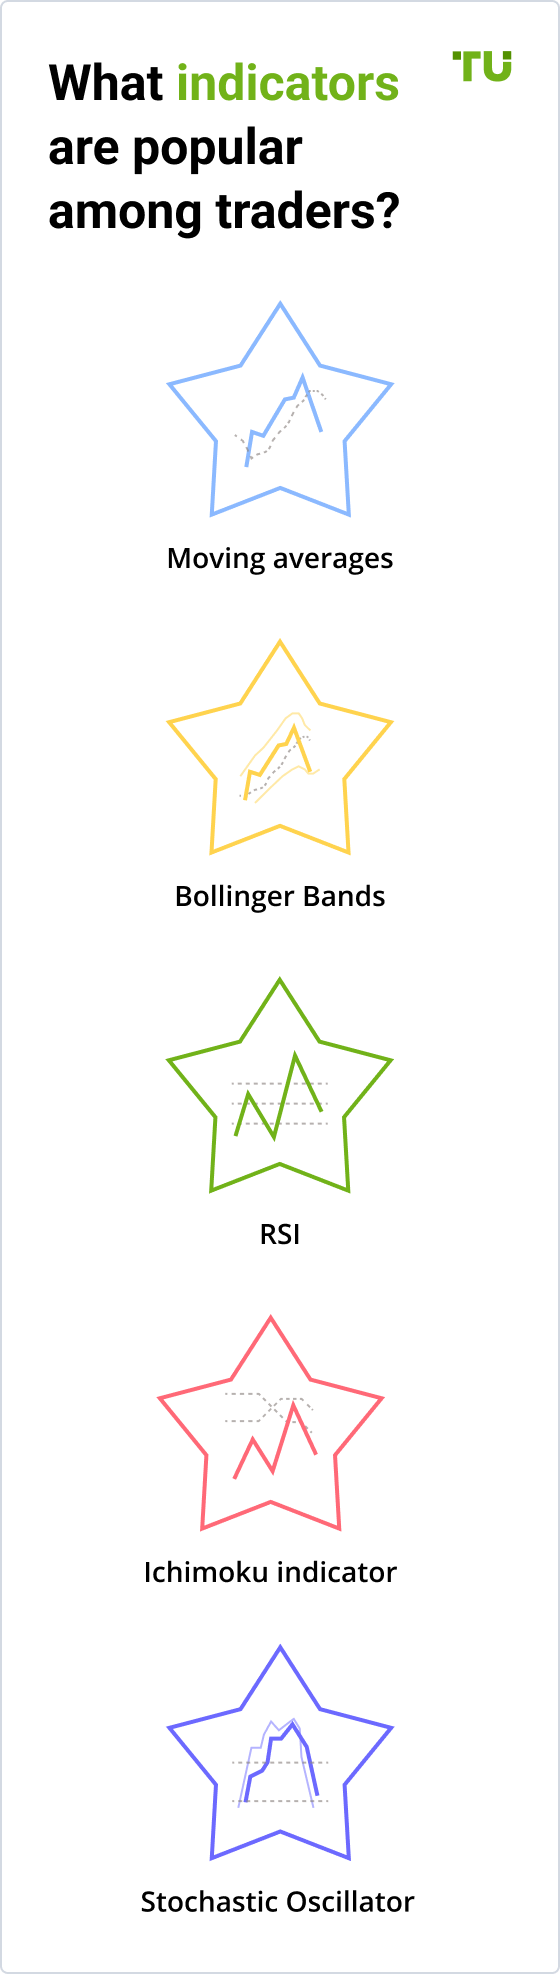
Our experts at Traders Union selected the following trend indicators based on different criteria, such as usefulness, effectiveness, use cases, and other benefits. Our top picks for the best trend indicators include moving averages, relative strength, price action, multiple time frames, Bollinger bands, advance-decline lines, stochastic oscillator, and ichimoku kinko hyo.
1. Moving Averages
The most often used indicators in the stock market are moving averages. In fact, other indicators such as Bollinger Bands and Moving Average Convergence Divergence (MACD) are built on top of them.
Moving averages may be used in a variety of ways, such as reversals. However, trend trading is the most popular use case for moving averages. Essentially, a trend trader will use this indicator when a moving average is added to a chart and the trade is held as long as the price is above or below the moving average. Simple, smoothed, and hull are examples of different types of moving averages. Many brokers and online platforms will include moving average indicators in their chart functions.
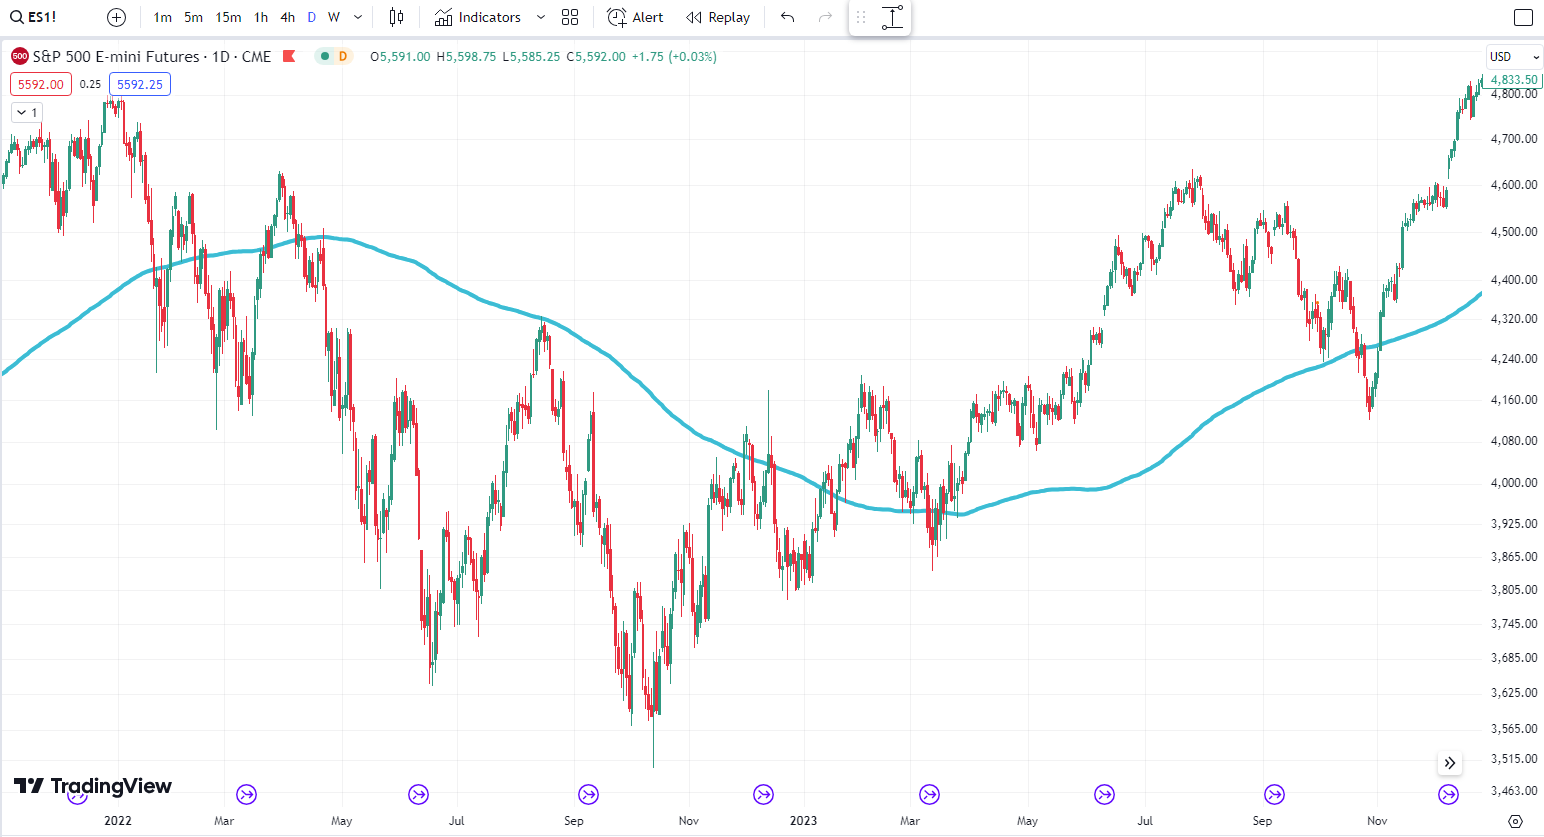 Simple Moving Average (200-day period)
2. Relative Strength
The relative strength index (RSI) is an essential indicator for any technical trader to master. While the RSI can signal whether a market is overbought or oversold, its greatest strength lies in identifying potential reversals through divergences. Divergences are one of the most powerful tools available for spotting trend changes.
When the price makes a new high or low but the RSI does not confirm the move, forming a divergence, it suggests the underlying momentum is weakening. This divergence between price and momentum is a red flag that the trend may be ready to reverse. Traders must pay close attention to divergences, as they provide early warning signs of an impending trend change.
Of the two divergence types, bullish and bearish, both can offer highly profitable trade setups if caught early. A bullish divergence formed at oversold RSI levels often leads to an upswing, while a bearish divergence seen in overbought territory frequently prefaces a downturn. Mastering divergence recognition is absolutely crucial for any technician looking to anticipate reversals and maximize winning trades.
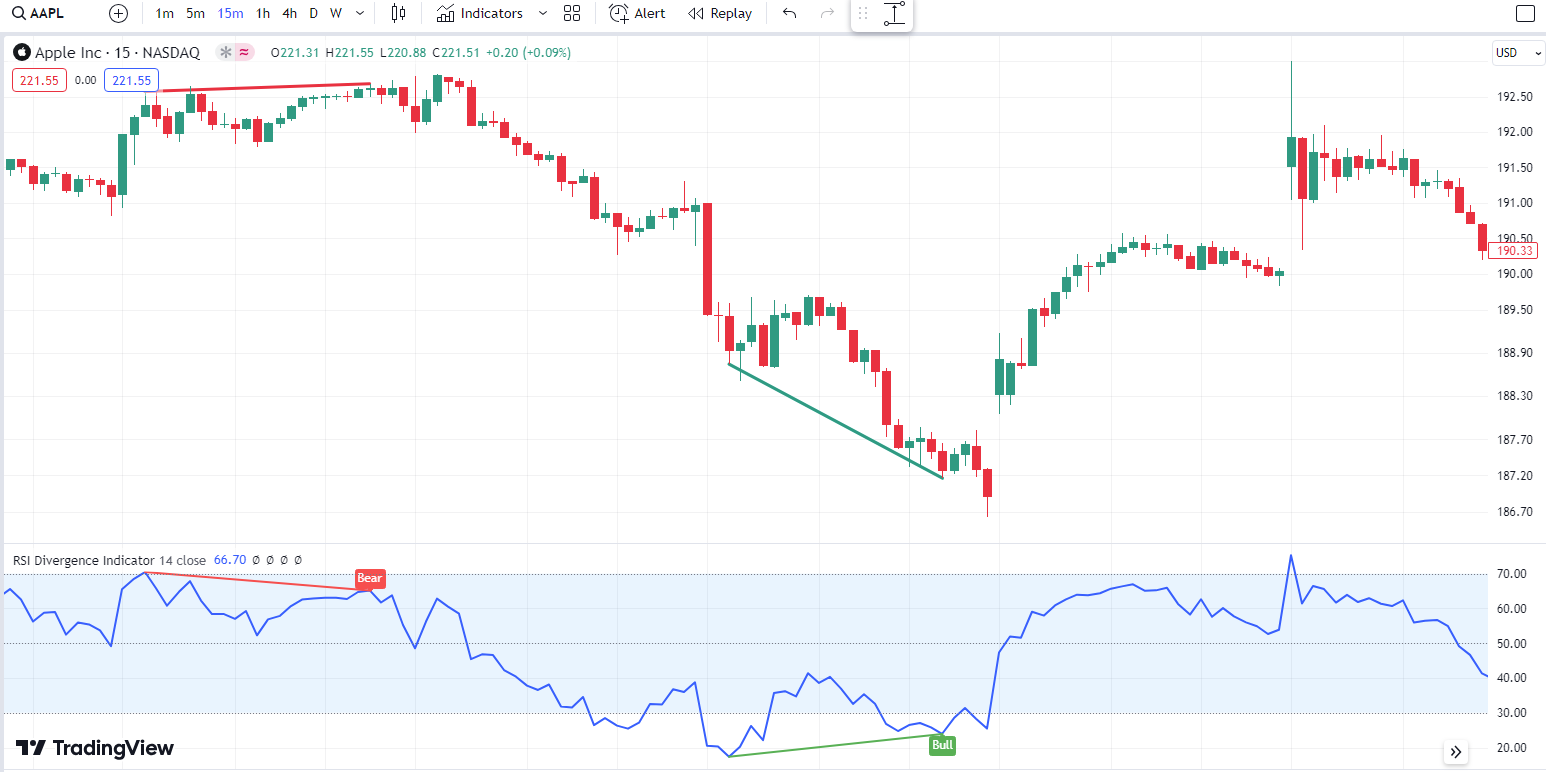 Bullish and Bearish divergences
3. Price Action
In trading, price action examines the behavior of a security, index, or commodity in order to forecast what it will do in the future. One may want to take a long position if their price action research indicates that the price is going to climb, or one may want to short the asset if they feel the price is due to fall.
On a trading chart, price action indicators are flashes of activity that indicate the formation of a trend. Seasoned traders can rapidly identify these signs and utilize them to make smart market wagers in real-time. Price action signals, also known as price action patterns or price action triggers, are clearly identifiable patterns in the market that may be utilized to forecast future market behavior. By recognizing specific patterns or repeats in historical performance, experienced traders may occasionally notice these indications at a glance.
The most reliable price action patterns include Bull/Bear Flag, Ascending/Descending Triangle, Bullish/Bearish Rectangle, Head and Shoulders.
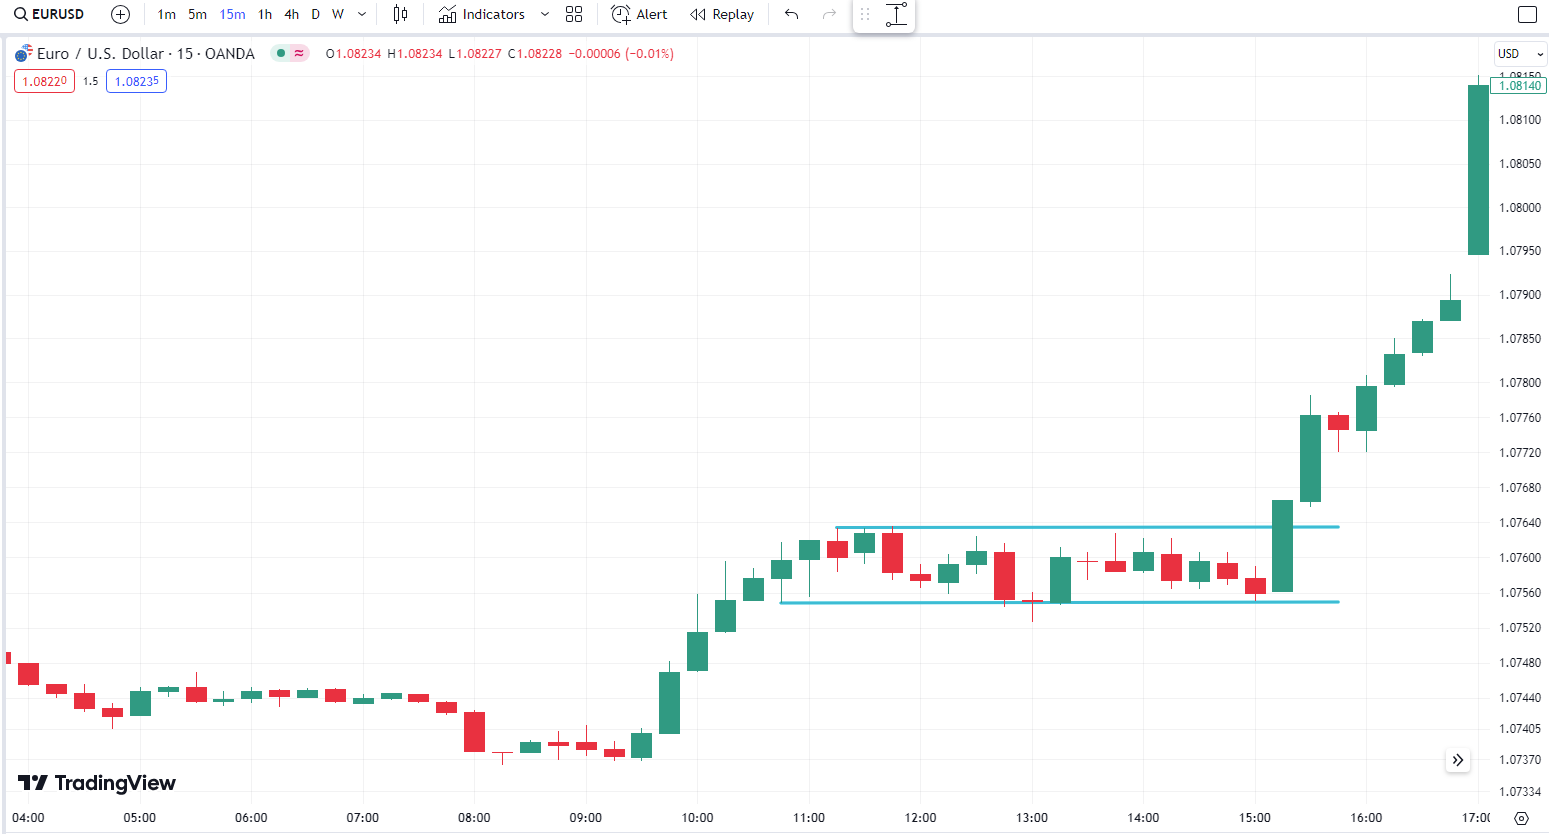 Bullish Rectangle
4. Multiple Time Frame
When looking at a trading chart, it's helpful to know if the time period that you are looking at is trading in sync with other time frames. The Multiple Time Frame Indicator, or MTF, is an excellent tool for determining how higher time frames are trending. The red and green dots make it simple to see if your current time frame's price trend is going with or against the underlying's general trend.
Using the MTF Indicator to trade is all about spotting broad price patterns. Price patterns in indexes, stocks, ETFs, currencies, or any other instruments you are trading will extend from higher time frames down to the chart you are currently looking at. The tendency will be greater inside the lower time frames as the time frames go higher. The convergence of trends inside the higher time frames is what a trader is basically searching for in these MTF lines, as this information will provide confirmation for directional or non-directional activity.
5. Bollinger Bands
Bollinger Bands is a type of indicator that is generated from standard deviation and moving averages. The indicator's center line represents a period's moving average, while the upper and lower lines represent standard deviations. The standard deviation is generally 0.2, while the moving average is usually 20.
The most common application of Bollinger Bands is in trend-following strategies. During an uptrend, the price almost always stays between the indicator's middle and upper lines. As a result, as long as the price is between these two lines, the objective is to purchase. When the price is between the lower and middle lines, however, sell indications appear. When the price is towards the lower line of the bands, a negative trend will be strong.
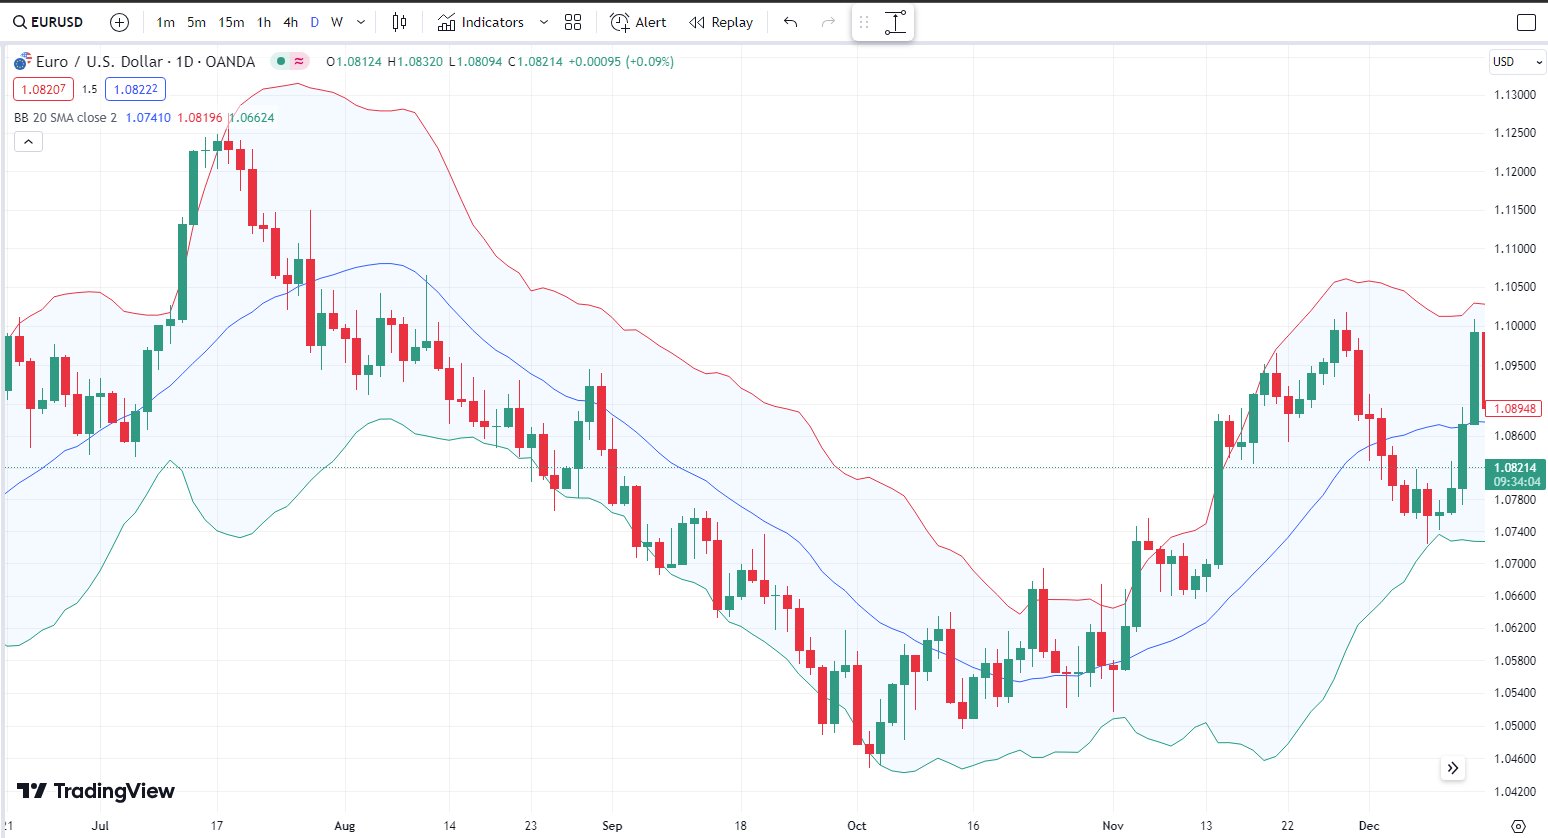 Bollinger Bands
6. Advance-Decline Line
The Advance-Decline Line is a popular trend indicator for trading indexes such as the Dow Jones. This particular indicator is generated by comparing the number of stocks that are rising and those that are dropping throughout the course of a trading session.
If the number of advancing shares exceeds the number of declining shares, the indicator will continue to rise, and vice versa. If the indication is declining while the indicator is rising, it means that only a few businesses are driving the rally.
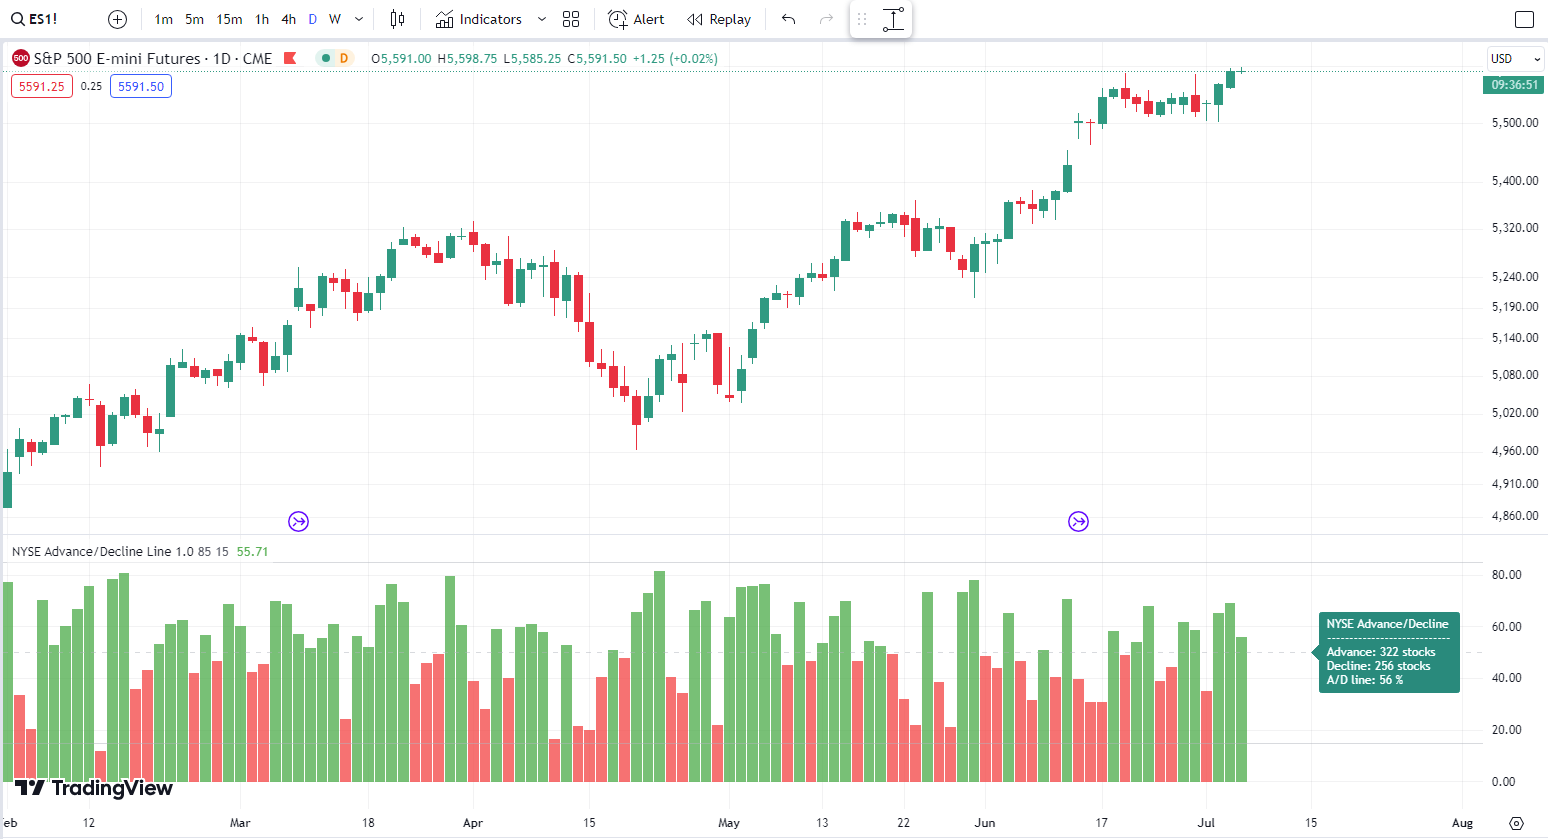 Advance-Decline Line
7. Stochastic Oscillator
The Stochastic oscillator is a widely-used oscillator indicator used for detecting overbought and oversold levels. The percent D and percent K lines are the two lines that make up this indication. It also helps traders identify the upper and lower bands, which are 80 and 20 respectively.
Buy or purchase indications appear when the two lines cross over below the lower band, while sell signals appear when the two lines cross over above the higher band. A bullish trend would continue after the crossing as long as the two lines are heading upwards, and vice versa. While not every trading platform out there will include stochastic oscillators, many major platforms include visualized stochastic oscillators in their charts.
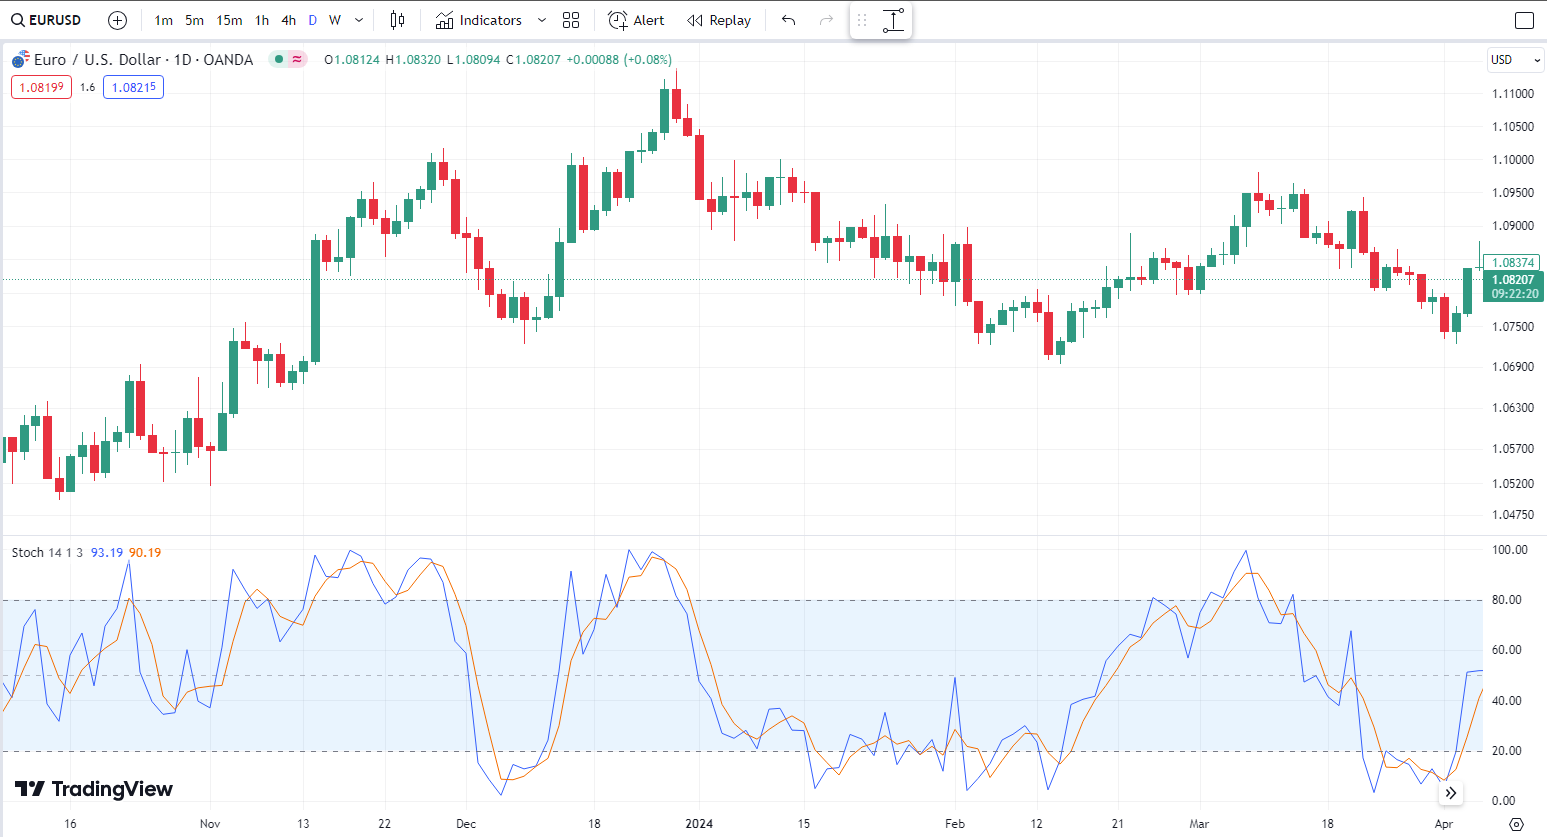 Stochastic Oscillator
8. Ichimoku Kinko Hyo
Novice traders may not be familiar with this Japanese trend indicator, but it can be very useful for advanced traders. In fact, beginner traders could benefit from using ichimoku kinko hyo indicators, as they are fairly easy to use and very accurate. The conversion, baseline, trailing span, and lead 1 and 2 are among the lines that make up this indication.
The Ichimoku indicator can be used in a variety of trading methods. When the conversion and base lines cross, for example, you may see if there are any reversals. You may also use it to follow trends. When the price is above the Ichimoku cloud, a bullish trend will remain in the bullish view. Traders may also benefit from utilizing this indicator’s lagging line in such a scenario. The price will be above the lagging line in a bullish trend.
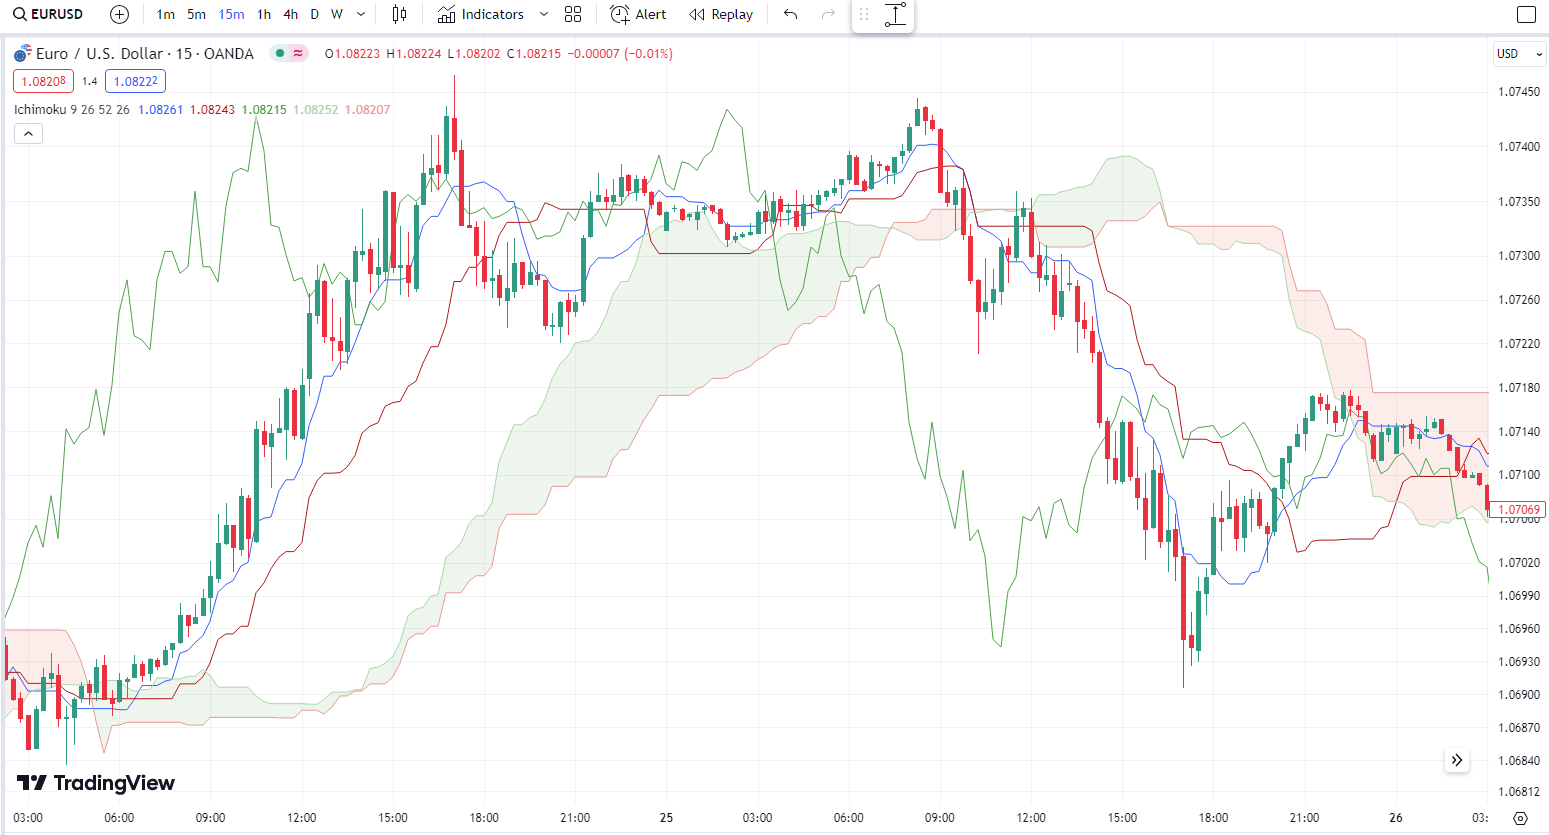 Ichimoku Kinko Hyo
Should I Use Trend Indicators?
We would recommend using trend indicators, though it is worth noting that a trend indicator is not a replacement for research and trading skills. Think of trend indicators as handy tools for improving one’s trading experience and outcomes. Trend indicators can provide cleaner charts, better trading outcomes, and less time spent heavily researching market trends. Trend indicators can also provide trading signals that make day trading quite easier.
How to Use Trend Indicators in My Strategy?
One will either integrate a signal tool into their trading platform of choice or simply monitor trend indicators on another screen while day trading. We recommend the latter, as it is a bit more simple. However, many trend indicators might be already integrated into your trading platform of choice.
Some trend-following indicators are immediately on the price panel, sending a negative signal above price and a positive signal below price. Other indicators are drawn underneath the panel, creating upticks and downticks from zero to one hundred, or over a central zero line. This results in bullish and/or bearish types of divergences when the price is opposed. We would recommend doing some research about your specific trading platform to see if such indicators are already part of your trading dashboard, as this is the most convenient way to use trend indicators on a native platform.
Using a broker that provides access to multiple trading platforms like MT4, MT5, TradingView, and cTrader has several key benefits for incorporating trend indicators into your strategy. You get exposure to more built-in and community-developed indicators across platforms.
This vastly expands your indicator options. You can also test strategies consistently on different interfaces via the same broker. This provides flexibility if your usual platform encounters issues. Overall, such multi-platform brokers give traders a significant advantage when implementing trend-following strategies through wider indicator selection, community resources, and cross-platform reliability.
| iBroker | Pepperstone | Fusion Markets | |
|---|---|---|---|
|
MT4 |
Yes | Yes | Yes |
|
MT5 |
Yes | Yes | Yes |
|
TradingView |
Yes | Yes | Yes |
|
cTrader |
Yes | Yes | Yes |
|
Proprietary platform |
Yes | Yes | No |
|
Open account |
Study review | Go to broker Your capital is at risk.
|
Go to broker Your capital is at risk. |
Can I Match Different Trend Indicators?
It is possible and also necessary to combine indicators. Doing so can provide a robust toolkit for trading that will benefit your unique trading strategy. However, it’s important to not just match or combine trend trading indicators. There are actually three different types of trend indicators -- trend indicators, volatility indicators, and momentum indicators. Your toolkit of indicators should include a variety of signals from each indicator type. Using too many trend indicators specifically can result in indicator redundancy. This involves using trend indicators that compile the same type of data with the same type of conclusions, which isn’t particularly useful. We recommend experimenting with different combinations of trend indicators to avoid redundancy. However, redundancy isn’t always particularly bad. If you have two trend indicators that confirm the same signal, that signal is amplified as a whole.
Summary
Trend trading is a type of trading technique that uses indicators to analyze the current trend in a certain direction in order to benefit traders. When the price of a stock moves in one direction, such as up or down, it is called a trend.
There are thousands of trend indicators available online today, but not all of them are reliable. Moving averages, relative strength, price action, numerous time frames, Bollinger bands, advance-decline lines, stochastic oscillator, and ichimoku kinko hyo are among our favorite trend indicators.
Long-term use of trend indicators is recommended, yet it should be noted that trend indicators are not a substitute for research and trading abilities. Consider trend indicators to be useful instruments for enhancing one's trading experience and results. Trend indicators may help you create cleaner charts, improve your trading results, and spend less time investigating market patterns. Trading signals may be generated using trend indicators, making day trading a lot easier.
FAQs
What is technical analysis in the context of trading?
To better understand the nature of trend indicators, it helps to understand what technical analysis is. Trend indicators are a part of technical analysis in trading, and they are just one tool found in this analytical strategy. Technical analysis, as opposed to fundamental analysis, focuses on the examination of price and volume. Fundamental analysis aims to estimate a security's worth based on business performance such as sales and earnings. Technical analysis methods are used to examine how variations in price, volume, and implied volatility are affected by supply and demand for different securities.
Technical analysis is frequently used to produce short-term trading signals using various charting tools, but it may also be used to enhance the assessment of a security's strength or weakness in relation to the larger market or one of its sectors. This data aids market analysts and day traders in improving their complete valuation estimate. Any security with past trading data can benefit from technical analysis. However, technical analysis is far more common in commodities and foreign exchange markets, where traders are more concerned with short-term price swings
What are some other trend indicators?
Our top eight trend indicators are definitely worth looking into, but there are some additional trend indicators out there that day traders swear by. A few of these include Coppock indicators, Donchian channels, KST indicators, linear regression indicators, and parabolic SAR.
Should I bother using a trend indicator?
We would absolutely recommend using one or even a few trend indicators as a beginner trader, if only for the minimal guidance they offer. While traders seldom depend on a single technical indicator to make a trading decision in their chosen market, trend indicators are frequently combined in manual as well as automated trading systems to generate effective trading signals. They're also useful for confirming information generated by other indicators and signals.
How can I choose the right trend indicator for my trading style?
Any of the eight trend indicators we mentioned in this guide are worth testing out in a demo account. However, we recommend looking at the bigger picture when it comes to choosing a trend indicator that you plan on sticking with long-term. Try out different trend indicators and see how they compliment each other and your specific trading style. A vast majority of trend indicators are free to use and many brokers already offer indicator integrations on their platforms, so it’s just a matter of testing each one out.
Editors' Top Picks and Insights

Lindsey Graham death: U.S. senator’s crypto legacy

Tether under pressure: USDT in Europe, audit questions, and the fight for trust

Lean Ethereum: Why Buterin wants to rebuild the network

SK Hynix debuts on Nasdaq: Largest U.S. offering by foreign company

SpaceX falls out of orbit: Does anyone still want Musk’s stock?

The crypto IPO problem: How high-profile listings became investor traps
Related Articles
Team that worked on the article
Chinmay Soni is a financial analyst with more than 5 years of experience in working with stocks, Forex, derivatives, and other assets. As a founder of a boutique research firm and an active researcher, he covers various industries and fields, providing insights backed by statistical data.
Dr. BJ Johnson is a PhD in English Language and an editor with over 15 years of experience. He earned his degree in English Language in the U.S and the UK.
Mirjan Hipolito is a journalist and news editor at Traders Union. She is an expert crypto writer with five years of experience in the financial markets.
Fundamental analysis is a method or tool that investors use that seeks to determine the intrinsic value of a security by examining economic and financial factors. It considers macroeconomic factors such as the state of the economy and industry conditions.
Ethereum is a decentralized blockchain platform and cryptocurrency that was proposed by Vitalik Buterin in late 2013 and development began in early 2014. It was designed as a versatile platform for creating decentralized applications (DApps) and smart contracts.
Index in trading is the measure of the performance of a group of stocks, which can include the assets and securities in it.
Volatility refers to the degree of variation or fluctuation in the price or value of a financial asset, such as stocks, bonds, or cryptocurrencies, over a period of time. Higher volatility indicates that an asset's price is experiencing more significant and rapid price swings, while lower volatility suggests relatively stable and gradual price movements.
Short selling in trading involves selling an asset the trader doesn't own, anticipating its price will decrease, allowing them to repurchase it at a lower price to profit from the difference.

-
 Afghanistan
-
 Albania
-
 Algeria
-
 Angola
-
 Argentina
-
 Armenia
-
 Australia
-
 Austria
-
 Azerbaijan
-
 Bahamas
-
 Bahrain
-
 Bangladesh
-
 Belarus
-
 Belgium
-
 Bolivia
-
 Botswana
-
 Brazil
-
 Brunei
-
 Bulgaria
-
 Cambodia
-
 Cameroon
-
 Canada
-
 Chile
Chile
-
 China
China
-
 Colombia
-
 Congo
Congo
-
 Costa Rica
-
 Cote d'Ivoire
-
 Croatia
-
 Cuba
Cuba
-
 Cyprus
-
 Czechia
-
 DR Congo
-
 Denmark
-
 Dominican Republic
-
 Ecuador
-
 Egypt
Egypt
-
 El Salvador
-
 Estonia
-
 Eswatini
-
 Ethiopia
-
 Finland
-
 France
-
 Georgia
-
 Germany
-
 Ghana
Ghana
-
 Greece
-
 Haiti
Haiti
-
 Hong Kong
-
 Hungary
-
 India
India
-
 Indonesia
-
 Iran, Islamic republic
-
 Iraq
Iraq
-
 Ireland
-
 Israel
-
 Italy
Italy
-
 Jamaica
-
 Japan
Japan
-
 Jordan
-
 Kazakhstan
-
 Kenya
Kenya
-
 Korea
Korea
-
 Kuwait
-
 Kyrgyzstan
-
 Laos
Laos
-
 Latvia
-
 Lebanon
-
 Lesotho
-
 Libya
Libya
-
 Lithuania
-
 Luxembourg
-
 Madagascar
-
 Malaysia
-
 Malta
Malta
-
 Mauritius
-
 Mexico
-
 Moldova
-
 Mongolia
-
 Montenegro
-
 Morocco
-
 Mozambique
-
 Myanmar
-
 Namibia
-
 Nepal
Nepal
-
 Netherlands
-
 New Zealand
-
 Nigeria
-
 North Macedonia
-
 Norway
-
 Oman
Oman
-
 Pakistan
-
 Palestine
-
 Panama
-
 Papua New Guinea
-
 Paraguay
-
 Peru
Peru
-
 Philippines
-
 Poland
-
 Portugal
-
 Puerto Rico
-
 Qatar
Qatar
-
 Reunion
-
 Romania
-
 Rwanda
-
 Saudi Arabia
-
 Serbia
-
 Singapore
-
 Slovakia
-
 Slovenia
-
 Somalia
-
 South Africa
-
 Spain
Spain
-
 Sri Lanka
-
 Sweden
-
 Switzerland
-
 Syria
Syria
-
 Taiwan
-
 Tajikistan
-
 Tanzania
-
 Thailand
-
 Trinidad and Tobago
-
 Tunisia
-
 Turkey
-
 UAE
UAE
-
 Uganda
-
 Ukraine
-
 United Kingdom
-
United States
-
 Uruguay
-
 Uzbekistan
-
 Venezuela
-
 Vietnam
-
 Yemen
Yemen
-
 Zambia
-
 Zimbabwe
- Forex
- Crypto
