Ichimoku Kinko Hyo. A Comprehensive Guide For Traders


Editorial Note: While we adhere to strict Editorial Integrity, this post may contain references to products from our partners. Here's an explanation for How We Make Money. None of the data and information on this webpage constitutes investment advice according to our Disclaimer.
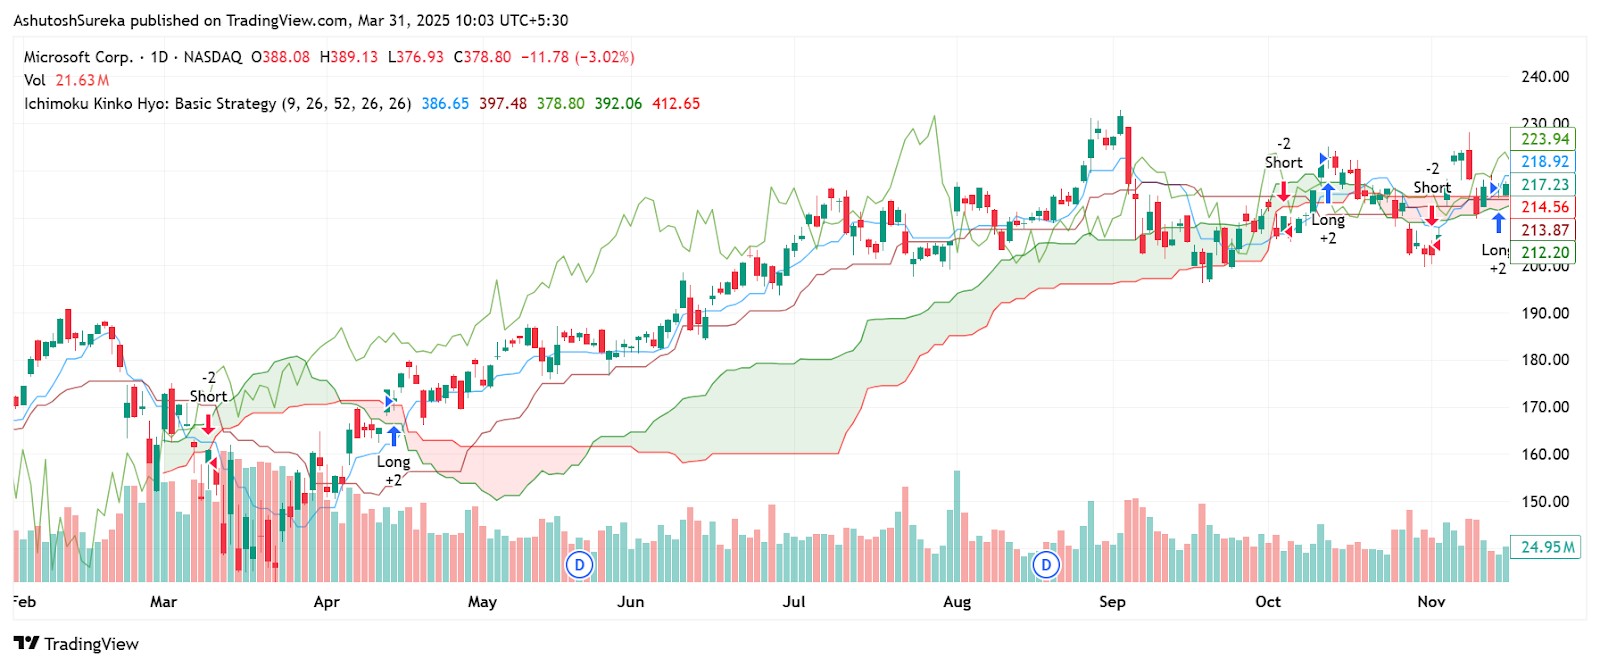
Ichimoku Kinko Hyo is a powerful all-in-one indicator that shows trend direction, strength, and dynamic support and resistance through its unique cloud structure. It helps traders spot momentum shifts early by analyzing how price interacts with its components like the cloud, Tenkan Kijun lines, and Chikou Span.
A lot of traders get confused by the mess on the screen the first time they see Ichimoku. But once you get it, you realize that everything in this indicator is actually built in to keep things simple. What makes Ichimoku really work is not just the lines but how they play off each other. The cloud is not just support or resistance. It is a way to see when buyers and sellers are balanced or off balance. When you start watching how price reacts around the cloud and how the leading spans shift you can start spotting turning points while others are still waiting. In this article, we will take a deep dive specifically in the Ichimoku Kinko Hyo indicators, looking at its logic, strategies, advantages, as well as limitations.
Introduction to Ichimoku Kinko Hyo
Ichimoku Kinko Hyo is one of the few indicators that gives you the full picture on a single chart. It shows where the trend is going, how strong it is, and where possible support and resistance might show up — all without needing to switch tools or add multiple indicators.
Why traders use it
Covers everything in one view You can see trend direction, price momentum, and key zones at the same time.
Clear visual layout The cloud makes it easy to spot when price is in a trend or just moving sideways.
Parts of it are forward-looking Unlike most indicators that only follow price, Ichimoku actually projects parts of the chart into the future.
Fun fact: Ichimoku Kinko Hyo means one glance equilibrium chart — which fits perfectly. The idea is to give you all the information you need in one quick look.
Origin and development of Ichimoku Kinko Hyo
The Ichimoku system was created by a Japanese journalist who wanted something better than basic price charts. He wanted to build a tool that could help traders make decisions quickly without juggling multiple indicators.
The person behind it
Goichi Hosoda A financial writer in Japan who developed the system over many years. He used the pen name Ichimoku Sanjin.
Tested over two decades Before sharing it with the public, he and his team tested it thoroughly on paper charts.
Understanding the components of Ichimoku Kinko Hyo
Ichimoku Kinko Hyo is made up of five key components. Each one plays a specific role, but together they give a full picture of market direction, momentum, and key levels. Once you understand what each line means, reading an Ichimoku chart becomes much easier — even if it looks complex at first.
Tenkan sen (conversion line)
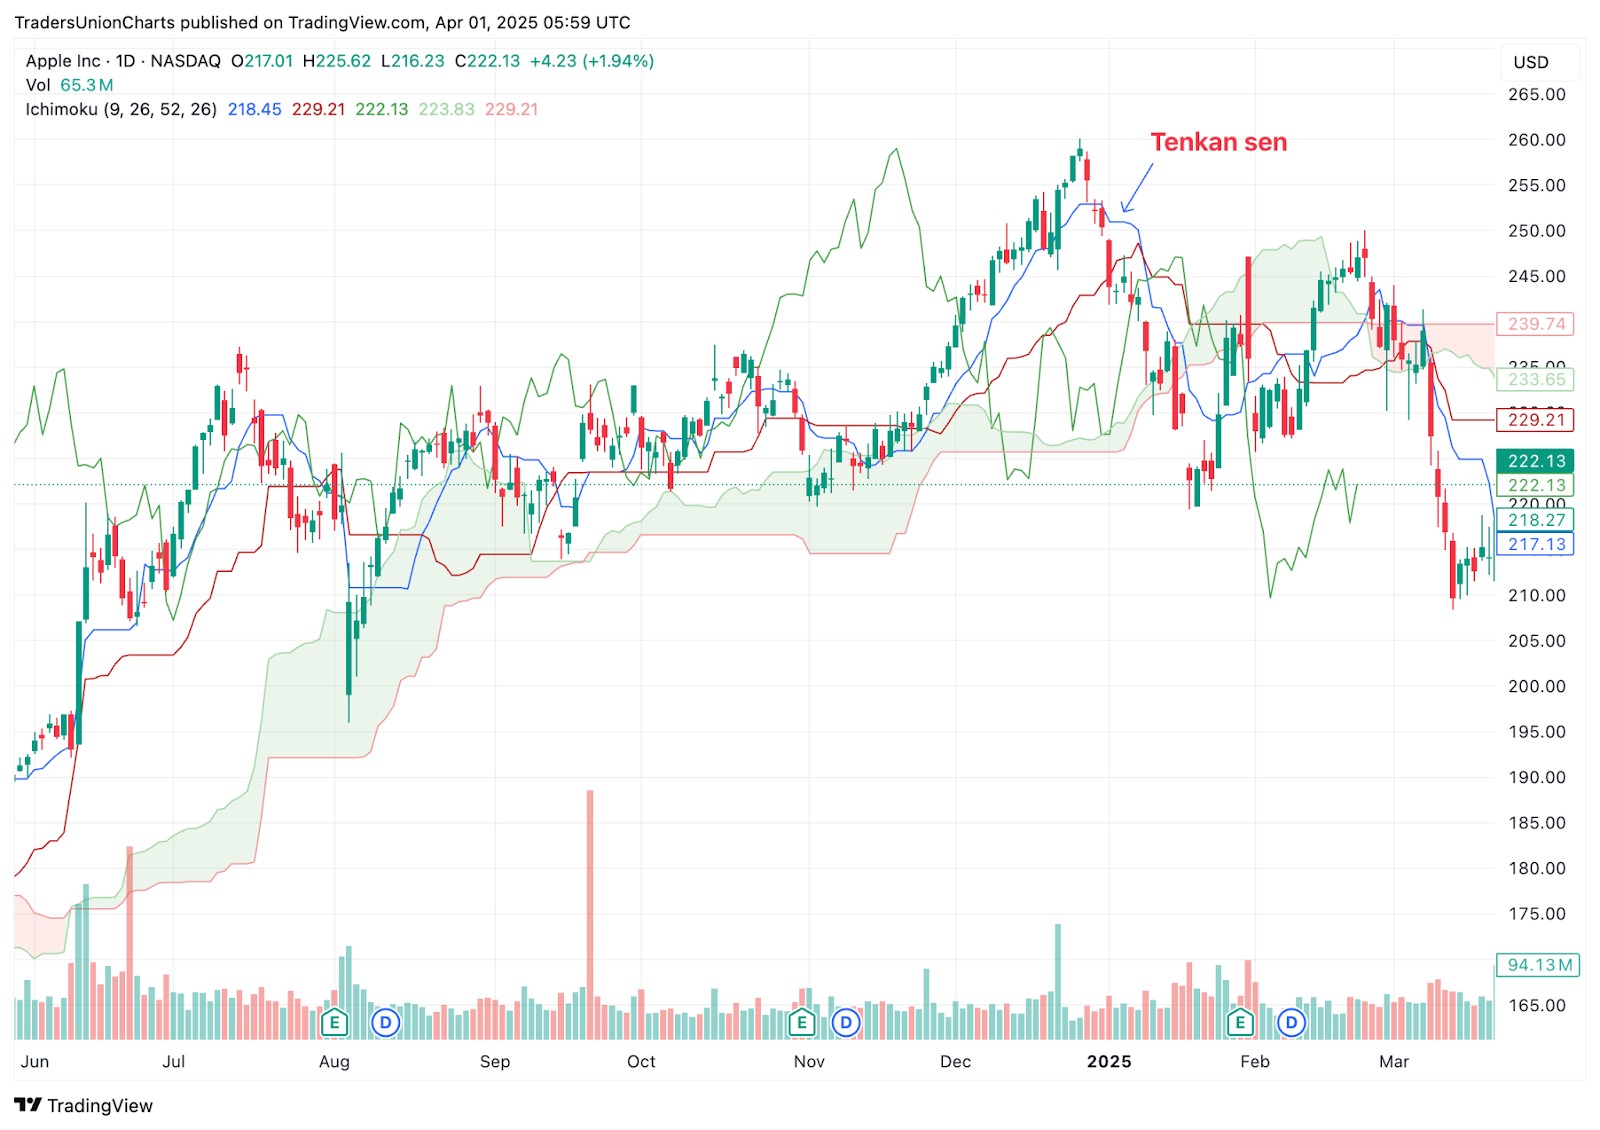
This is the fastest-moving line in the Ichimoku system and often acts as a short-term trend guide.
What it shows
Calculated by averaging the highest high and lowest low over the past 9 periods;
Reacts quickly to price changes;
Useful for spotting short-term trend shifts or minor support and resistance levels.
How traders use it
When price is above the Tenkan sen, the short-term trend is considered bullish;
If price crosses below it, it could be a signal of short-term weakness;
Crosses between Tenkan sen and Kijun sen can also act as early signals.
Kijun sen (base line)
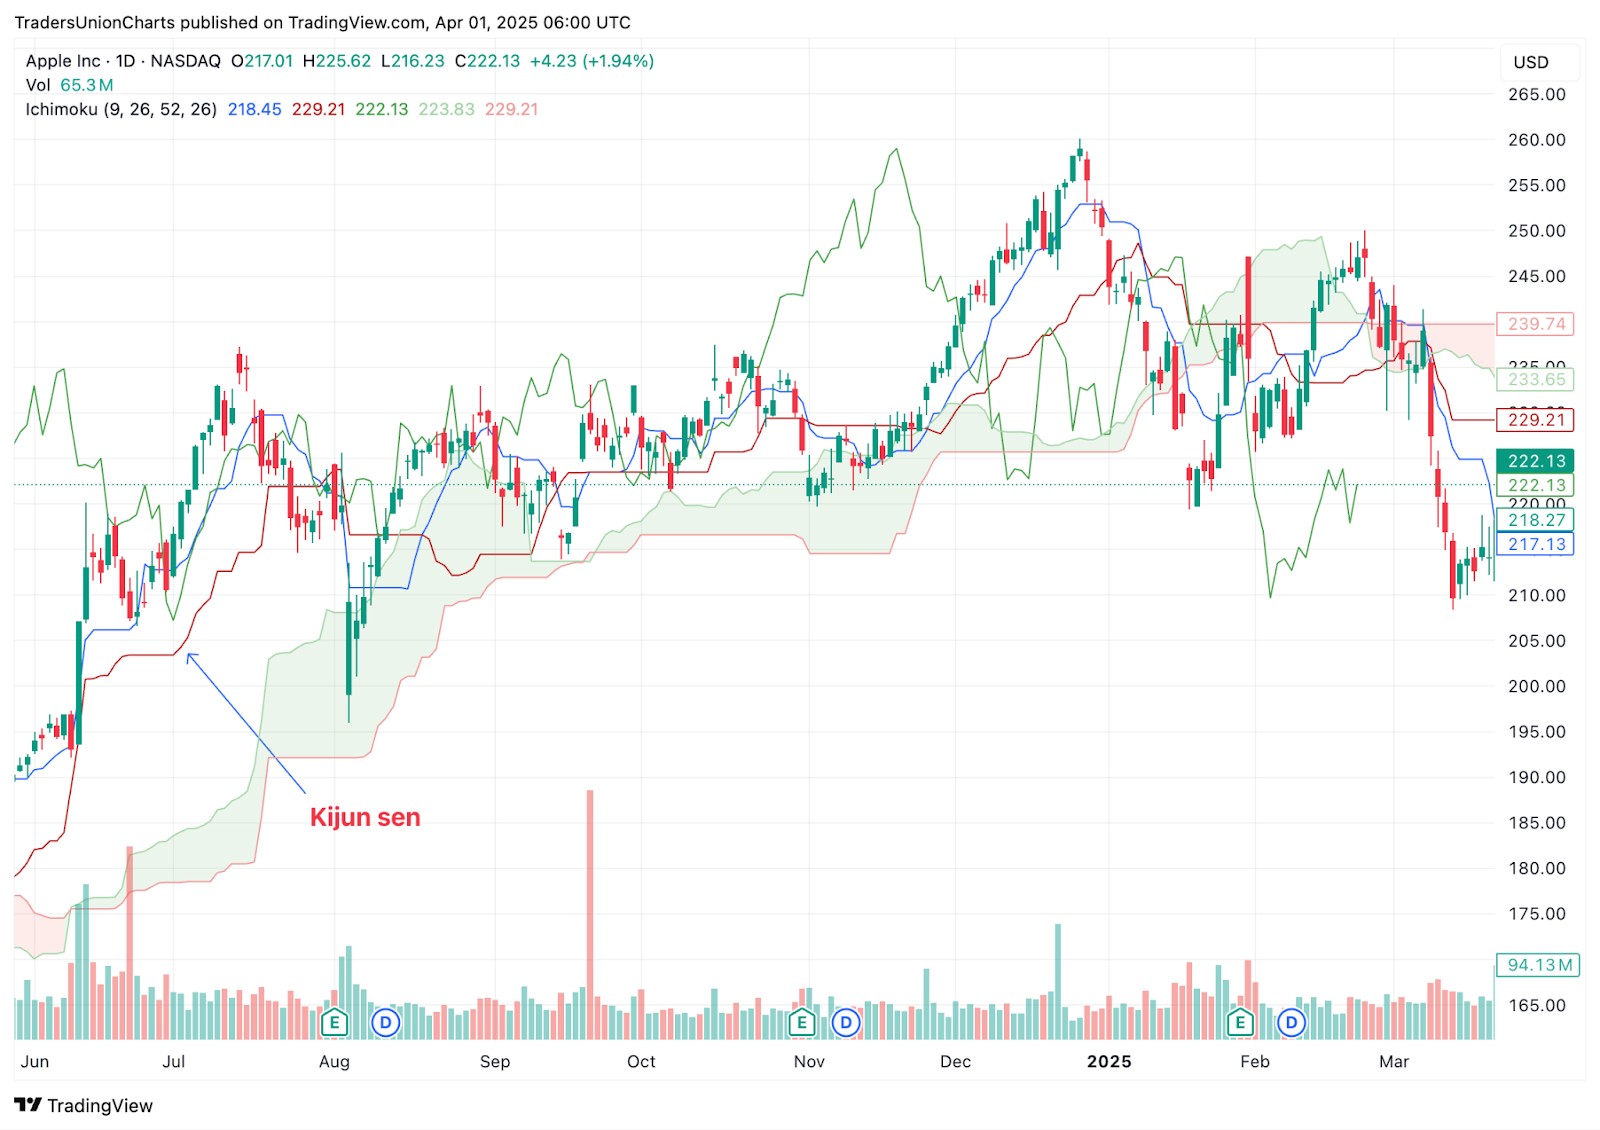
The Kijun sen moves slower than the Tenkan sen and reflects medium-term trend direction.
What it shows
Calculated using the highest high and lowest low over the past 26 periods;
Smoother than the Tenkan sen, making it more reliable in identifying trends;
Often used as a trailing stop or confirmation line.
How traders use it
When price is above the Kijun sen, the overall direction is considered up;
If price falls below it, it may suggest a trend reversal or pullback;
Crosses between Tenkan and Kijun lines are considered bullish or bearish signals, depending on the direction.
Senkou Span A and B (leading spans)
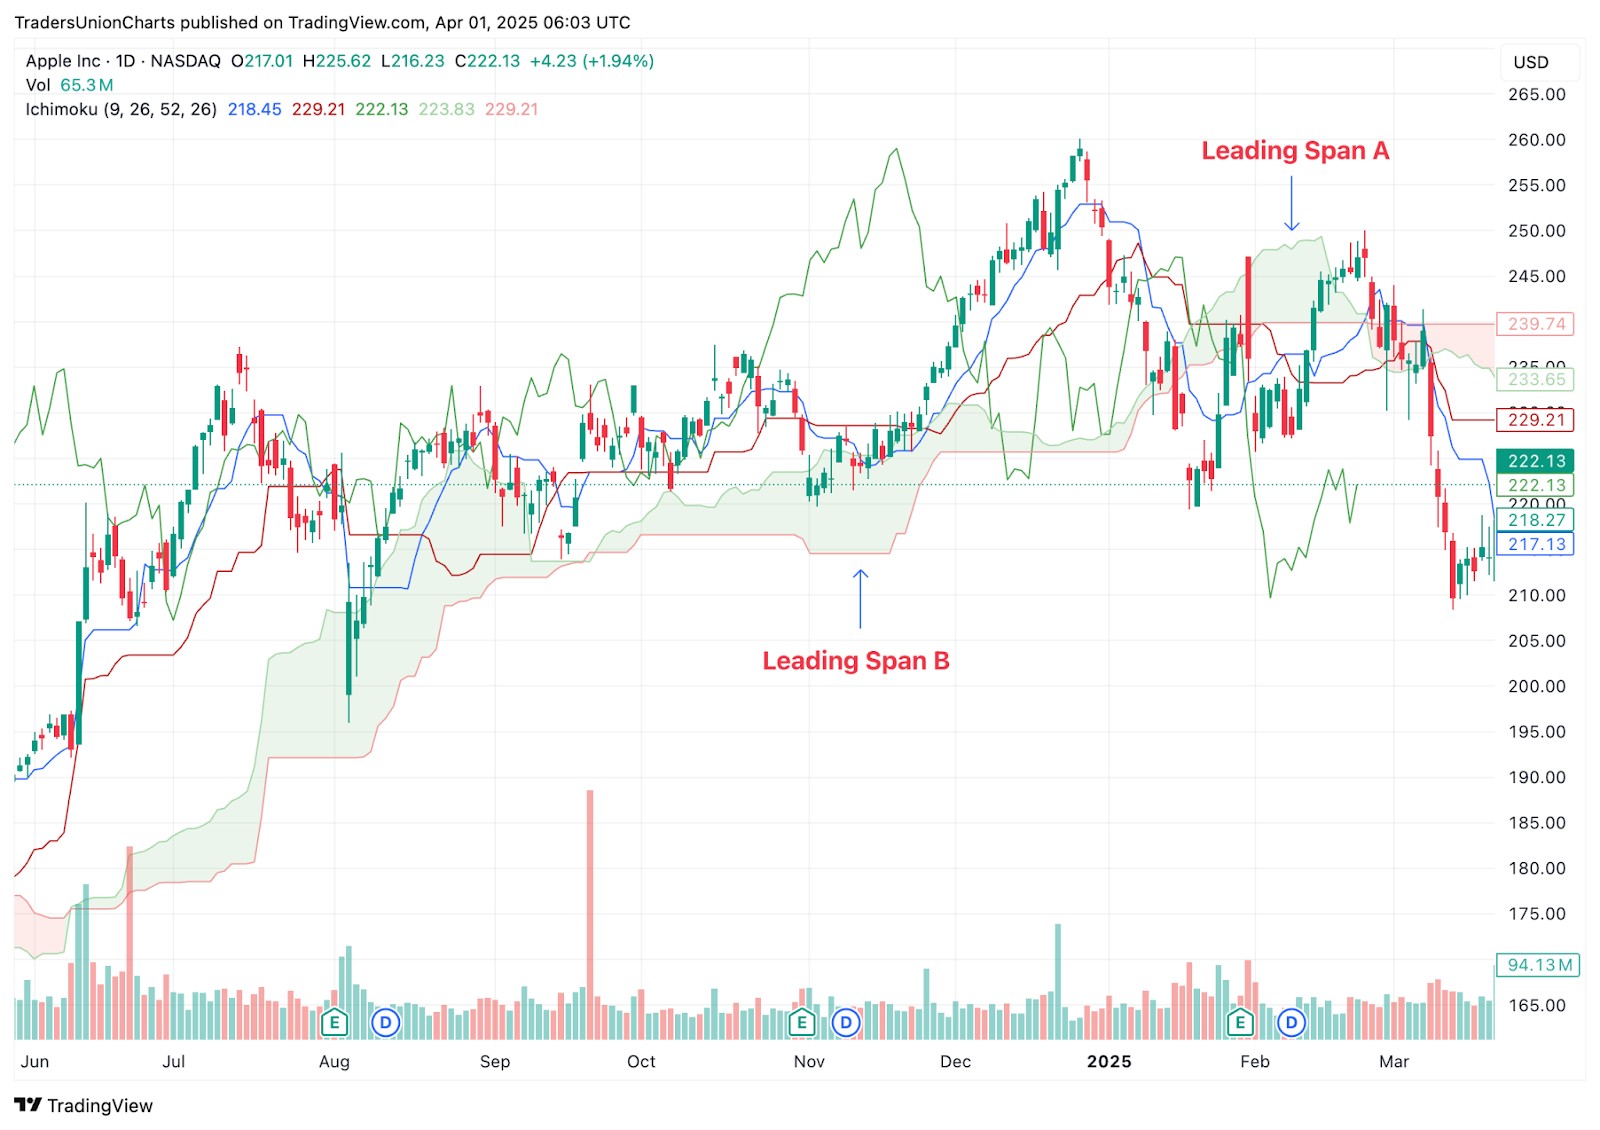
These two lines create the Ichimoku cloud, or Kumo, and are projected forward on the chart to help identify future support and resistance.
Senkou Span A
Average of the Tenkan sen and Kijun sen;
Plotted 26 periods ahead of the current price;
It forms the faster edge of the cloud.
Senkou Span B
Average of the highest high and lowest low over the past 52 periods;
Also plotted 26 periods ahead;
Moves slower and forms the opposite edge of the cloud.
What they show
The space between Span A and Span B creates the Kumo;
The thicker the cloud, the stronger the support or resistance zone.
Kumo (cloud)
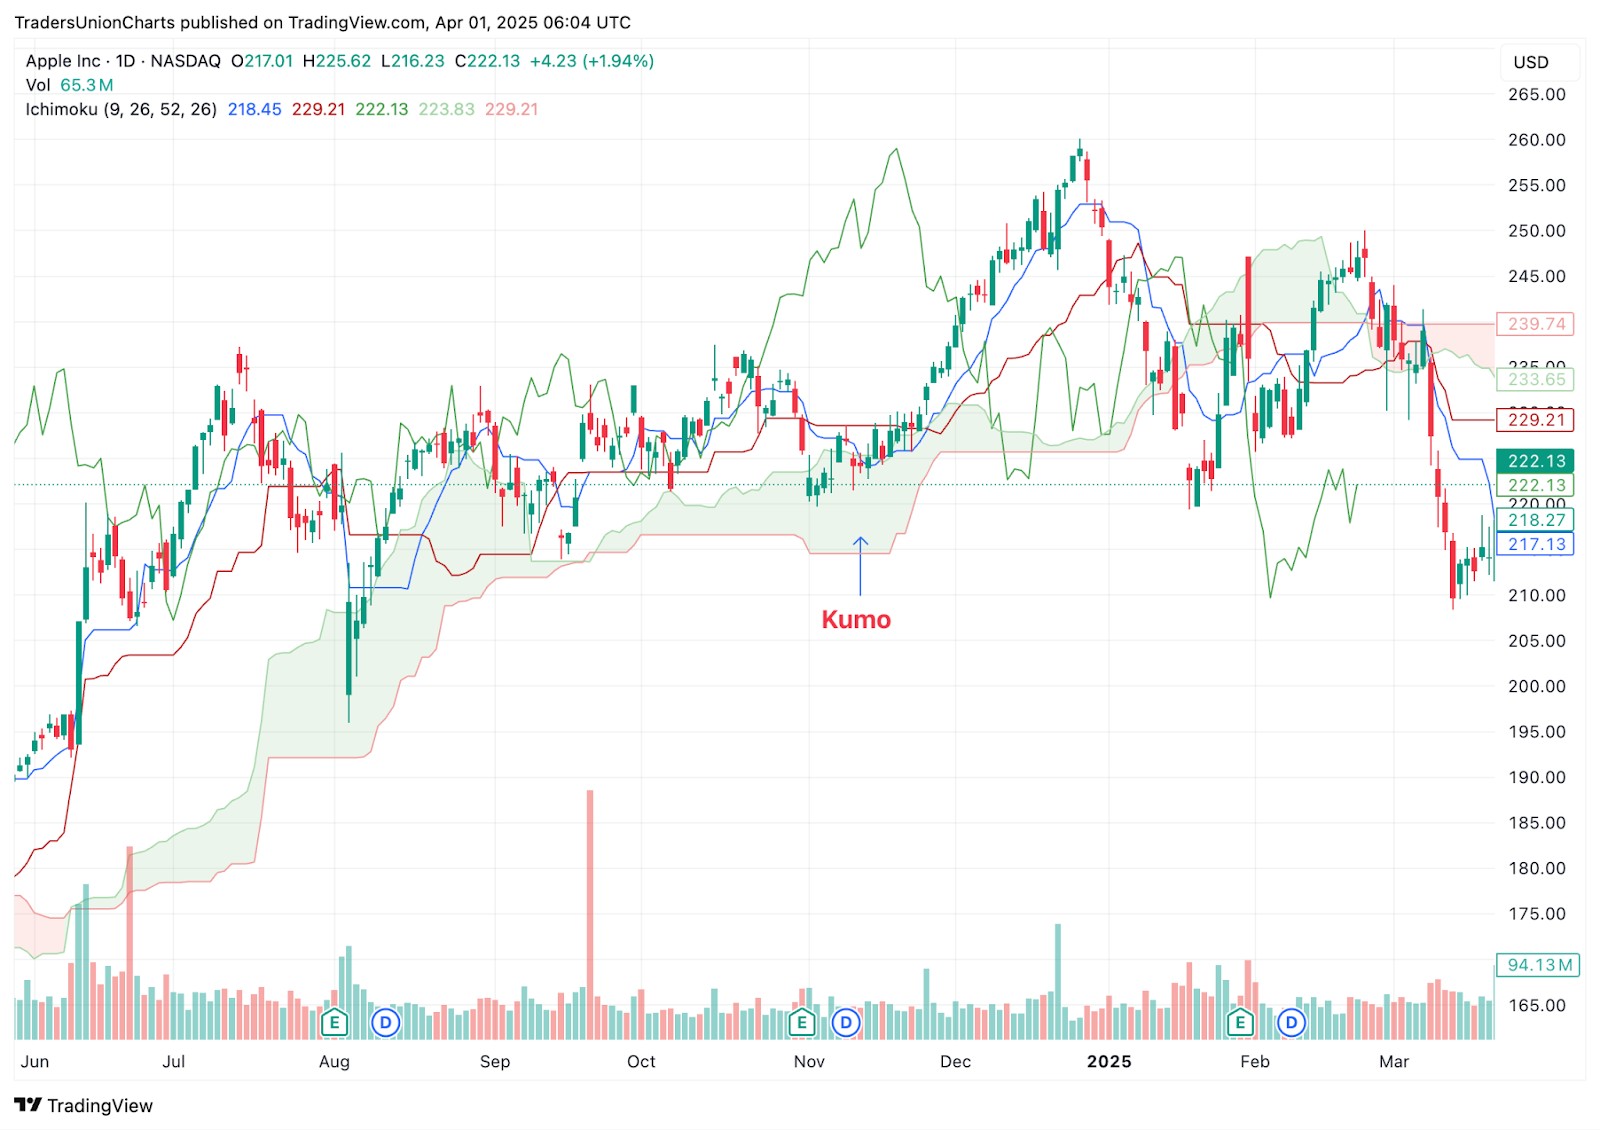
The cloud is the most visually distinct part of the Ichimoku system and helps highlight key market structure.
What it shows
Acts as dynamic support and resistance;
When price is above the cloud, the trend is bullish;
When price is below the cloud, the trend is bearish;
If price is inside the cloud, the market is in a zone of uncertainty or consolidation.
Why it matters
The thickness of the cloud can show how strong a trend is;
Breakouts above or below the cloud often signal a possible trend continuation.
Chikou Span (lagging span)
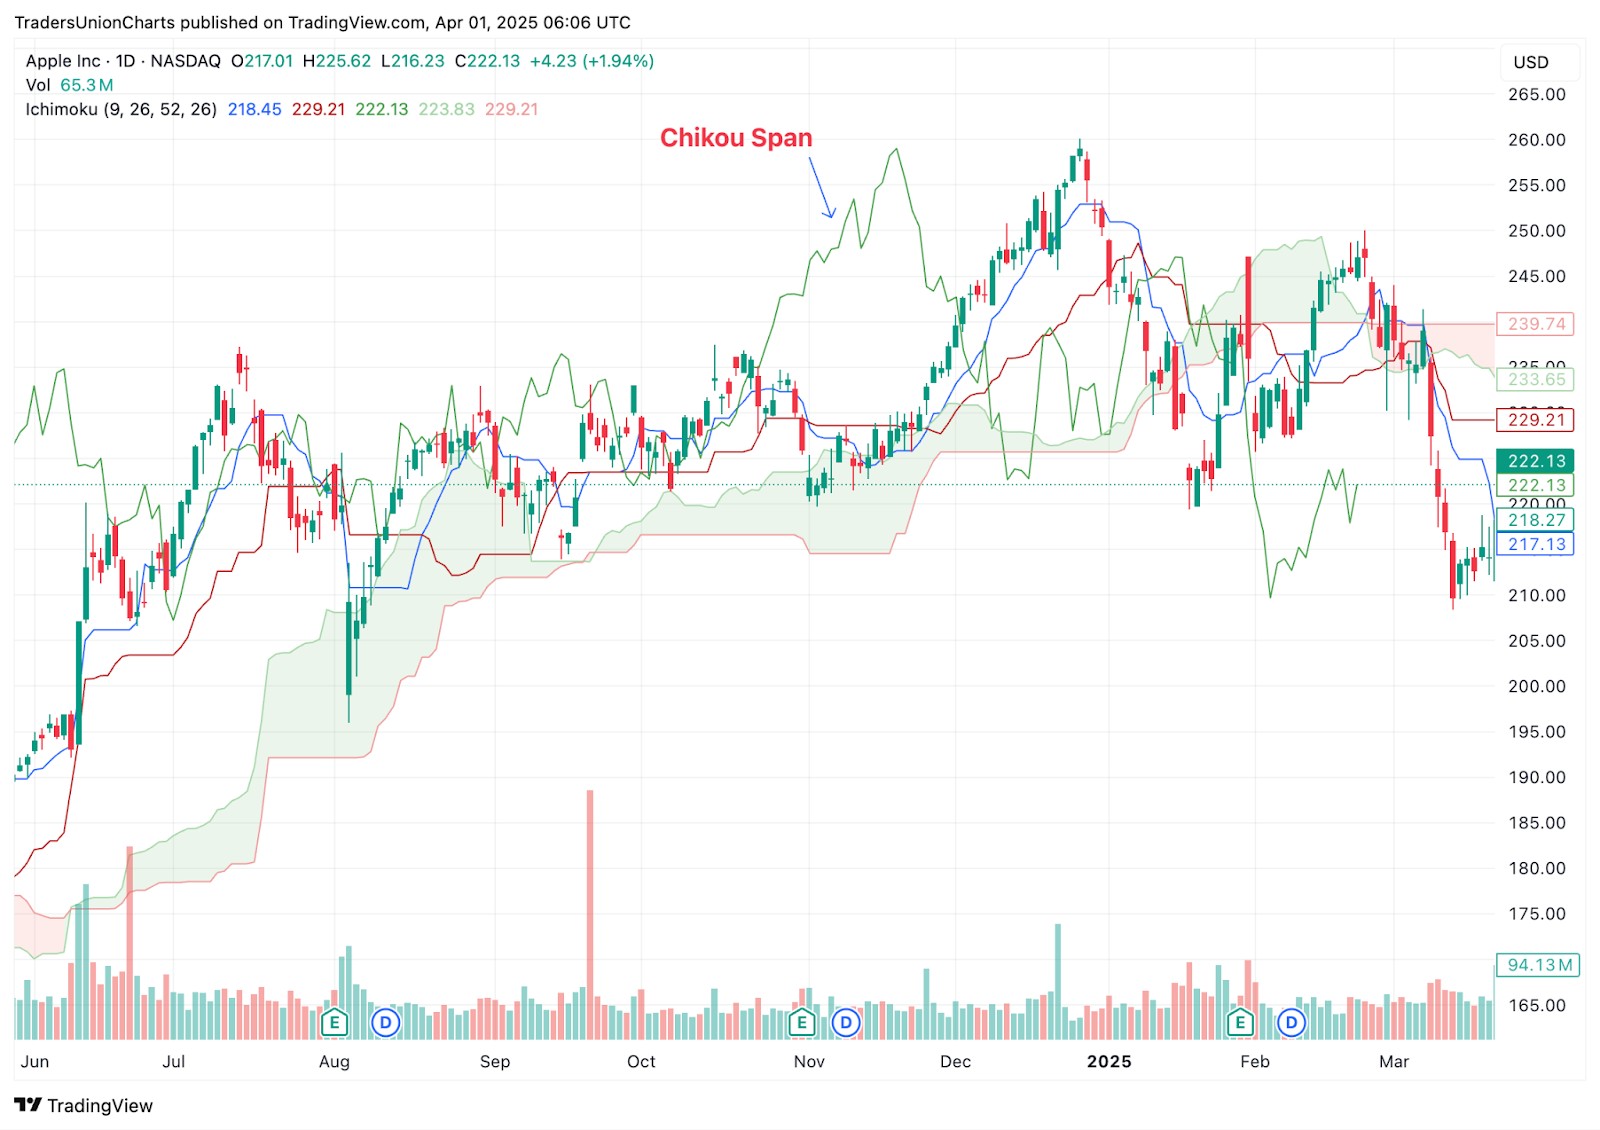
This is the only backward-looking part of the Ichimoku system, but it plays an important role in confirming signals.
What it shows
It is today’s closing price plotted 26 periods back;
Helps traders see how today’s price compares to past price action;
Acts as a secondary confirmation tool.
How traders use it
If the Chikou Span is above past price, it confirms a bullish setup;
If it is below, it adds weight to a bearish signal;
Helps filter out weak signals when used with other Ichimoku elements.
How to set up Ichimoku Kinko Hyo
Ichimoku Kinko Hyo is available by default on nearly every major charting platform. Once added to your chart, it gives you a full view of trend direction, momentum, and support and resistance zones. The setup process is straightforward, and a few small tweaks can make the indicator much more effective depending on your trading style.
Access the indicator
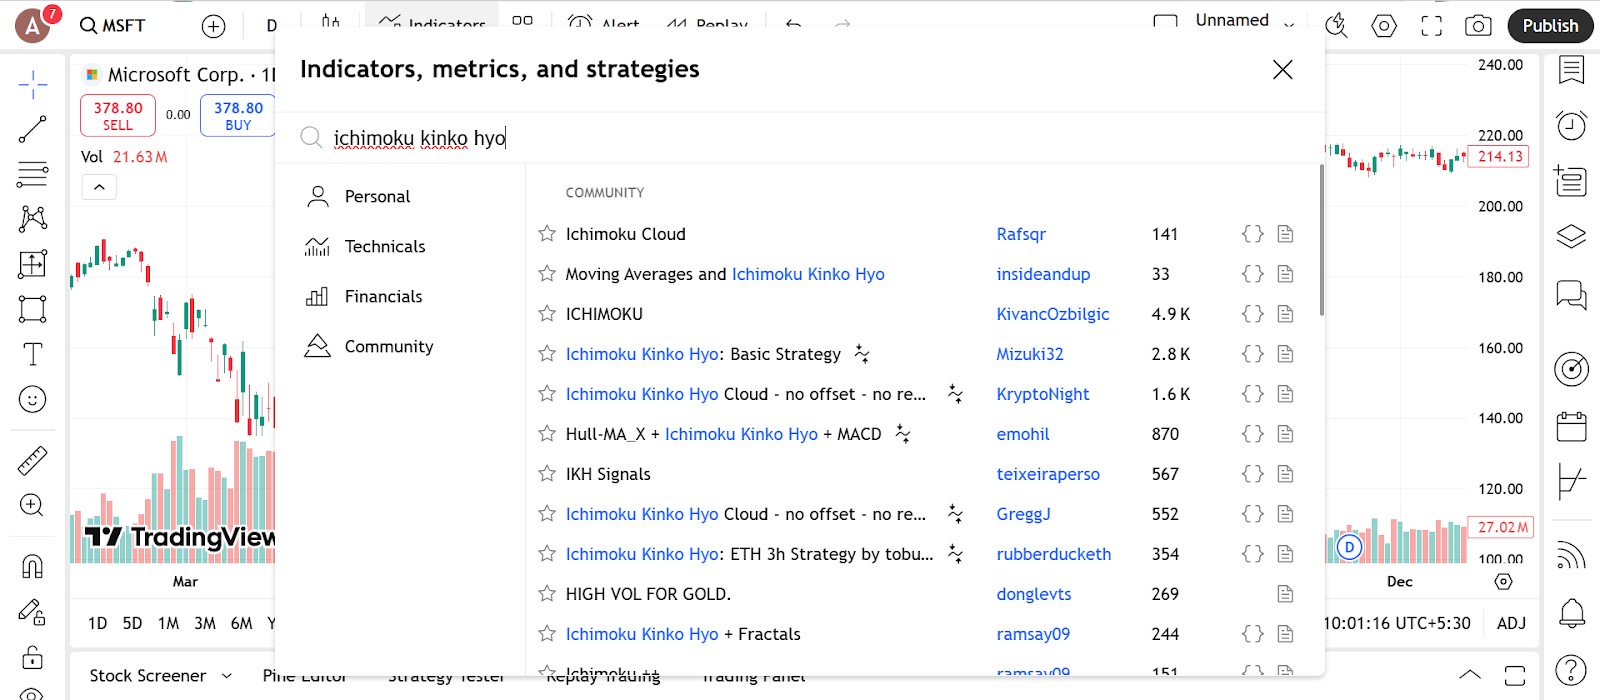
Getting Ichimoku on your chart is a quick process and does not require any downloads or add-ons.
Where to find it
Open your trading platform and head to the indicators section;
Search for Ichimoku or Ichimoku Cloud depending on the platform;
Click to apply it — all five components will appear together by default.
Platforms that support it
Found on TradingView, MetaTrader, ThinkorSwim, NinjaTrader, and nearly all major platforms;
No extra configuration needed to get started.
Tips before applying
Make sure your chart has enough historical candles since Ichimoku projects parts of its structure forward and backward;
Use a clean chart background so the lines and cloud are easier to read.
Configure the parameters
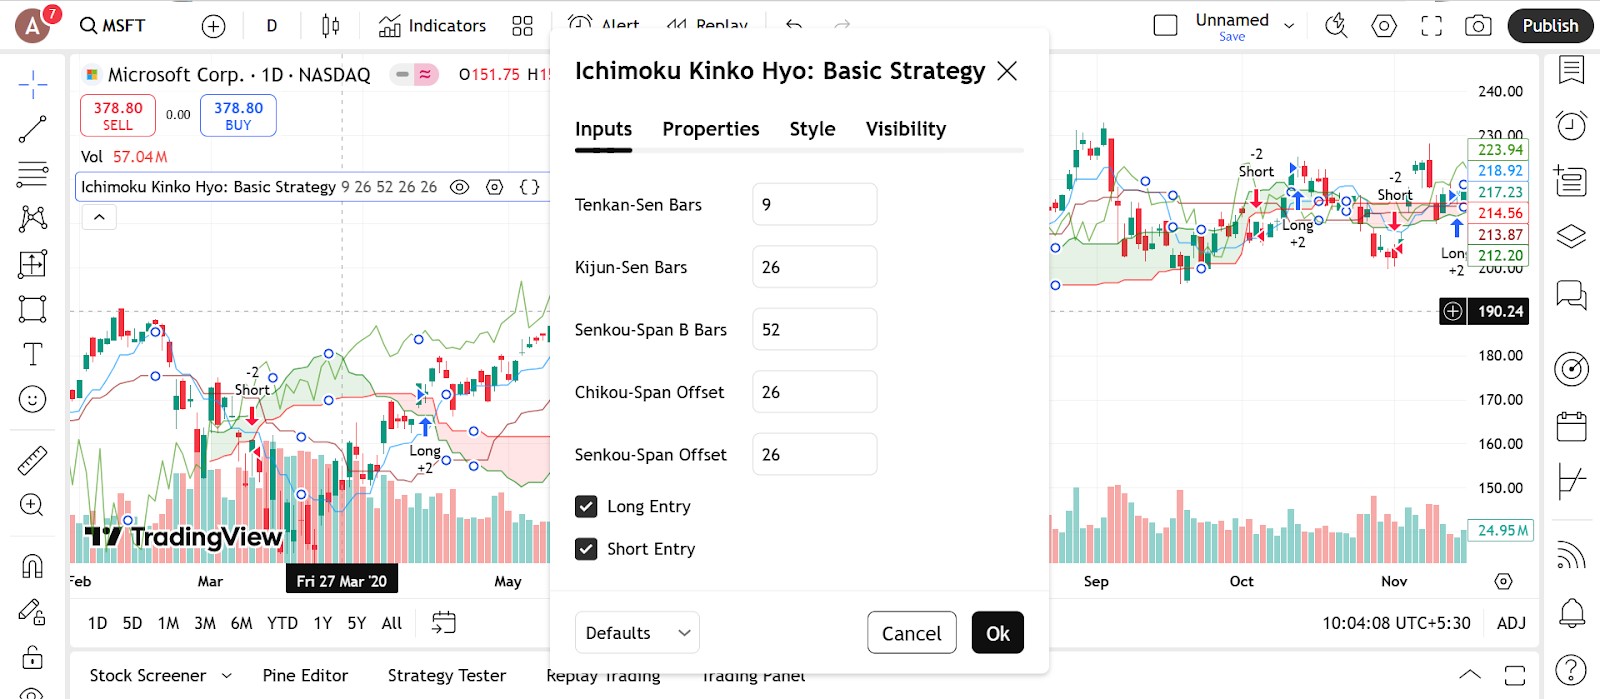
By default, Ichimoku comes with the traditional settings 9, 26, 52 which were designed for Japanese markets with a six-day trading week. These values are still widely used and effective, but they can be adjusted based on your timeframe and trading style.
Default settings
Tenkan period is 9;
Kijun period is 26;
Senkou Span B period is 52.
These settings work well for swing trading and longer timeframes.
When to adjust
Shorter time frames For day trading or scalping, you can try settings like 7, 22, 44 to make the indicator respond more quickly to price.
Longer-term trading Stick with the default or even go slower like 10, 30, 60 if you are working with weekly charts or multi-day setups.
Visual customization
Change line colors to make it easier to read — for example, red for Kijun sen, blue for Tenkan sen, and a transparent fill for the cloud if you want a cleaner look;
Increase line thickness slightly for better visibility, especially if your chart background is dark;
Enable or disable individual components if needed — some traders choose to hide the Chikou Span or cloud shading for simplicity.
Trading strategies using Ichimoku Kinko Hyo
Ichimoku Kinko Hyo offers a complete system for identifying trends, finding entry signals, and managing trades. Because it includes multiple components — not just one line or oscillator — it can be used on its own for both trade setups and exits. Below are several reliable strategies that traders often use with Ichimoku.
Kumo breakout strategy
This is one of the most popular strategies using Ichimoku — trading breakouts above or below the cloud.
How it works
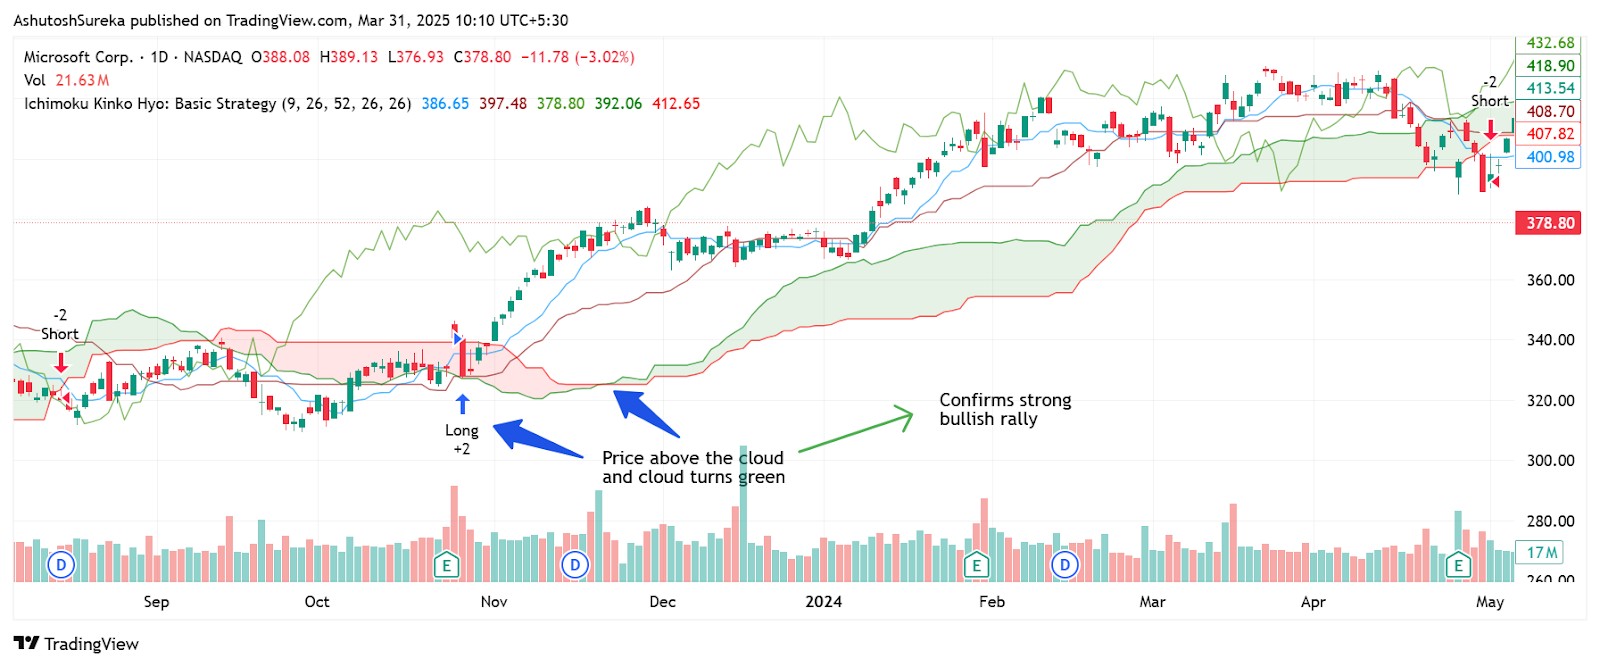
Bullish breakout When price breaks above the cloud and the cloud is green, it signals strong bullish momentum.
Bearish breakout When price breaks below the cloud and the cloud is red, it suggests bearish momentum.
Check for confirmation For stronger setups, confirm that the Chikou Span is also above price in bullish setups or below price in bearish ones.
Entry and exit
Enter when price closes cleanly above or below the cloud;
Exit if price moves back inside the cloud or if the Tenkan sen crosses against your position;
Tenkan Kijun crossover strategy
This strategy uses the crossover between the Tenkan sen and Kijun sen to time entries.
How it works
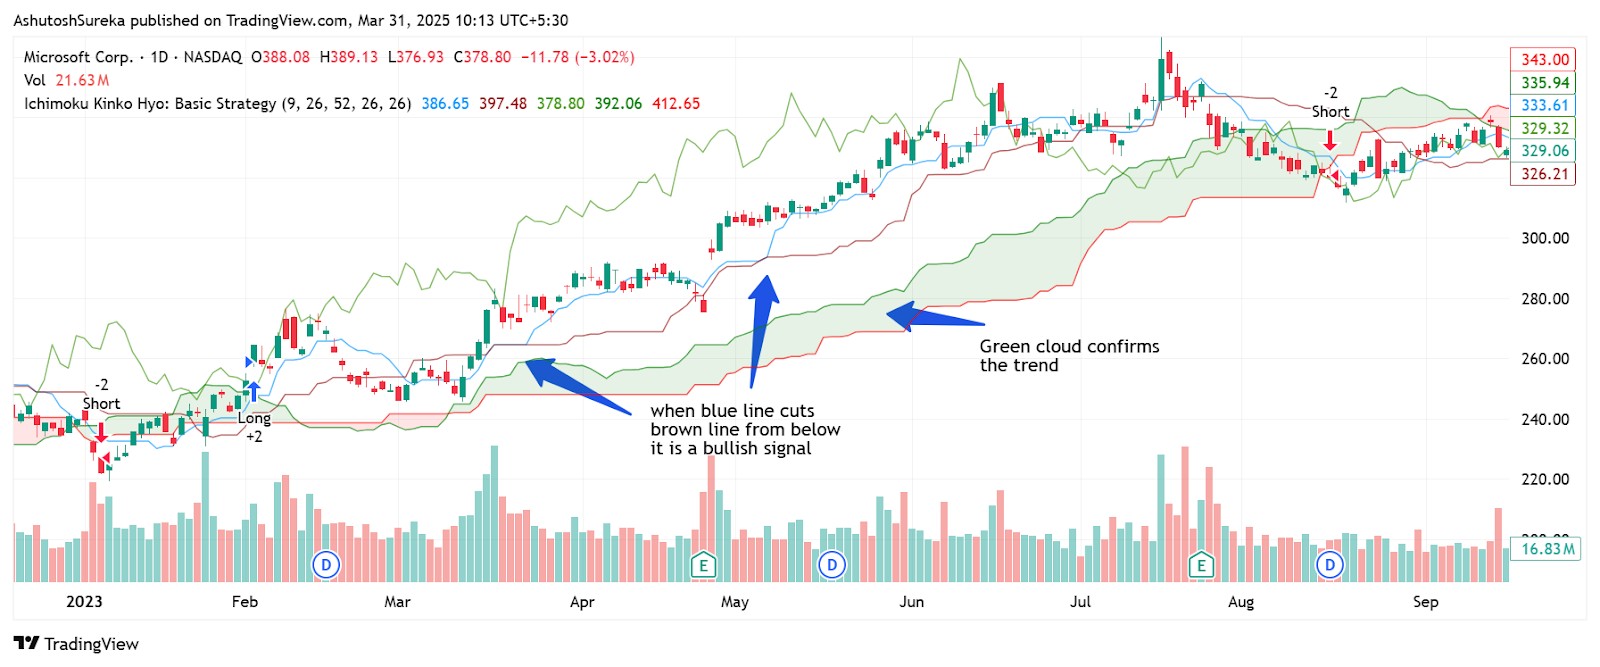
Bullish signal When the Tenkan sen crosses above the Kijun sen, it suggests upward momentum is building.
Bearish signal When the Tenkan sen crosses below the Kijun sen, it suggests bearish pressure.
How to confirm
Look for the crossover to happen above the cloud for bullish trades or below the cloud for bearish trades;
Use the Chikou Span to confirm that price is aligned with the trend.
Managing the trade
Use the Kijun sen or the edge of the cloud as a trailing stop;
Consider exiting if price crosses back through the Kijun line.
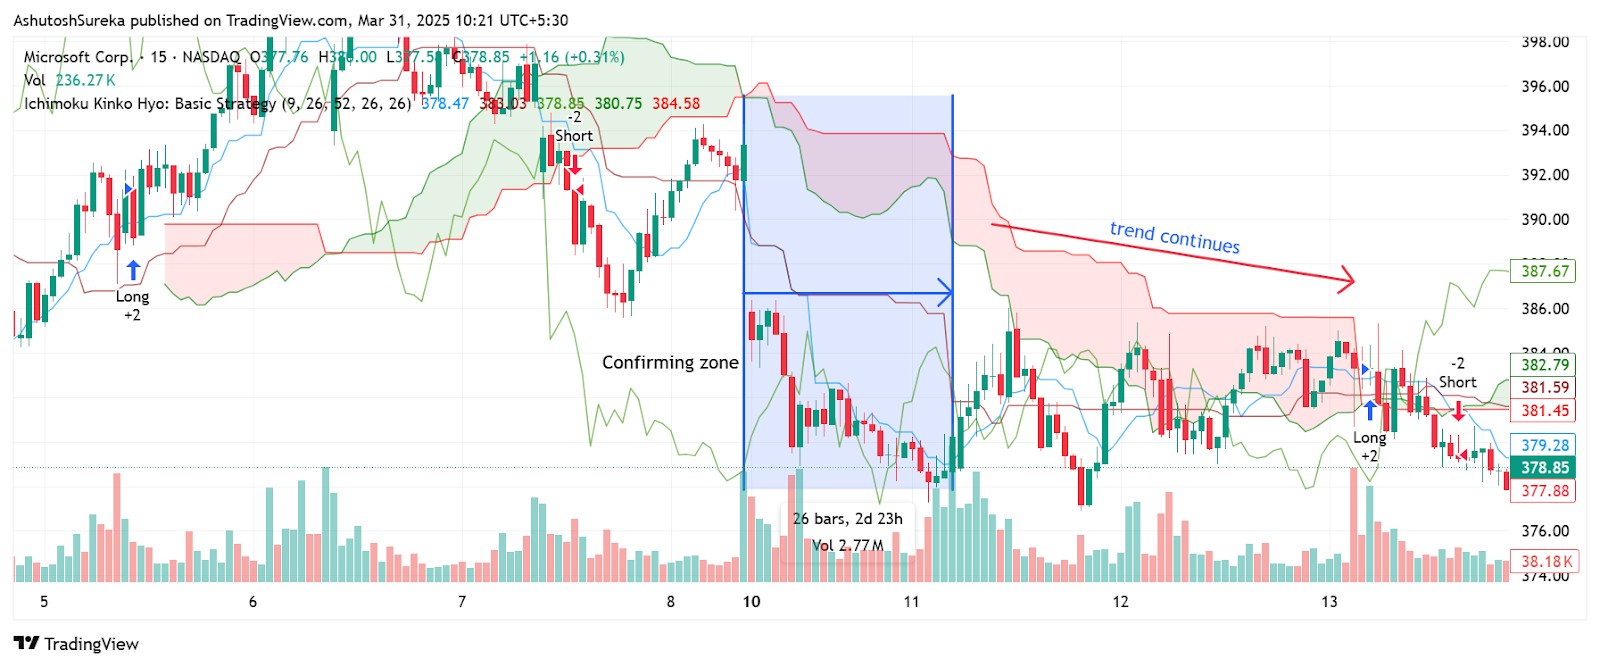
Chikou Span confirmation strategy
The Chikou Span is often overlooked but can serve as a filter to confirm or reject trades.
How it works
Bullish setups Chikou Span should be above the price from 26 periods ago.
Bearish setups Chikou Span should be below the price from 26 periods ago.
Why it matters
It confirms that today’s price has cleared past resistance or support;
It keeps you from entering trades when current price is still stuck inside a past consolidation zone.
If your trading strategy requires the use of many technical indicators, using a broker that supports TradingView, MT5, or cTrader can make your life easier. These tools provide access to a wide range of technical tools, covering almost all the strategies you can think of. In the table below, we have presented the top brokers with access to the abovementioned platforms. You can compare them and choose the best one for yourself:
| zForex | Plus500 | Trading.com USA | OANDA | FOREX.com | |
|---|---|---|---|---|---|
|
Tradable assets |
80 | 2800 | 69 | 129 | 5500 |
|
Min. deposit, $ |
10 | 100 | 50 | No | 100 |
|
Max. leverage |
1:1000 | 1:300 | 1:50 | 1:200 | 1:50 |
|
TradingView |
No | Yes | Yes | Yes | Yes |
|
MT5 |
Yes | No | Yes | Yes | Yes |
|
cTrader |
No | No | No | No | No |
|
TU overall score |
7.89 | 7.52 | 6.81 | 6.8 | 6.74 |
|
Open an account |
Go to broker Your capital is at risk.
|
Go to broker 80% of retail CFD accounts lose money. |
Go to broker Your capital is at risk. |
Go to broker Your capital is at risk. |
Study review |
Why trust us
15+ years of independent market analysis
140+ evaluation criteria, reviewed by 50+ experts
Data-driven reviews of 200+ platforms, updated regularly
20+ industry awards & a wide network of global media partners
Learn more about our methodology and editorial policies.


Advantages and limitations of Ichimoku Kinko Hyo
Ichimoku Kinko Hyo is one of the most complete indicators available. It can help you spot trends, time your entries, and manage exits — all on one chart. But it is also visually complex and not ideal for every market or strategy. Here’s a look at where Ichimoku stands out and where it might fall short.
Advantages of Ichimoku Kinko Hyo
Traders who use Ichimoku often rely on it as a stand-alone system because it covers so many aspects of price action in one view.
All-in-one structure
Combines trend direction, momentum, and support resistance levels;
No need to layer multiple indicators on top of your chart;
Great for traders who prefer a simple but complete system.
Forward and backward visibility
Projects parts of the indicator into the future using the cloud;
Also looks back 26 candles to give context to current price;
Helps spot trend strength and potential reversal zones.
Clear trade signals
Provides structured entry and exit signals through crossovers and breakouts;
Cloud thickness helps filter out weak trades;
Easy to build repeatable strategies using the indicator alone.
Useful across timeframes
Works on intraday charts as well as daily or weekly charts;
Traders in Forex, stocks, and crypto all apply it in different markets;
Settings can be adjusted to fit your trading style or pace.
Limitations of Ichimoku Kinko Hyo
Despite its strengths, Ichimoku is not perfect. It requires a learning curve, and in some situations, it may give mixed signals or lag behind price action.
Can be visually overwhelming
The five lines and cloud shading can clutter the chart;
May feel too busy for traders who prefer clean price action;
Some users turn off components like the Chikou Span or cloud fill for clarity.
Not ideal for sideways markets
In choppy or flat conditions, Ichimoku may give false breakouts or whipsaws;
Works best in clearly trending environments;
May cause confusion when price moves inside the cloud.
Lagging nature
Some signals, especially crossovers and cloud breaks, may come after the move has already started;
Traders looking for early entries might find it too slow without additional confirmation tools.
Requires time to learn
Understanding all five components takes effort;
Traders often need to backtest and practice before using it in live setups;
Not always beginner-friendly despite its power.
Best way to use Ichimoku Kinko Hyo

Most people use Ichimoku like a yes or no switch. If the price is above the cloud they go long. If it is below they go short. But the real value is in watching how the cloud shifts. When the top line starts flattening and the bottom line starts creeping closer that is your early warning that the trend is running out of gas. Most beginners do not catch this because they are just focused on price. But those slow changes in the cloud show pressure building or fading before price makes its move.
Another part people ignore is the Chikou Span. They see it as just some line that trails behind. But it actually gives you perspective. Look back 26 periods and ask if the line is above the candles or stuck in them. If it is above and floating with nothing in the way the move has open ground. But if it is stuck in old price noise the market is not trending. It is in a traffic jam. That small shift in how you read it completely changes how you trade it. Ichimoku is not about reacting fast. It is about paying attention to what price is moving through and when the path is finally clear.
Conclusion
Mastering the Ichimoku Kinko Hyo indicator provides traders with a holistic perspective of market trends, making it an indispensable tool for informed decision-making. By understanding how the cloud (Kumo) and key lines such as the Tenkan-sen and Kijun-sen interact, traders can confidently identify robust entry and exit signals. For instance, a price breaking above the Kumo often suggests a bullish trend, while bullish crossovers of the Tenkan-sen and Kijun-sen can serve as early momentum indicators. Ultimately, integrating the Ichimoku Kinko Hyo into your trading strategy empowers you to navigate market complexities with clarity and conviction, transforming potential uncertainty into actionable opportunity.
FAQs
How does the Ichimoku Kinko Hyo cloud thickness influence trading decisions?
Can the Ichimoku Kinko Hyo indicator be used as a stand-alone trading system?
What are the main components of the Ichimoku Kinko Hyo, and what roles do they play?
How can traders customize Ichimoku Kinko Hyo settings for different trading styles?
Editors' Top Picks and Insights

BitMEX is shutting down: Why Trump could not save the exchange

Do governments need crypto workers?

Brent nears $100: Why oil prices are rising

Gram Wallet launch: Can Telegram bring crypto to the masses?

AI without limits: How dangerous are neural networks?

Worldcoin on Wall Street: From iris scans to ETF
Related Articles
Team that worked on the article
Mikhail Vnuchkov joined Traders Union as an author in 2020. He began his professional career as a journalist-observer at a small online financial publication, where he covered global economic events and discussed their impact on the segment of financial investment, including investor income.
Dan Blystone began his trading career in 1998 as an arbitrage clerk on the floor of the Chicago Mercantile Exchange (CME). He later traded bond and Eurex futures at proprietary firms such as Altea Trading, gaining valuable experience in high-frequency trading and risk management.
Chinmay Soni is a financial analyst with more than 5 years of experience in working with stocks, Forex, derivatives, and other assets. As a founder of a boutique research firm and an active researcher, he covers various industries and fields, providing insights backed by statistical data.
A Trailing Stop Order is a type of order that automatically adjusts the stop-loss level as the market price moves in a favorable direction, helping to protect profits.
Index in trading is the measure of the performance of a group of stocks, which can include the assets and securities in it.
Swing trading is a trading strategy that involves holding positions in financial assets, such as stocks or forex, for several days to weeks, aiming to profit from short- to medium-term price swings or "swings" in the market. Swing traders typically use technical and fundamental analysis to identify potential entry and exit points.
Forex indicators are tools used by traders to analyze market data, often based on technical and/or fundamental factors, to make informed trading decisions.
Xetra is a German Stock Exchange trading system that the Frankfurt Stock Exchange operates. Deutsche Börse is the parent company of the Frankfurt Stock Exchange.

-
 Afghanistan
-
 Albania
-
 Algeria
-
 Angola
-
 Argentina
-
 Armenia
-
 Australia
-
 Austria
-
 Azerbaijan
-
 Bahamas
-
 Bahrain
-
 Bangladesh
-
 Belarus
-
 Belgium
-
 Bolivia
-
 Botswana
-
 Brazil
-
 Brunei
-
 Bulgaria
-
 Cambodia
-
 Cameroon
-
 Canada
-
 Chile
Chile
-
 China
China
-
 Colombia
-
 Congo
Congo
-
 Costa Rica
-
 Cote d'Ivoire
-
 Croatia
-
 Cuba
Cuba
-
 Cyprus
-
 Czechia
-
 DR Congo
-
 Denmark
-
 Dominican Republic
-
 Ecuador
-
 Egypt
Egypt
-
 El Salvador
-
 Estonia
-
 Eswatini
-
 Ethiopia
-
 Finland
-
 France
-
 Georgia
-
 Germany
-
 Ghana
Ghana
-
 Greece
-
 Haiti
Haiti
-
 Hong Kong
-
 Hungary
-
 India
India
-
 Indonesia
-
 Iran, Islamic republic
-
 Iraq
Iraq
-
 Ireland
-
 Israel
-
 Italy
Italy
-
 Jamaica
-
 Japan
Japan
-
 Jordan
-
 Kazakhstan
-
 Kenya
Kenya
-
 Korea
Korea
-
 Kuwait
-
 Kyrgyzstan
-
 Laos
Laos
-
 Latvia
-
 Lebanon
-
 Lesotho
-
 Libya
Libya
-
 Lithuania
-
 Luxembourg
-
 Madagascar
-
 Malaysia
-
 Malta
Malta
-
 Mauritius
-
 Mexico
-
 Moldova
-
 Mongolia
-
 Montenegro
-
 Morocco
-
 Mozambique
-
 Myanmar
-
 Namibia
-
 Nepal
Nepal
-
 Netherlands
-
 New Zealand
-
 Nigeria
-
 North Macedonia
-
 Norway
-
 Oman
Oman
-
 Pakistan
-
 Palestine
-
 Panama
-
 Papua New Guinea
-
 Paraguay
-
 Peru
Peru
-
 Philippines
-
 Poland
-
 Portugal
-
 Puerto Rico
-
 Qatar
Qatar
-
 Reunion
-
 Romania
-
 Rwanda
-
 Saudi Arabia
-
 Serbia
-
 Singapore
-
 Slovakia
-
 Slovenia
-
 Somalia
-
 South Africa
-
 Spain
Spain
-
 Sri Lanka
-
 Sweden
-
 Switzerland
-
 Syria
Syria
-
 Taiwan
-
 Tajikistan
-
 Tanzania
-
 Thailand
-
 Trinidad and Tobago
-
 Tunisia
-
 Turkey
-
 UAE
UAE
-
 Uganda
-
 Ukraine
-
 United Kingdom
-
United States
-
 Uruguay
-
 Uzbekistan
-
 Venezuela
-
 Vietnam
-
 Yemen
Yemen
-
 Zambia
-
 Zimbabwe
- Forex
- Crypto
