What is Trend Trading: A Full Guide for Beginners
If you are looking to enter the trading world, one of the first decisions you will need to make is which trading style best suits your goals and personality. Different trading systems require different levels of time commitment, risk tolerance, and patience, and choosing the wrong approach can make the learning process much more difficult.
One of the main differences between trading styles is the length of time positions are held. For example, day traders open and close positions within the same trading day, while position traders may hold trades for weeks, months, or even longer. Understanding these differences can help you choose a trading approach that aligns with your objectives and lifestyle.
What is trend trading?
Trend trading is the identification of the direction of a market’s momentum with technical indicators. A trend trader works by analyzing past and market movements, forecasting what will happen in the future, and making your trades based on the forecasts. When there is an upward movement in the market (uptrend), a trend trader would enter a long position; a purchase made with the expectation of value rising. Likewise, when there is a downward movement in the market (downtrend), a trend trader would enter a short position; selling a security to buy it later at a lower price.
When a price is moving in a particular direction it is called a trend. Therefore trend trading works by studying the market using several trend indicators, to identify the direction of a trade’s movement. While trend trading takes advantage of a trend, other trading systems (reversal trading) do the opposite by taking advantage of the change of a trend.
Advantages and disadvantages
Like every trading system, trend trading has both pros and cons. Here are some of the pros and cons:
| S/N | Pros | Cons |
|---|---|---|
1 | Ability to identify major trends from the beginning | Trend traders are prone to false breakouts |
2 | Entries and exits do not need to be exact | It requires that you closely follow trades to ensure you do not miss a trend |
3 | It is slow-paced and does not consume so much time | There is a tendency to get more losing trades than winning trades when compiled |
4 | Lower transactional costs | Trend riding can be difficult |
5 | It has a tight risk control which allows traders to cut their losses early | It can be boring for traders since they always like to be active in their trades |
Different trading styles use different indicators, strategies, and timeframes. In this table, you will be able to compare some criteria for different trading styles.
| Criteria | Trend trading | scalping | Swing trading | Position trading |
|---|---|---|---|---|
Trading timeframe | A few weeks to a few months | 1 – 15 minutes | A few days – a few months | Several days to several months |
Risk | Sudden trend reversal | Because it is short-term, you are likely to donate all your time to making small, steady profits. | High risk overnight and during weekends. | Risk is lower, but more fatal. |
Best indicators | Moving averages | EMA | Moving averages | Support and resistance |
How to build a trend trading strategy
Here are some steps that can be followed to build a successful trend trading strategy;
Determine Your Trend:
First, find a timeframe. The timeframe is very important in determining a trend. To determine the long-term trend for a trader, there are two very useful indicators; Simple moving averages (SMA) and Estimated Moving averages (EMA). These can be used to find targets and stops as well as support and resistance levels. You can get the simple moving average by dividing the total value of the observation by the number of observations. Here is the general formula;
SMA =
A1 + A2 + A3 + … + An
N
Determine The Trend Intensity:
This measures the strength of the trend. This is done with the help of an indicator which is created by a 60period moving average and price deviations around it. A python code is written to support this calculation. Here is the general formula;
Trend Intensity Indicator =
Total up
Total up + Total down
* 100
Back-Testing The Strategy:
This is the confirmation stage. Here, the trade is initiated based on the confirmation of the trend.
Trend trading indicators and tools
Following different criteria, here are some of the best trend trading indicators
Moving Averages:
Moving averages are the most used indicators in trading systems. They are so fundamental that some of the other indicators like MacD and Bolinger Bands are made based on them.
A moving average is got by summing the data points over a specific period and dividing it by the number of data points summed. It is called moving because its value continues to change with changing price data. There are two main types of a moving average
Simple moving average (SMA): This indicator is backward-looking; it relies on data from the past. This indicator is used by traders to determine when to enter a trade and when to exit the trade.
Exponential moving average: This considers the most recent data points, and it is more responsive to recent price changes.
Relative Strength Index (RSI):
RSI is the most frequently used oscillator indicator. Traders commonly use this indicator to determine overbought and oversold prices. It is displayed as an oscillator and it reads from 0 – 100. Values from 70 and above indicate that a price is being overbought. Values from 30 and below indicate that an asset is being oversold or undervalued.
Price Action
The price action is used to study the behavior of an asset to determine its behavior in the future. If the observations show that the rice value will rise, a trader is likely to go long. If it shows that it will drop, a trader is likely to go short.
Multiple Timeframes:
This indicator shows how higher timeframes are trending. It is important to know from a chart if the timeframe you are trading with syncs with other time frames, and this is what the MTF indicator will show you. Trading with MTF involves spotting broad price patterns. The main thing a trader is searching for in the MTF lines on the chart is the convergence of trends in a higher time frame. This information will confirm to the trader if it is a directional or a non-directional activity.
Bollinger Bands
This indicator is got from moving averages and standard deviation. The centerline of a Bollinger Bands represents the moving average of a period while the upper and lower lines represent standard deviations. When the price is between the center line and the upper lines, it indicates an uptrend, and traders are likely to buy here. When the price is between the middle line and the lower lines, it indicates a downtrend, and the traders are likely to sell here.
Risks of trend trading
Unexpected reversals: Sometimes an asset can indicate a positive trend and then suddenly reverse. When this happens, trend traders are likely to suffer losses. The whole idea of trend trading is that the trend will keep moving in one direction. If this suddenly changes, there is no need to remain in that trade. Trend traders manage this risk by having small stop orders. This way, the loss suffered will not be too much.
Traders should set their risk/reward ratio to 1:2. The risk/reward ratio helps investors to minimize their risks. This ratio is calculated by dividing the amount that a trader could lose if things do not go as planned in a trade, by the amount a trader expects to make when the position is closed. A ratio of 1:7 means you are willing to risk 1 dollar to earn 7 dollars. Trend traders are advised to set their risk/reward ratios beginning from 1:2 to minimize losses.
A trend trader can quickly move from stop loss to breakeven.
Diversification with correlated instruments: The fact that a particular currency has a lot of positive movement does not mean a trend trader should allocate all risks on those pairs. In the case of a reverse, a trader that does this will suffer a huge loss. Trend traders are advised to put in not more than 4-6% risk in a correlated market.
Different risks for different strategies: It is advisable to set different risks for different strategies. For instance, a trend trader who uses both the breakout and pullout entries strategies will risk differently. With a breakout strategy, it is almost certain that the trade will go negative first before producing profit.
With a pullback strategy, the trade is likely to go straight to producing profits. Therefore if a pullback entry does not immediately start to make a profit, there is a tendency that something is not quite right with the trade and the trend trader should exit the trade immediately. Therefore, the stop loss placed initially for a pullback will be tighter than the one made for a breakout.
Who is trend trading best suited for?
Trend trading is suitable for several categories of traders. The trading category that will suit you better depends on your availability, risk appetite, trading style, and other factors.
Here are some qualities suitable for a good trend trader:
You love medium or long-term trading strategies: A trend trader is not in a hurry to make a profit and unlike a day trader, can hold positions overnight. Therefore if you love medium to long-term trades, trend trading will suit you.
Multi-taskers: A trend trading can also work other jobs while monitoring a trade. A trend trader can work with scalping while trend trading.
The best strategy for trend trading
As a trend trader, your sole goal is to monitor a trade and confirm that the direction of a price will not reverse, then invest in that trade.
This is an image of an uptrend. When the trend is making higher highs and higher lows, then it is an uptrend.
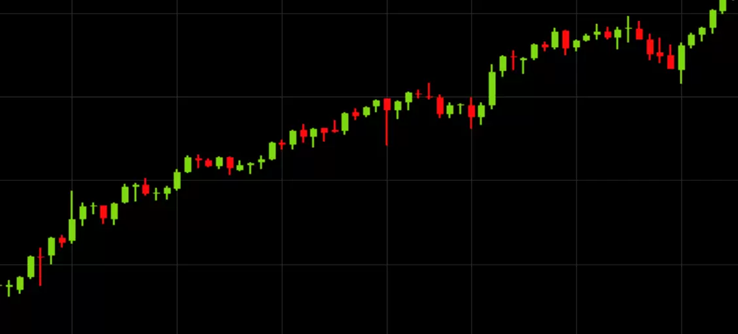
Uptrend
On the other hand, when the trend is making lower highs and lower lows, it is said to be a downtrend;
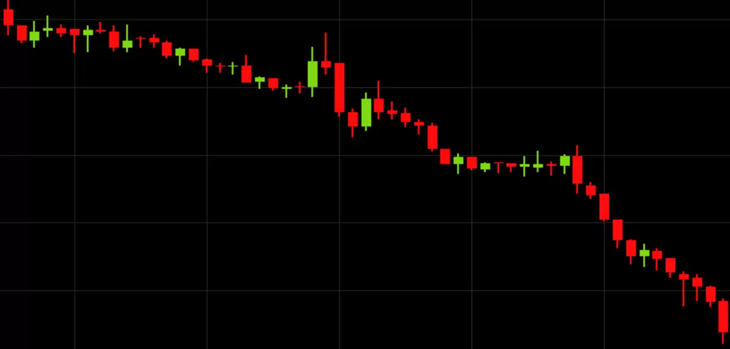
Downtrend
There is another trend called the sideway trend, but traders do not use this trend to make any kind of decision except scalping. A sideways trend is neither attaining highs nor lows.
One of the most effective strategies for trend traders is the ability to create trendlines. Using tools and charts, traders can highlight certain price actions and trace the direction of a trend. Trend trading can serve both intra-day and long-term trading positions. Master the best trend-following strategies.
In intra-day trends, traders hold positions till the end of the day. Traders that use this method only analyze trades that are active for a short period. A trendline is an excellent tool for intra-day traders. This line highlights the market structure and the momentum of price direction. The trend line can be used as support and resistance.
Finding the direction of a trend with a trendline
First draw your trendline, then analyze it to check if it is pointing towards the upward direction (uptrend) or the downward direction (downtrend)
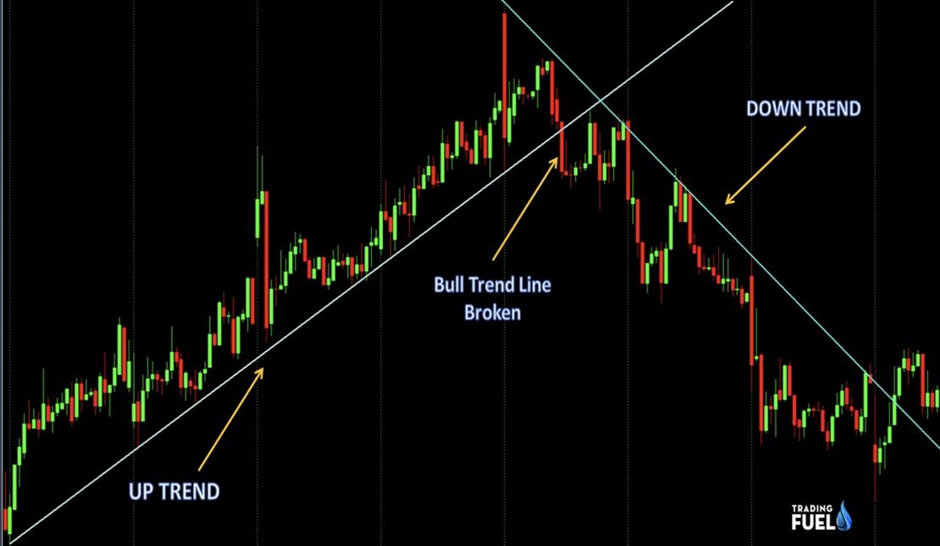
Trendline
In long-term trading, traders hold a particular position, most likely an uptrend, for a long period. Long-term trend traders will focus more on the effect of the market in the long run as opposed to daily fluctuations.
The most popular trend trading technical indicators include:
Moving Average Convergence Divergence (MACD): Traders use this indicator to identify momentum in the market. It works by measuring the difference between two exponential moving averages (EMA) and then it plots this difference as a line chart. It is an effective indicator for identifying new trends and deciding if they are bullish or bearish. When there is confirmation that the market is moving from a downward to an upward trend, traders tend to buy.
MACD is also useful in determining an overbought or an oversold market.
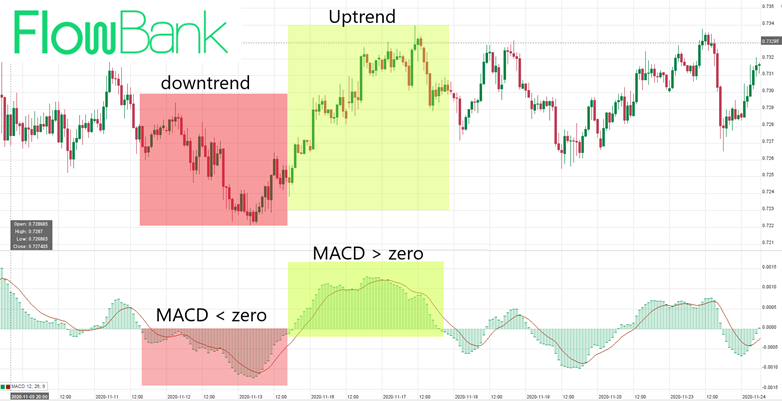
MACD indicator
Relative Strength Index (RSI): RSI gives traders information about the direction of a market’s momentum. This indicator oscillates between 0 and 100. When the scale is 30 and below, the market is oversold. When the scale is 70 and above, the scale is overbought.
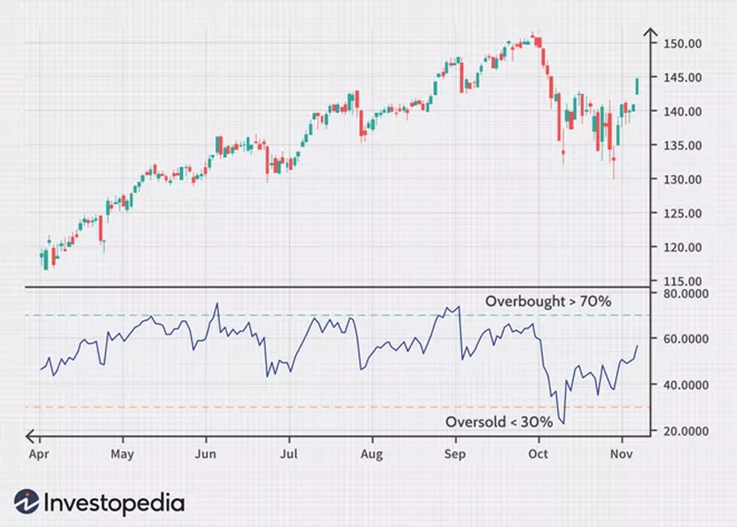
RSI
Parabolic SAR: This indicator determines the direction of price action, and also indicates when the direction is changing. It appears like a series of dots placed either above or below the price bars. A series of dots appearing above the price line indicates a bearish signal while when they appear below the price line, it indicates a bullish signal.
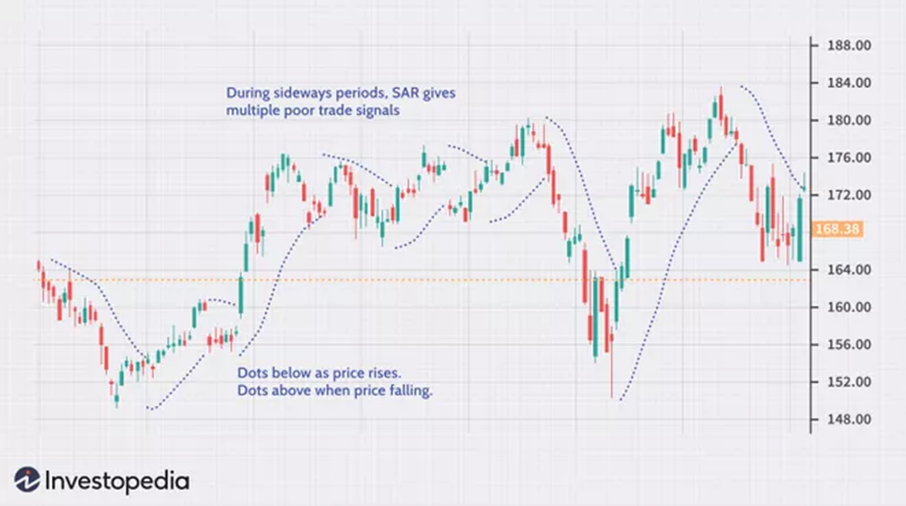
Parabolic SAR
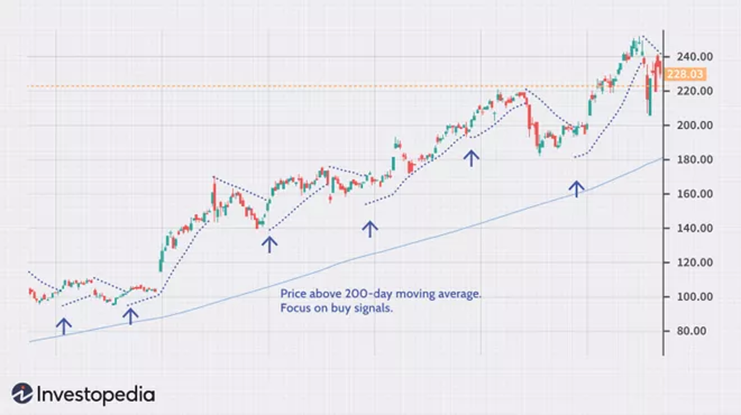
Parabolic SAR
Best brokers for trend trading
Choosing a broker is a very important aspect of trading. A broker is a middleman between the buyer and seller of a trade. It is the job of a broker to study the market attentively, learn the best times to buy and sell trade, and get clients the best possible deals to avoid or minimize losses.
In exchange for these services, brokers get a commission from the trade or from the spread (the difference between the bid price and the ask price of the market you are trading), depending on the agreement between the client and the broker.
A broker has a lot of experience in the trading world and can also provide other services like making recommendations for the buyer. Before choosing a broker;
Know your needs; this will tell you what you should look for in a platform. This will depend on your investment goals and the current knowledge you have about trading.
Ask yourself questions like:
Are you an active or passive trader
What kind of services do you need
What are your investment goals
What kind of trades would you prefer to do
Run a check on the brokerage company before choosing them. Get the answers to some relevant questions that can ensure that you are making the right decision in choosing the broker.
Is the company a member of SIPC, FINRA, and other mandatory bodies for certified brokers?
What insurance kind do they provide in the case of a mishap.
What are other customers saying about them?
Is their account secured? What kind of security technology do they use?
Find out all necessary fees and commissions you would have to pay both now and in the future.
Test the brokerage platform.
Best Brokers
Interactive Brokers - Best For Stock And Forex Trading

Interactive Brokers (IBKR) was founded in 1993. They enable customers to trade stocks, bonds, assets on 135 markets using a single integrated account. In 2020, Interactive Brokers went a step further to launch a dashboard that allows customers to evaluate their assets using a Socially Responsible Investing (SRI) lens.
If you want access to a broad list of assets, then IBKR is a suitable platform for you. They are open to over 220 countries and they accept over 23 currencies. Their security standards are top-notch, featuring multiple forms of two-factor authentication, biometric recognition for mobile app login, so you can rest assured of the safety of your account.
They have a standard education program for both newbies and professionals looking to take courses for all forms of asset classes.
Interactive Brokers Fees RevieweToro - Best for Social Trading

eToro is a leading online trading platform that trades other assets. The company was first launched in 2007 under the name; RetailFX and later changed its name to eToro. In 2010, the company launched its social trading feature which became very popular among users. This feature allowed users to copy successful trades on their platform and repeat them. Buy and sell over 40 crypto assets on the professional crypto exchange.
This platform has 15 years of successful trading history, so traders can feel safe about their investments.
Summary
Here are some of the key takeaways from this article:
There are several trading systems and traders should choose the most suitable systems for themselves based on some factors like; their investment range, personality, and availability
Trend trading uses technical indicators to identify the direction of a market’s momentum.
Trend trading has some pros as well as some cons which we analyzed in this article.
To build a trading system, you should define your timeframe, find your trend, determine the intensity of the trend, and back-test the strategy to ensure it is effective.
There are a few best indicators for trend trading and they include; Moving averages, RSI, Price action, and Bolinger Bands.
There are several risks associated with trend trading including unexpected reversals.
Trend trading is suitable for traders who prefer medium to long-term trading styles.
Before choosing a broker for trading, you must consider certain factors like; your needs, the authenticity of the company, the security, and reliability of the company, fees, and commissions involved.
Interactive Brokers and eToro are some of the best brokers for trading.
FAQs
What defines a strong trend?
The presence of trending highs and trending lows.
What are the top indicators for trend trading?
Moving average, RSI and Parabolic SAR.
What is the major risk of trend trading?
A sudden reversal of a trend that was positive.
What factors should be considered before choosing a broker?
Your needs, the reliability of the broker, fees and commissions, safety and security of your assets.
Glossary for novice traders
-
1
Day trader
A day trader is an individual who engages in buying and selling financial assets within the same trading day, seeking to profit from short-term price movements.
-
2
Scalping
Scalping in trading is a strategy where traders aim to make quick, small profits by executing numerous short-term trades within seconds or minutes, capitalizing on minor price fluctuations.
-
3
Trading system
A trading system is a set of rules and algorithms that a trader uses to make trading decisions. It can be based on fundamental analysis, technical analysis, or a combination of both.
-
4
Deviation
The deviation is a statistical measure of how much a set of data varies from the mean or average value. In forex trading, this measure is often calculated using standard deviation that helps traders in assessing the degree of variability or volatility in currency price movements.
-
5
Bollinger Bands
Bollinger Bands (BBands) are a technical analysis tool that consists of three lines: a middle moving average and two outer bands that are typically set at a standard deviation away from the moving average. These bands help traders visualize potential price volatility and identify overbought or oversold conditions in the market.


Team that worked on the article

Oleg Tkachenko is an economic analyst and risk manager having more than 14 years of experience in working with systemically important banks, investment companies, and analytical platforms. He has been a Traders Union analyst since 2018. His primary specialties are analysis and prediction of price tendencies in the Forex, stock, commodity, and cryptocurrency markets, as well as the development of trading strategies and individual risk management systems. He also analyzes nonstandard investing markets and studies trading psychology.
Also, Oleg became a member of the National Union of Journalists of Ukraine (membership card No. 4575, international certificate UKR4494).

Olga Shendetskaya has been a part of the Traders Union team as an author, editor and proofreader since 2017. Since 2020, Shendetskaya has been the assistant chief editor of the website of Traders Union, an international association of traders. She has over 10 years of experience of working with economic and financial texts. In the period of 2017-2020, Olga has worked as a journalist and editor of laftNews news agency, economic and financial news sections. At the moment, Olga is a part of the team of top industry experts involved in creation of educational articles in finance and investment, overseeing their writing and publication on the Traders Union website.

Mirjan Hipolito is a journalist and news editor at Traders Union. She is an expert crypto writer with five years of experience in the financial markets. Her specialties are daily market news, price predictions, and Initial Coin Offerings (ICO).
