Best Trend-Following Strategies To Master In 2026


Editorial Note: While we adhere to strict Editorial Integrity, this post may contain references to products from our partners. Here's an explanation for How We Make Money. None of the data and information on this webpage constitutes investment advice according to our Disclaimer.
Best trend-following trading strategies:
Moving Average - identifies trend direction and entry-exit points.
Ascending/Descending Triangle Breakout - signals potential price continuation after consolidation.
Average Directional Index (ADX) - evaluates trend strength for better trading decisions.
Bollinger Bands - detects price volatility and reversal opportunities.
MACD (Moving Average Convergence Divergence) - tracks momentum shifts and potential trend changes.
Breakout Strategy - captures price movements beyond key support/resistance levels.
Trendline Trading - follows market direction using support/resistance trendlines.
In the fast-paced world of Forex trading, staying ahead of market trends is crucial for success. Traders who can effectively identify and follow trends have the potential to capitalize on profitable opportunities and maximize their returns.
This is where trend-following strategies and indicators come into play. By utilizing these powerful tools, traders can enhance their decision-making process and increase their chances of making profitable trades. In this article, the experts at TU will explore some of the best trend-following trading strategies and indicators that traders can learn and incorporate into their trading approach.
Best trend following indicators and strategies 2026
A trend-following trading strategy is a method where traders capitalize on the prevailing direction of market trends, assuming that prices will continue moving in the same direction for a period before reversing. It involves identifying trends and aligning trades with the current momentum rather than predicting reversals.
In an uptrend, where prices are rising with higher swing highs and lows, traders take long positions, buying assets with the expectation of further price increases. Conversely, in a downtrend, where prices fall with lower swing highs and lows, traders adopt short positions, selling assets to profit from continued declines. In a sideways trend (range-bound market), prices move within a narrow range between support and resistance levels, making trend-following strategies less effective. Traders instead rely on alternative strategies or wait for a clear trend to emerge.
When it comes to trend following in Forex trading, there are several effective strategies and indicators that traders can learn and apply to their trading approach. Let's explore some of the top trend-following strategies along with their entry and exit points.
Moving average
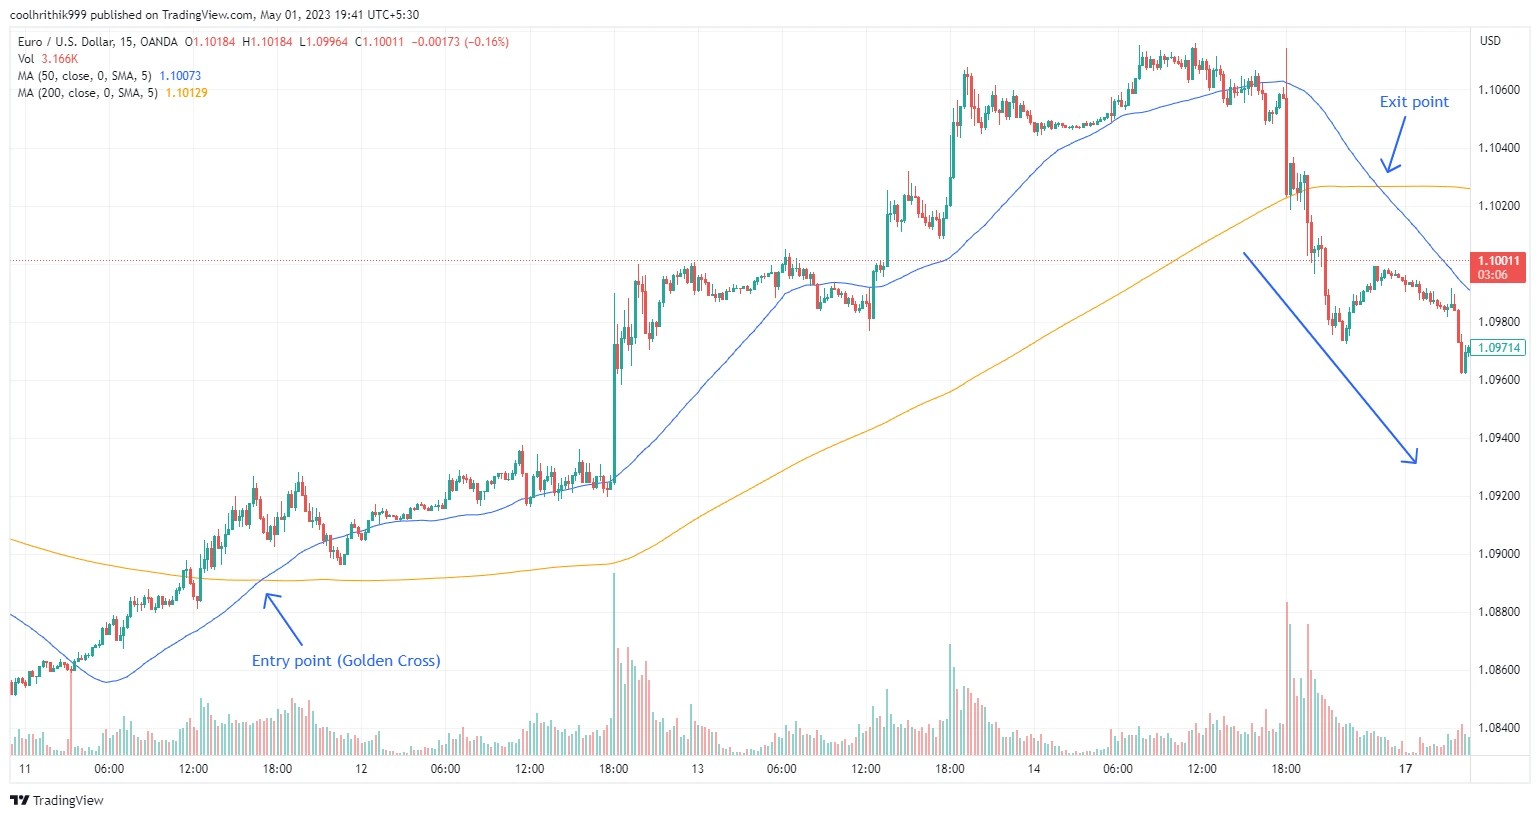
The moving average strategy is a widely used trend-following indicator. Traders use moving averages to analyze trends and generate trading signals. When the price is above the moving average, it indicates an uptrend, and when the price is below the moving average, it indicates a downtrend.
Traders can enter long positions when the price crosses above the moving average or when it comes near the support zone (on the moving average line) and exit when the price crosses below it.
Ascending triangle breakout
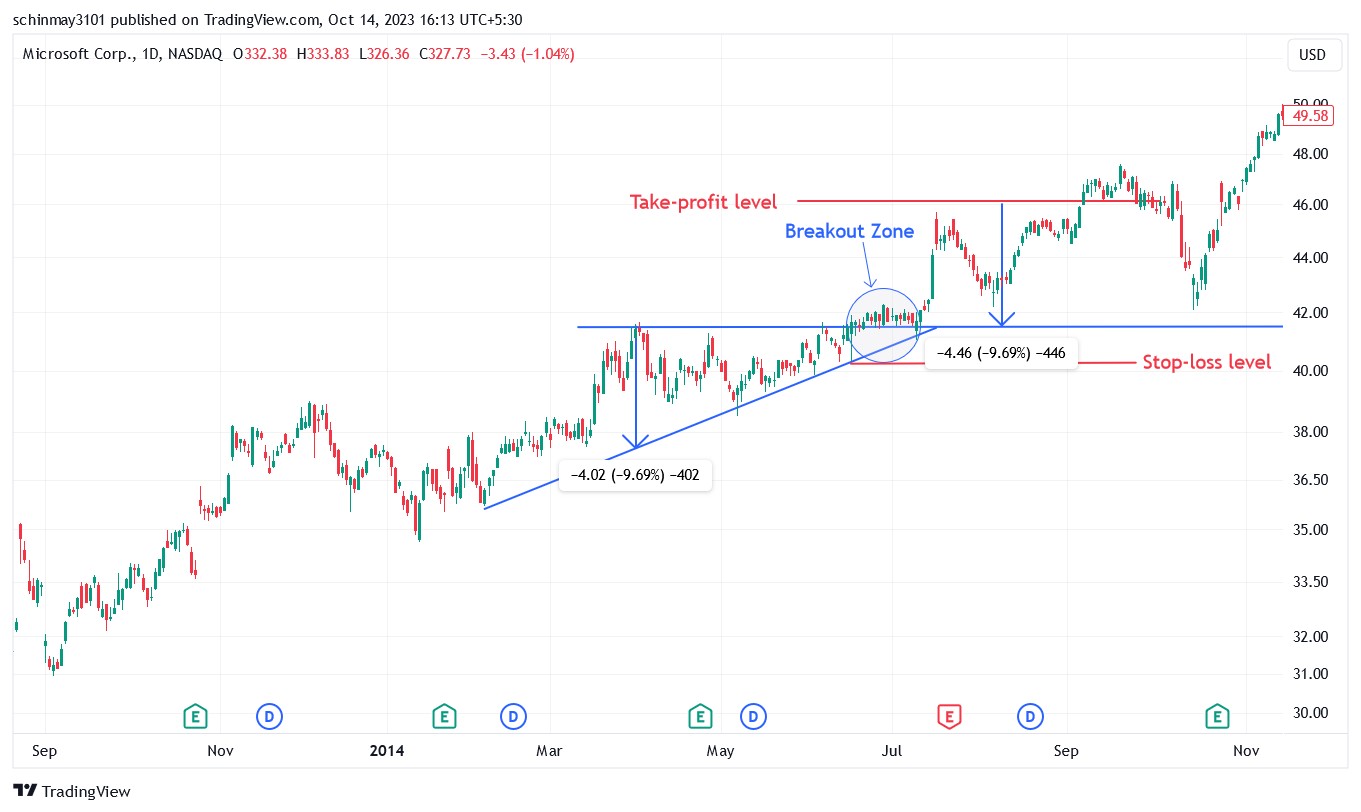
An ascending triangle is a bullish continuation pattern characterized by a horizontal resistance line and a rising trendline. The strategy involves entering a long position when the price breaks above the upper resistance line of the triangle.
This breakout suggests an acceleration of the existing uptrend. Use appropriate stop-loss and take-profit levels to manage risk and maximize potential profits.
Descending triangle breakdown
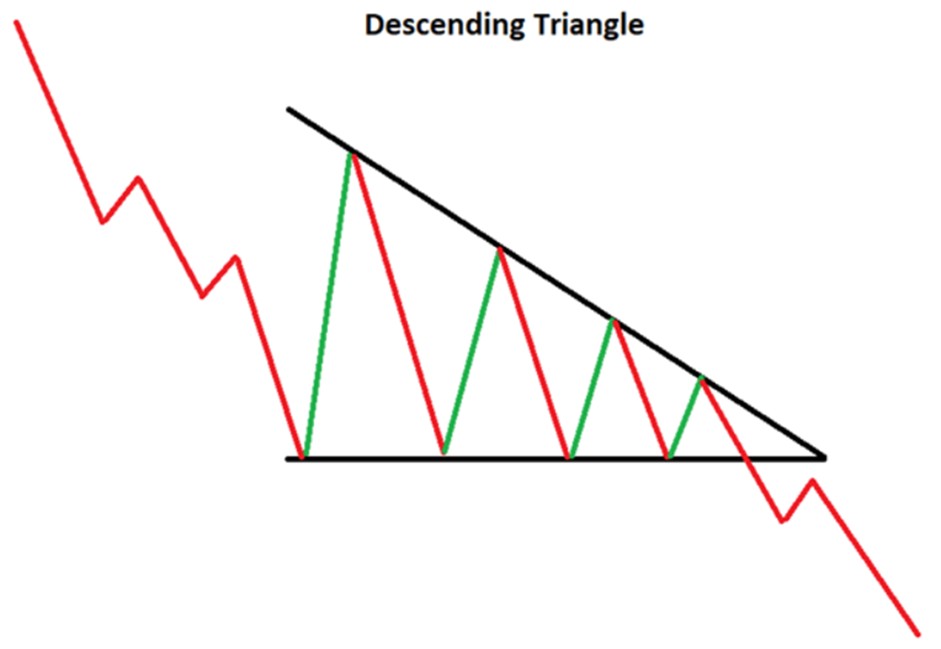
A descending triangle is a bearish continuation pattern characterized by a horizontal support line and a descending trendline. The strategy involves entering a short position when the price breaks below the lower support line of the triangle. This breakdown suggests a resumption of the existing downtrend.
Contrarian bollinger bands

Bollinger Bands consist of three lines: an upper band, a lower band, and a middle moving average, representing price volatility. The Contrarian Bollinger Bands strategy leverages this indicator to spot trading opportunities.
A long position is taken when the price breaks above the upper band and finds support at the dynamic line between the bands, signaling a bullish continuation. A short position is initiated when the price breaks below the lower band and meets resistance at the dynamic line, indicating a bearish continuation. Exit points are set at breaks of dynamic support (for long) or resistance (for short).
MACD (Moving average convergence divergence)

The MACD (Moving Average Convergence Divergence) strategy is a versatile and widely used technique in Forex trading. It enables traders to assess market trends and momentum within a specific time frame by examining the relationship between moving averages and stock price momentum.
By understanding the signals generated by the MACD indicator, traders can identify potential entry and exit points for their trades. The entry point for the MACD strategy (in a downtrend) occurs when the MACD line crosses below the signal line. This crossover generates a sell signal, indicating that a trader can consider entering a short position.
Average Directional Index (ADX)
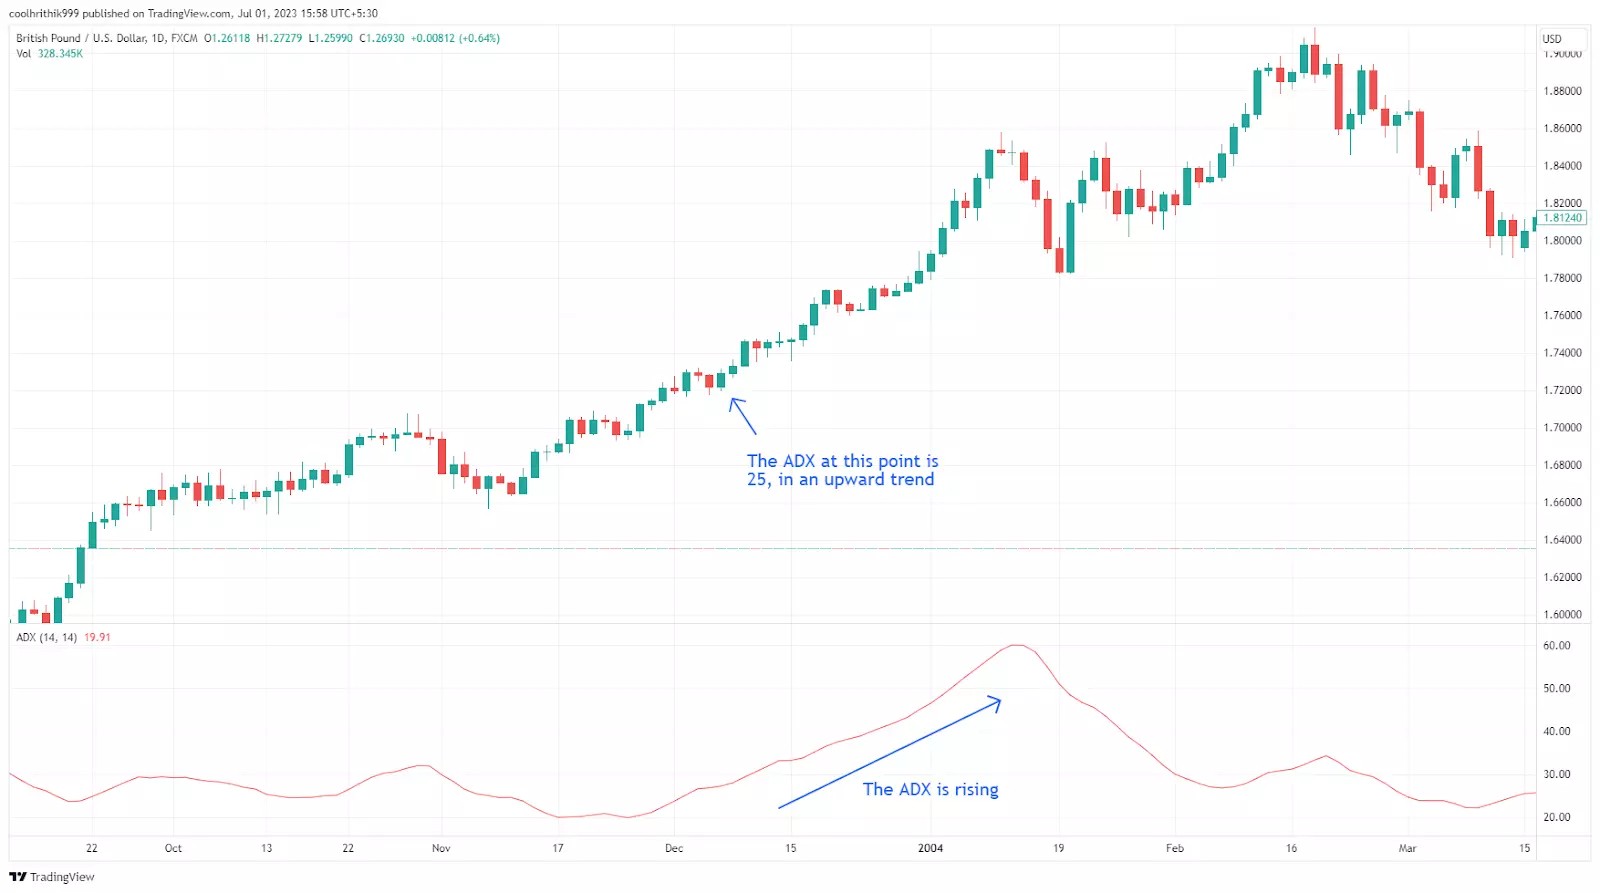
The Average Directional Index measures the strength of a trend. Traders can consider entering a long position when the ADX line is above a certain threshold (e.g., 25) and rising, indicating a strengthening trend. They can exit the position when the ADX line starts to decline, suggesting a weakening trend.
Breakout strategy

The Breakout strategy focuses on identifying significant price breakouts from consolidation patterns or key support/resistance levels. Traders seek opportunities when the price breaks above a resistance level or below a support level, indicating a potential entry point. This strategy aims to capture the momentum of a new trend.
For the exit point, traders can employ various techniques such as trailing stops, target levels based on support/resistance zones, or the completion of a specific price pattern.
Trendline trading
Trendline Trading strategy involves drawing trendlines by connecting consecutive higher lows in an uptrend or consecutive lower highs in a downtrend. Traders can use trendlines to identify potential entry and exit points.
When the price breaks above a downtrend line or below an uptrend line, it may indicate a trend reversal or continuation. Traders can enter a trade based on these trendline breaks and exit when the price shows signs of a potential reversal or reaches a predetermined target.
Flag pattern strategy
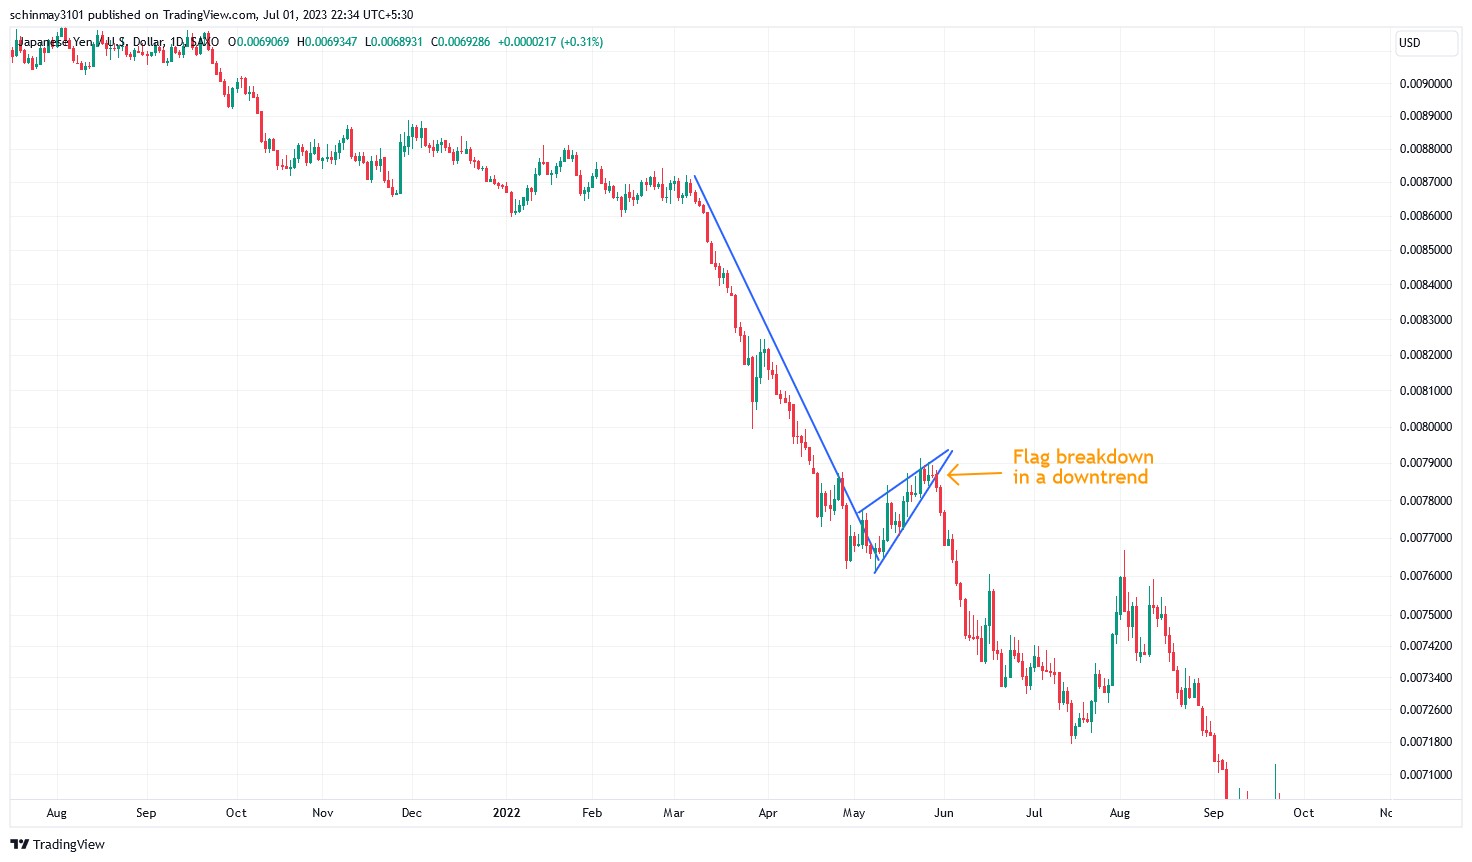
The Flag Pattern strategy is a dynamic approach that focuses on capturing continuation patterns within an ongoing trend, whether it is ascending or descending. Flag patterns are reliable indicators that suggest the current trend is likely to resume after a temporary pause in the asset's price movement.
Traders can enter a trade when the price breaks out of the flag pattern in the direction of the prevailing trend. Exit points can be determined using techniques like trailing stops, Fibonacci extensions, or target levels based on the size of the flagpole.
Benefits of trend-following strategies
Profit potential. Trend-following strategies aim to capture the momentum of prolonged price movements, allowing traders to align with upward or downward trends and potentially achieve significant returns.
Simplicity. These strategies are straightforward, requiring traders to identify trend direction and take corresponding positions, making them accessible to both beginners and seasoned traders.
Time efficiency. Once a trend is identified, trades can run until reversal signs appear, reducing the need for constant market monitoring and making it ideal for those with limited trading time.
Diversification. Trend-following can be applied across various markets — stocks, commodities, currencies, and indices — helping traders spread risk and capitalize on diverse opportunities.
Lower transaction costs. Holding positions longer reduces the frequency of trades, leading to cost savings on commissions and spreads, which can boost profitability.
Emotional discipline. By following predefined entry and exit rules, traders reduce emotional decision-making, fostering consistency and avoiding impulsive moves driven by fear or greed.
Choosing a broker to test trend-following trading strategies requires careful consideration of several factors to ensure a conducive trading environment. We have studied the conditions on the best trading platforms and prepared a comparison table:
| Currency pairs | Demo | Min. deposit, $ | Max. leverage | Min Spread EUR/USD, pips | Max Spread EUR/USD, pips | Deposit fee, % | Withdrawal fee, % | Open an account | |
|---|---|---|---|---|---|---|---|---|---|
| 50 | Yes | 10 | 1:1000 | 0.1 | 0.4 | No | No | Go to broker Your capital is at risk.
|
|
| 60 | Yes | 100 | 1:300 | 0.5 | 0.9 | No | No | Go to broker 80% of retail CFD accounts lose money. |
|
| 69 | Yes | 50 | 1:50 | 0.9 | No | No | No | Go to broker Your capital is at risk. |
|
| 68 | Yes | No | 1:200 | 0.1 | 0.5 | No | No | Go to broker Your capital is at risk. |
|
| 80 | Yes | 100 | 1:50 | 0.7 | 1.2 | No | No | Study review |
Tips to keep in mind while trading a trend-following strategy
When implementing a trend-following strategy, there are important factors to keep in mind to maximize your trading success. Consider the following tips to enhance your approach and increase your odds of capturing and following profitable trends:
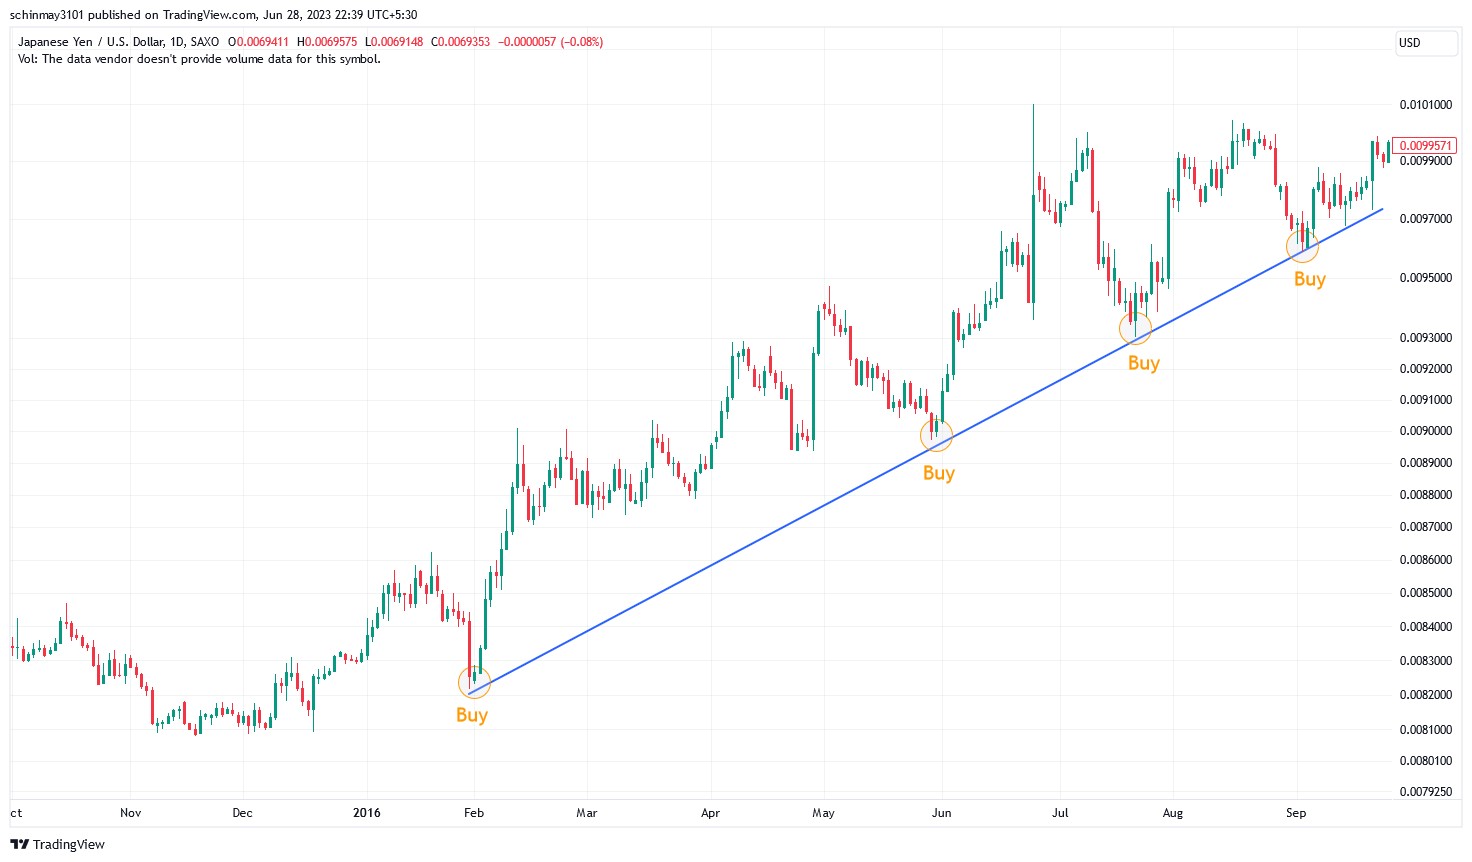
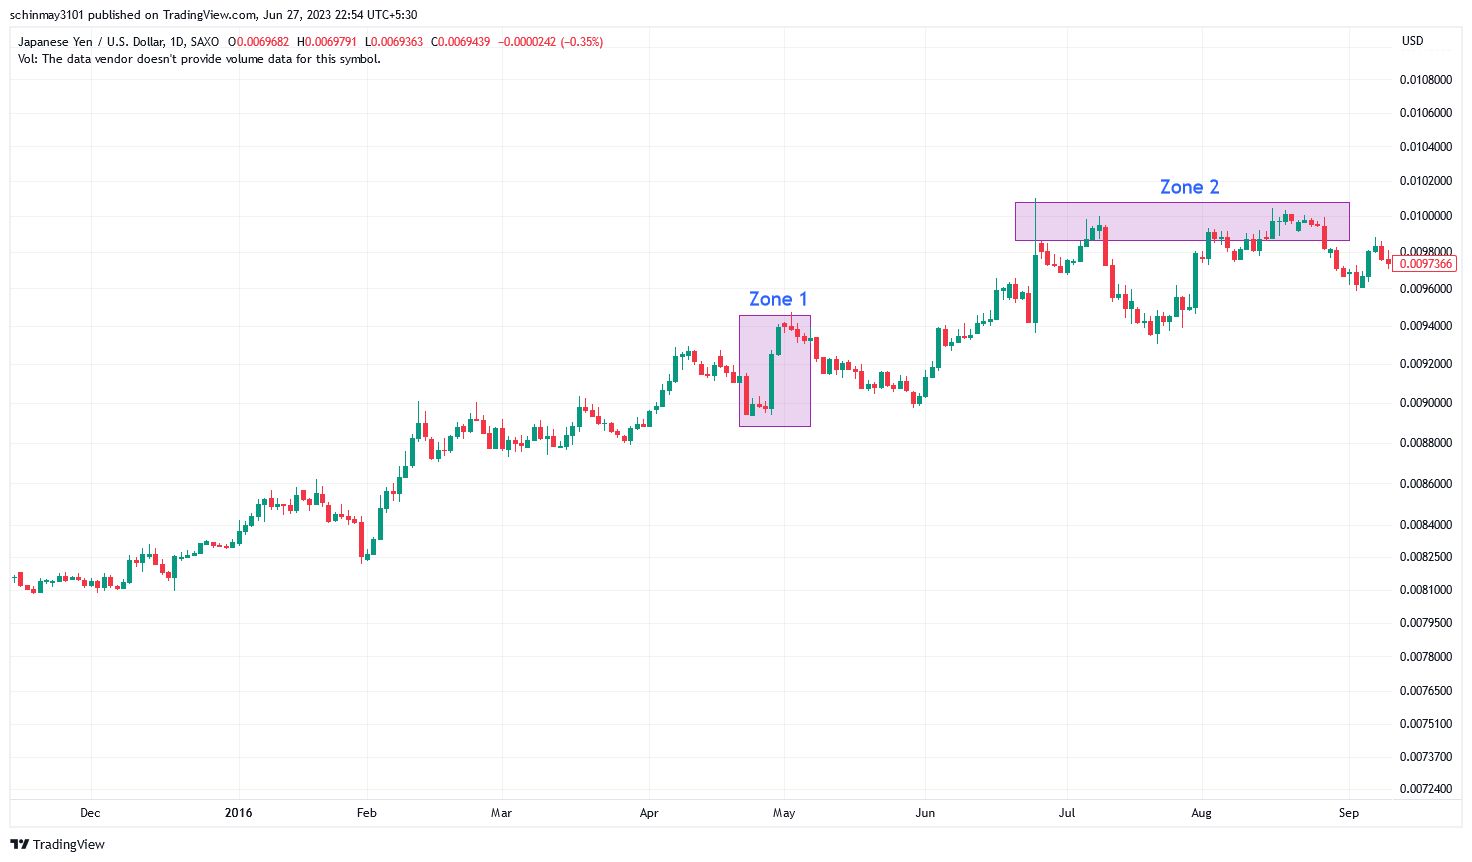
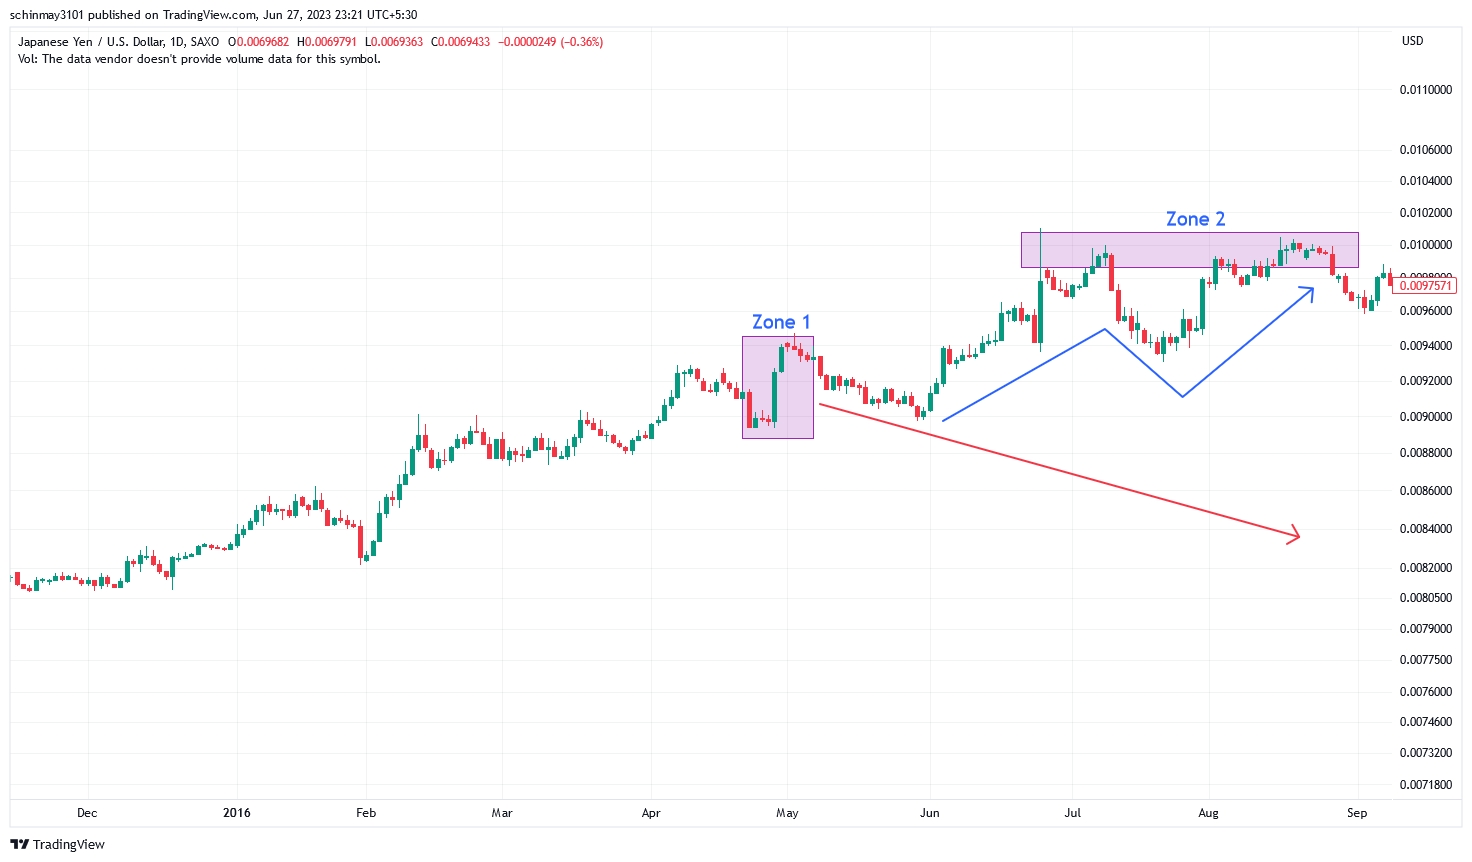
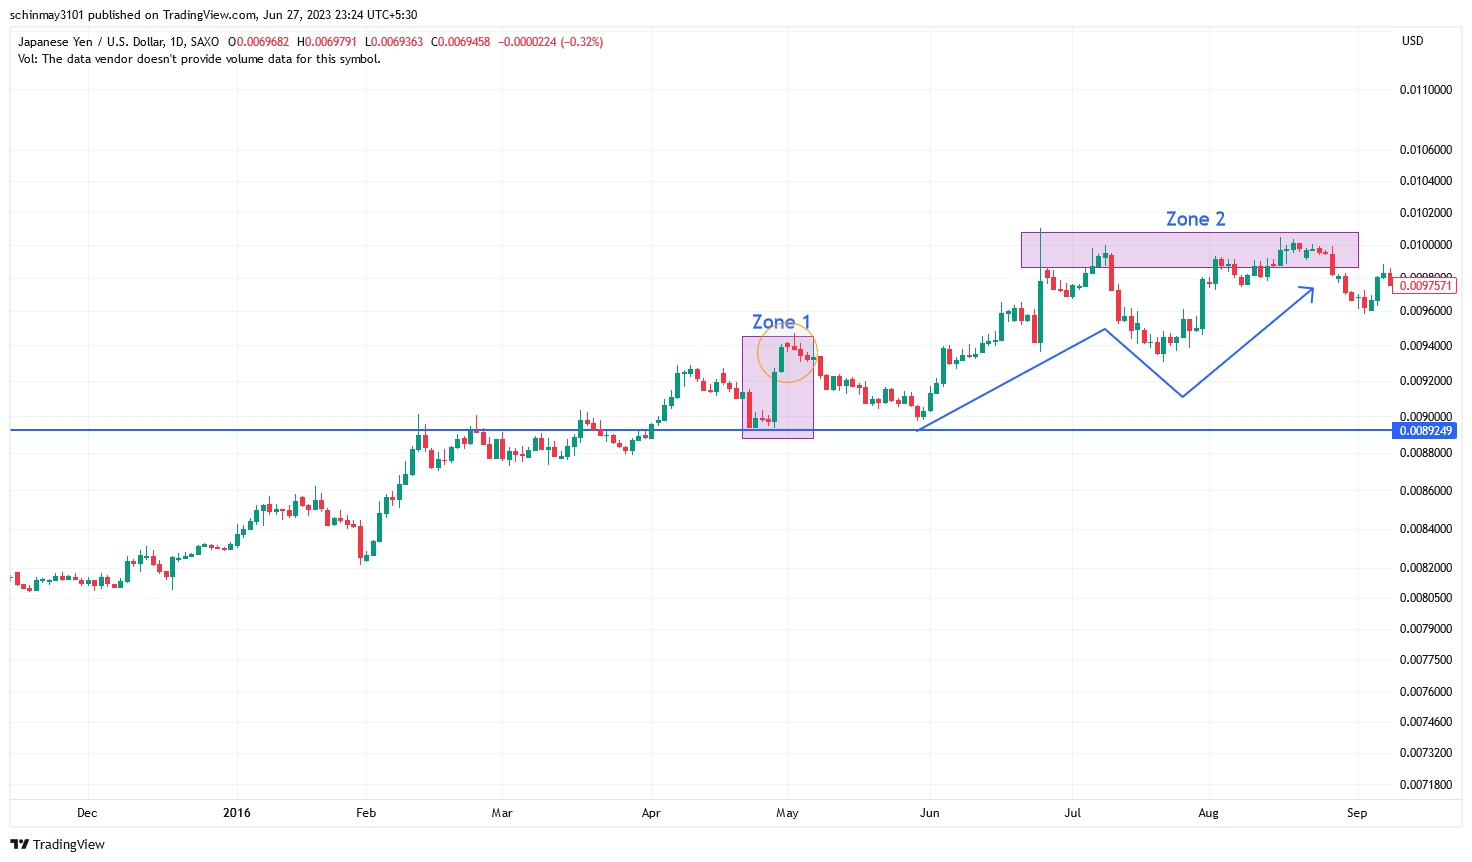
Buy high, sell higher: in a trend-following strategy, the objective is to enter trades when prices are already rising (in an uptrend) or falling (in a downtrend). The idea is to ride the trend by buying securities at higher prices and selling them at even higher prices.
For instance, look at the chart above, where the price is in a clear uptrend. A trend-following trader would ideally act on a buy signal in Zone 1, which although it is already higher still gives reasonable assurance for trend continuation. The exit point would be at any peak in Zone 2, based on exit calls generated by the trader’s strategy.
Avoid market predictions: trying to predict future market movements can cloud your judgment and lead to costly trading mistakes. Instead of speculating on the market direction, focus on following the price action. By objectively observing and analyzing the actual price movement, you can make more informed trading decisions based on the current trend. Continuing our previous example, if a trader tried to predict that a downtrend would begin based on the length of the uptrend, and entered a short sell position, they would have undertaken a loss-taking trade, simply because they tried to predict against the trend instead of just following it.
Implement effective risk management: Risk management is crucial in any trading strategy, including trend following. It is important not to risk more than a fraction of your trading capital on each trade. By setting appropriate stop-loss orders or employing risk management techniques such as position sizing, you can protect your capital and manage potential losses.
If a trader entered the position at the top of Zone 1, they could have placed a stop-loss order at the price corresponding to the horizontal line in the above image. That level displays a broken-out resistance (turned into support), which, if broken, could be a good cue for exiting a long trade. We can see that the price did not return to the stop-loss level and moved towards Zone 2, meaning that profit booking was possible for the trader without triggering their stop loss.
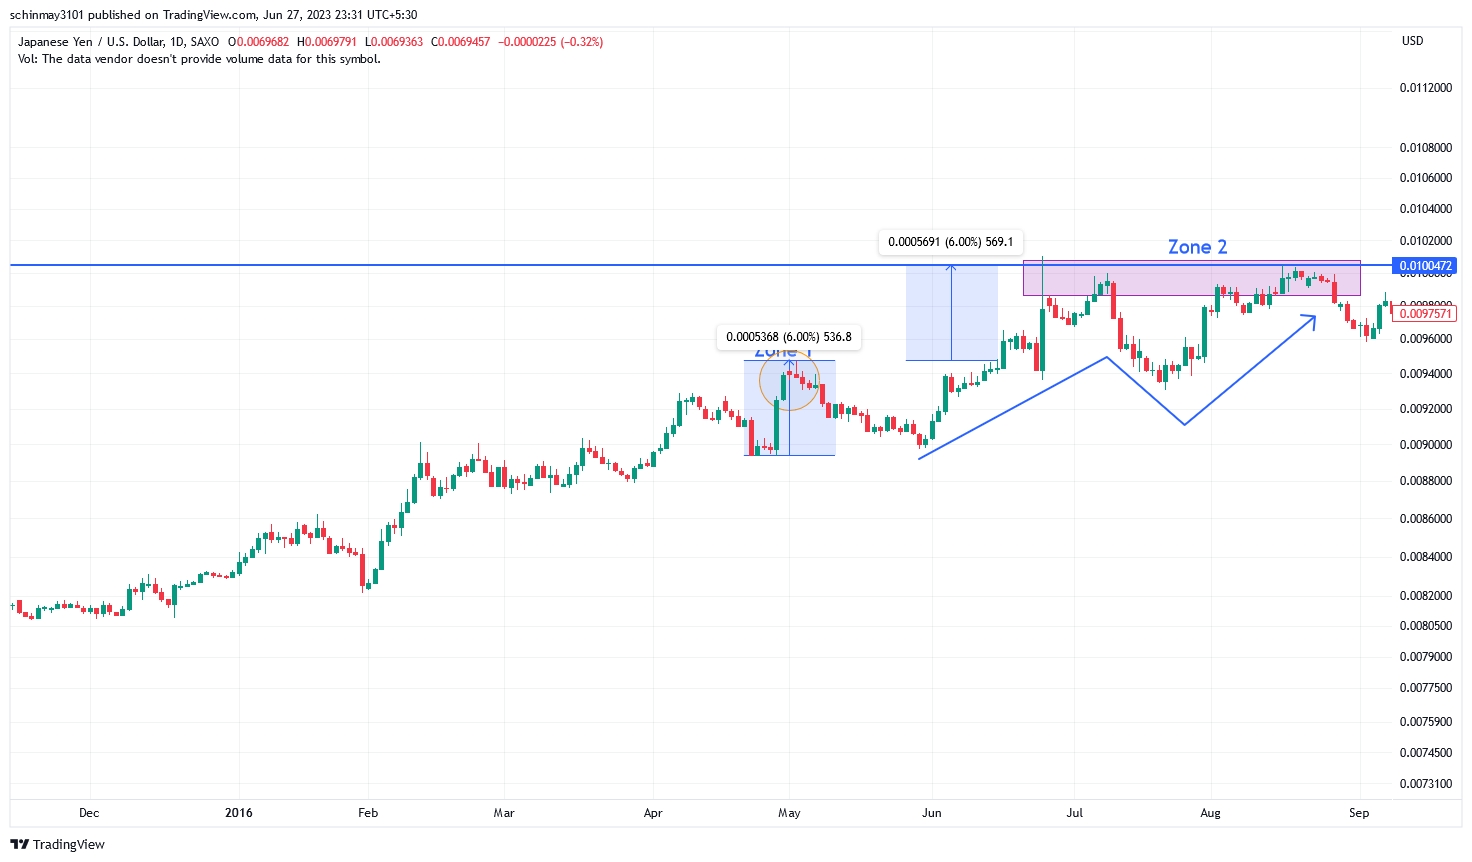
Set stop-loss targets: While trend-following strategies may not have specific profit targets, it is essential to establish stop-loss targets. A stop-loss order is a predetermined price level at which you will exit a trade to limit potential losses.
For instance, for a Zone 1 entry, a stop-loss target could have been set as the range of the most recent swing (6% for our case as denoted by the price range tool on the chart). A trader who had set a 6% stop-loss target from this entry point would have gotten 3 chances to exit this trade profitably, given that the target price (as denoted by the horizontal line across the chart) was hit thrice.
Diversify your market exposure: Rather than focusing solely on one market, consider diversifying your trades across various markets. This can increase your chances of capturing and following different trends simultaneously. By spreading your trades across different markets, you mitigate the risk of relying on a single market and potentially enhance your overall trading performance
Does trend-following strategy work?
Yes, trend-following strategies are effective and can be profitable, as they capitalize on sustained price trends in financial markets. By aligning trades with the market's momentum, traders aim to ride upward or downward trends and achieve significant returns.
The strategy's simplicity is a key strength, focusing on identifying and following trends without relying on complex predictions or indicators. This straightforward approach makes it accessible and reduces the likelihood of overcomplicated decisions, benefiting both novice and experienced traders.
Additionally, trend-following strategies often have a low correlation with other trading approaches, offering diversification benefits. Combined with different strategies, they can help reduce overall portfolio risk while enhancing potential returns.
Adapt your trend-following approach to market conditions

From my experience, trend-following strategies thrive when markets show clear momentum, but the key is adapting to changing market dynamics. For instance, while a Moving Average strategy might work seamlessly during a strong trend, it could generate false signals in a choppy, range-bound market. That’s why blending it with an indicator like ADX can help confirm the trend’s strength before you commit to a position.
One mistake I often see traders make is sticking rigidly to one strategy, regardless of the market environment. Flexibility is critical — sometimes a breakout strategy or Bollinger Bands might give you better clarity in volatile conditions. I always double-check potential setups against multiple indicators to minimize risk and improve confidence in my trades.
Don’t underestimate the power of backtesting. Before applying any strategy to live trading, test it on historical data to understand how it performs in various conditions. This process helped me refine my approach, avoid costly mistakes, and gain a better understanding of when to enter and exit trades effectively. Remember, no strategy works 100% of the time — constant learning and adapting are what makes a trader successful.
Conclusion
In 2026, mastering trend-following strategies such as Moving Average, MACD, and ADX remains essential for consistent success in forex trading. These tools empower traders to identify prevailing market directions and capitalize on sustained trends with confidence. For instance, using the Moving Average enables swift recognition of bullish or bearish shifts, while MACD signals optimal entry and exit points. Ultimately, the enduring power of trend-following lies in its ability to simplify complex markets and place probability firmly on the trader’s side—reminding us that in forex, the trend truly is your friend.
FAQs
What are the main advantages of using trend-following indicators like MACD or Bollinger Bands in Forex trading?
How can traders determine optimal entry and exit points when using trend-following strategies?
What common mistakes should Forex traders avoid when implementing trend-following strategies?
Why is backtesting important before applying Forex trend-following strategies in live trading?
Editors' Top Picks and Insights

Hunting crypto owners: Why criminals have gone offline

BitMEX is shutting down: Why Trump could not save the exchange

Do governments need crypto workers?

Brent nears $100: Why oil prices are rising

Gram Wallet launch: Can Telegram bring crypto to the masses?

AI without limits: How dangerous are neural networks?
Related Articles
Team that worked on the article
Alamin Morshed is a contributor at Traders Union. He specializes in writing articles for businesses that want to improve their Google search rankings to compete with their competition.
Chinmay Soni is a financial analyst with more than 5 years of experience in working with stocks, Forex, derivatives, and other assets. As a founder of a boutique research firm and an active researcher, he covers various industries and fields, providing insights backed by statistical data.
Mirjan Hipolito is a journalist and news editor at Traders Union. She is an expert crypto writer with five years of experience in the financial markets.
Bollinger Bands (BBands) are a technical analysis tool that consists of three lines: a middle moving average and two outer bands that are typically set at a standard deviation away from the moving average. These bands help traders visualize potential price volatility and identify overbought or oversold conditions in the market.
Swing trading is a trading strategy that involves holding positions in financial assets, such as stocks or forex, for several days to weeks, aiming to profit from short- to medium-term price swings or "swings" in the market. Swing traders typically use technical and fundamental analysis to identify potential entry and exit points.
Index in trading is the measure of the performance of a group of stocks, which can include the assets and securities in it.
Risk management is a risk management model that involves controlling potential losses while maximizing profits. The main risk management tools are stop loss, take profit, calculation of position volume taking into account leverage and pip value.
Backtesting is the process of testing a trading strategy on historical data. It allows you to evaluate the strategy's performance in the past and identify its potential risks and benefits.

-
 Afghanistan
-
 Albania
-
 Algeria
-
 Angola
-
 Argentina
-
 Armenia
-
 Australia
-
 Austria
-
 Azerbaijan
-
 Bahamas
-
 Bahrain
-
 Bangladesh
-
 Belarus
-
 Belgium
-
 Bolivia
-
 Botswana
-
 Brazil
-
 Brunei
-
 Bulgaria
-
 Cambodia
-
 Cameroon
-
 Canada
-
 Chile
Chile
-
 China
China
-
 Colombia
-
 Congo
Congo
-
 Costa Rica
-
 Cote d'Ivoire
-
 Croatia
-
 Cuba
Cuba
-
 Cyprus
-
 Czechia
-
 DR Congo
-
 Denmark
-
 Dominican Republic
-
 Ecuador
-
 Egypt
Egypt
-
 El Salvador
-
 Estonia
-
 Eswatini
-
 Ethiopia
-
 Finland
-
 France
-
 Georgia
-
 Germany
-
 Ghana
Ghana
-
 Greece
-
 Haiti
Haiti
-
 Hong Kong
-
 Hungary
-
 India
India
-
 Indonesia
-
 Iran, Islamic republic
-
 Iraq
Iraq
-
 Ireland
-
 Israel
-
 Italy
Italy
-
 Jamaica
-
 Japan
Japan
-
 Jordan
-
 Kazakhstan
-
 Kenya
Kenya
-
 Korea
Korea
-
 Kuwait
-
 Kyrgyzstan
-
 Laos
Laos
-
 Latvia
-
 Lebanon
-
 Lesotho
-
 Libya
Libya
-
 Lithuania
-
 Luxembourg
-
 Madagascar
-
 Malaysia
-
 Malta
Malta
-
 Mauritius
-
 Mexico
-
 Moldova
-
 Mongolia
-
 Montenegro
-
 Morocco
-
 Mozambique
-
 Myanmar
-
 Namibia
-
 Nepal
Nepal
-
 Netherlands
-
 New Zealand
-
 Nigeria
-
 North Macedonia
-
 Norway
-
 Oman
Oman
-
 Pakistan
-
 Palestine
-
 Panama
-
 Papua New Guinea
-
 Paraguay
-
 Peru
Peru
-
 Philippines
-
 Poland
-
 Portugal
-
 Puerto Rico
-
 Qatar
Qatar
-
 Reunion
-
 Romania
-
 Rwanda
-
 Saudi Arabia
-
 Serbia
-
 Singapore
-
 Slovakia
-
 Slovenia
-
 Somalia
-
 South Africa
-
 Spain
Spain
-
 Sri Lanka
-
 Sweden
-
 Switzerland
-
 Syria
Syria
-
 Taiwan
-
 Tajikistan
-
 Tanzania
-
 Thailand
-
 Trinidad and Tobago
-
 Tunisia
-
 Turkey
-
 UAE
UAE
-
 Uganda
-
 Ukraine
-
 United Kingdom
-
United States
-
 Uruguay
-
 Uzbekistan
-
 Venezuela
-
 Vietnam
-
 Yemen
Yemen
-
 Zambia
-
 Zimbabwe
- Forex
- Crypto
