How To Trade The Ascending Triangle Chart Pattern

-
The ascending triangle pattern is a bullish chart formation indicating potential price breakouts
-
Characterized by a horizontal resistance and an ascending lower trend line
-
Signals buyer strength as they consistently purchase at higher lows
-
Confirmed by a decisive close above resistance
-
Utilized for entering long positions, with retests of resistance as support being optimal entry points
-
Stop losses are typically placed below the last higher low within the triangle
-
Profit targets are projected from the height of the triangle's base upwards from the breakout point
In the complex world of Forex and crypto trading, discerning the right moment to enter or exit a trade is paramount. Traders often find themselves lost amidst volatile price movements and ambiguous patterns, struggling to make profitable decisions. This article addresses the critical challenge of identifying strong trading signals in an ever-fluctuating market.
Introducing and explaining the ascending triangle pattern, a well-regarded indicator of future price movement, we offer traders a valuable tool to enhance their trading strategy. Through understanding and applying this pattern, traders can navigate the markets with greater confidence and precision.
-
What is the triangle pattern?
The triangle pattern is a chart formation that shows the convergence of price ranges into a narrower point, signaling a potential breakout.
-
Is an ascending triangle bullish?
Yes, an ascending triangle is typically considered a bullish pattern, suggesting an upcoming upward price movement.
-
How to trade an ascending triangle pattern?
To trade an ascending triangle pattern, look for a breakout above the resistance line, enter a long position on confirmation, place a stop loss below the recent higher low, and set a profit target based on the triangle's height.
-
What is the success rate of the ascending triangle?
The success rate of an ascending triangle can vary, but it is generally regarded as a reliable indicator, especially when confirmed by high trading volumes and favorable market conditions.
What is the meaning of the ascending triangle in trading?
The ascending triangle pattern in trading is usually interpreted as a bullish formation on the chart, which signals a possible continuation of the uptrend. The ascending triangle pattern is widely used by technical analysts in various markets: crypto, Forex, and stocks.
It is characterized by a flat upper trend line that acts as resistance and an ascending lower trend line that acts as support, converging towards a point. This pattern typically indicates that buyers are more aggressive than sellers, as each dip is bought at a higher level than the previous one, suggesting an impending breakout to the upside.
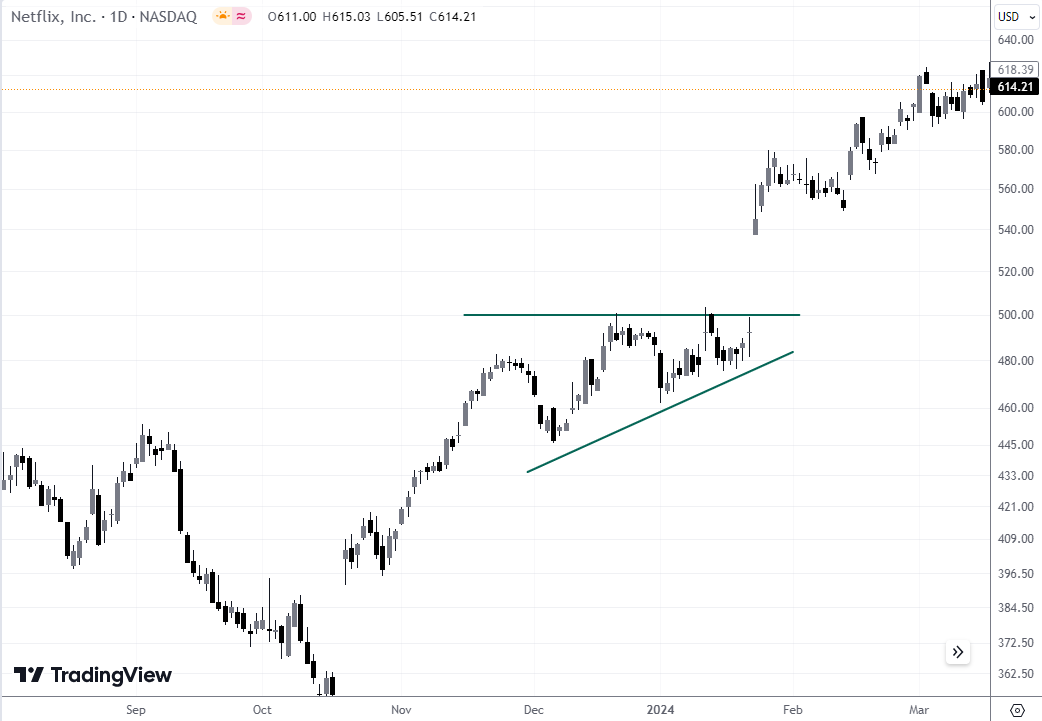
Ascending triangle pattern. Example from NFLX stock chart
The example above shows an example of an ascending triangle that formed near the $500 resistance level for NFLX stock. Buyers kept pushing (as evidenced by the rising lows) and eventually the stock made a powerful breakout on the back of positive news.
Triangle patterns in trading can be categorized into three main types, each signifying different market sentiments:
-
Ascending Triangle: Indicative of bullish sentiment, it features a horizontal resistance line and an upward-sloping support line
-
Descending Triangle: This pattern represents bearish sentiment, characterized by a horizontal support line and a downward-sloping resistance line
-
Symmetrical Triangle: This signifies a period of consolidation, with both support and resistance lines converging at an angle, indicating uncertainty and typically leading to a breakout in either direction
The Ascending Triangle pattern suggests that despite sell-side efforts to keep the price below a certain level, buying interest is not only present but intensifying. As the pattern narrows and reaches its apex, the likelihood of a bullish breakout grows, implying a potential buying opportunity for traders who can spot and act on this signal.
How to Draw an Ascending Triangle Pattern
In chart analysis, the ascending triangle pattern is drawn by meticulously plotting two key trend lines.
-
Begin with the horizontal resistance line: pinpoint the price highs where the market has failed to push through and connect these peaks with a straight line. This reflects a strong sell-side barrier
-
Then, chart the ascending support line by joining the higher lows, each one marking an incrementally more ambitious floor established by buyers. The rising support line underscores growing bullish sentiment and an increasing willingness to buy at higher levels after each pullback
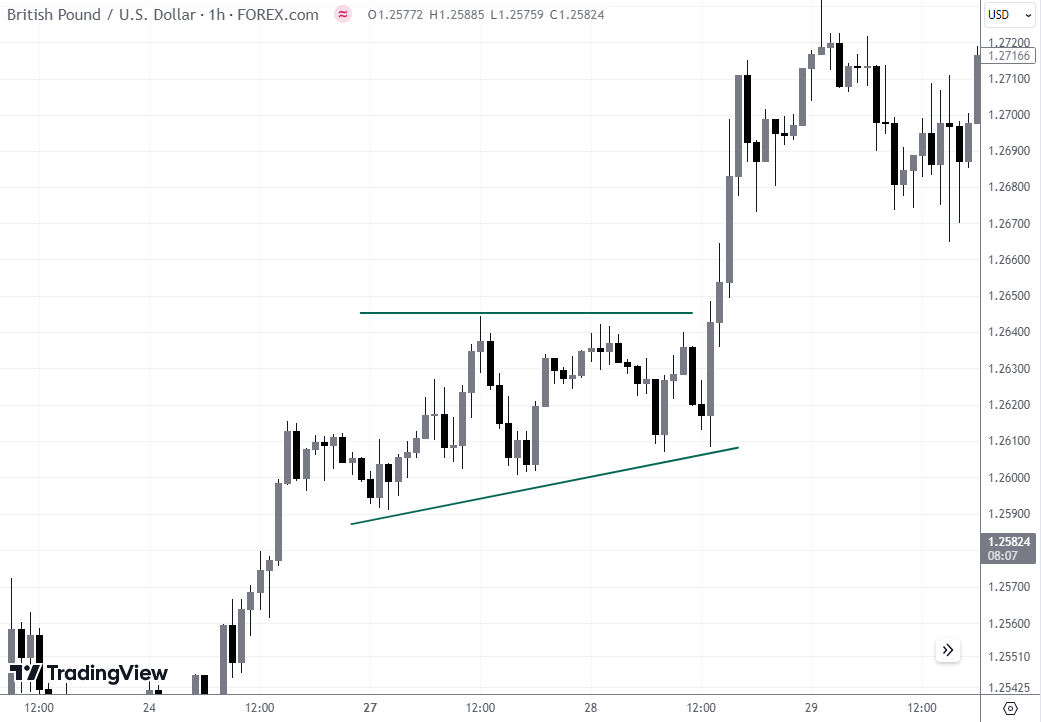
Ascending triangle pattern. Example from GBP/USD chart
The convergence of the resistance and support lines forms the ascending triangle, as seen on the chart. The pattern is completed when the price is compressed into the apex of the triangle, often resulting in a significant breakout to the upside. This chart offers a clear depiction of such a formation, highlighting the essential points where the trend lines are anchored, which is instrumental for traders aiming to capitalize on this bullish signal.
Best Forex brokers


How to use the ascending triangle pattern for trading
In trading, an ascending triangle pattern indicates a potential bullish breakout. Confirmation comes when the price closes above the resistance line, as seen on the chart.
-
Entry Point: Enter a long position after the price retests the broken resistance, now acting as support. This strategy offers a better risk-reward balance
-
Stop Loss: Set a stop loss below the last higher low inside the triangle to minimize losses if the breakout fails
-
Profit Targets: Determine profit targets by measuring the triangle’s height and projecting it from the breakout point upward
Practical Example #1. BTC/USD
At the end of 2023, the Bitcoin market was bullish. Participants were waiting for the approval of the BTC ETF.
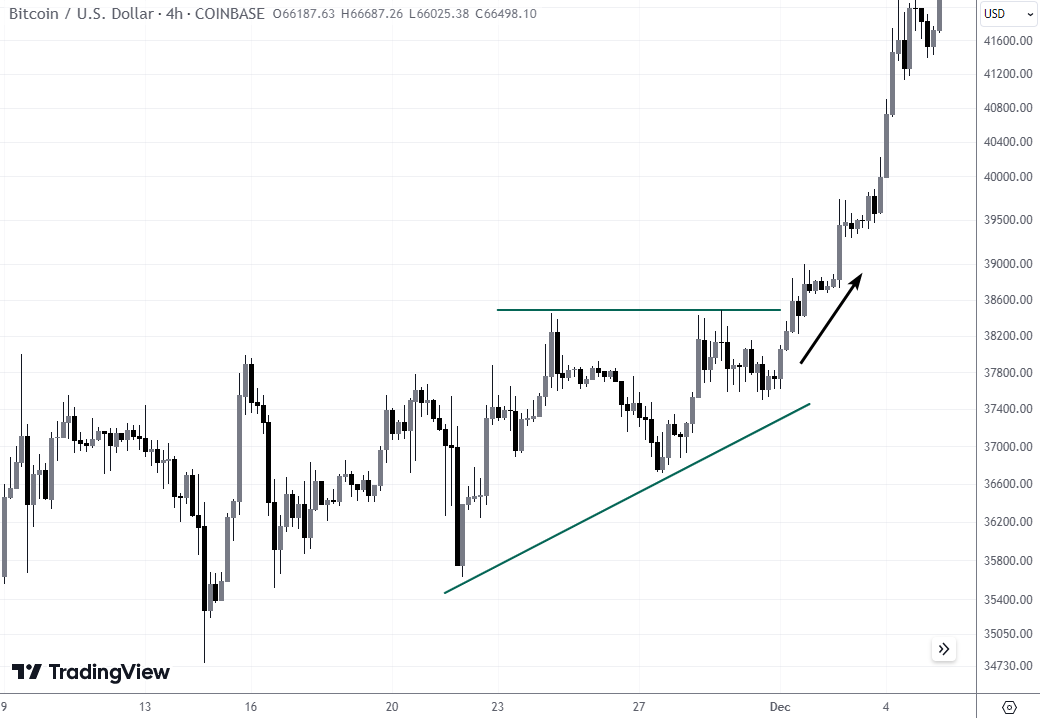
Ascending triangle pattern. Example from BTC/USD chart
One of the consequences of the prevalence of positive market participants was the formation of an ascending triangle pattern when resistance around $38,500 per bitcoin was broken (shown above on the chart).
Practical Example #2. XAU/USD
The chart below shows that the ascending triangle pattern does not always show up in perfect form.
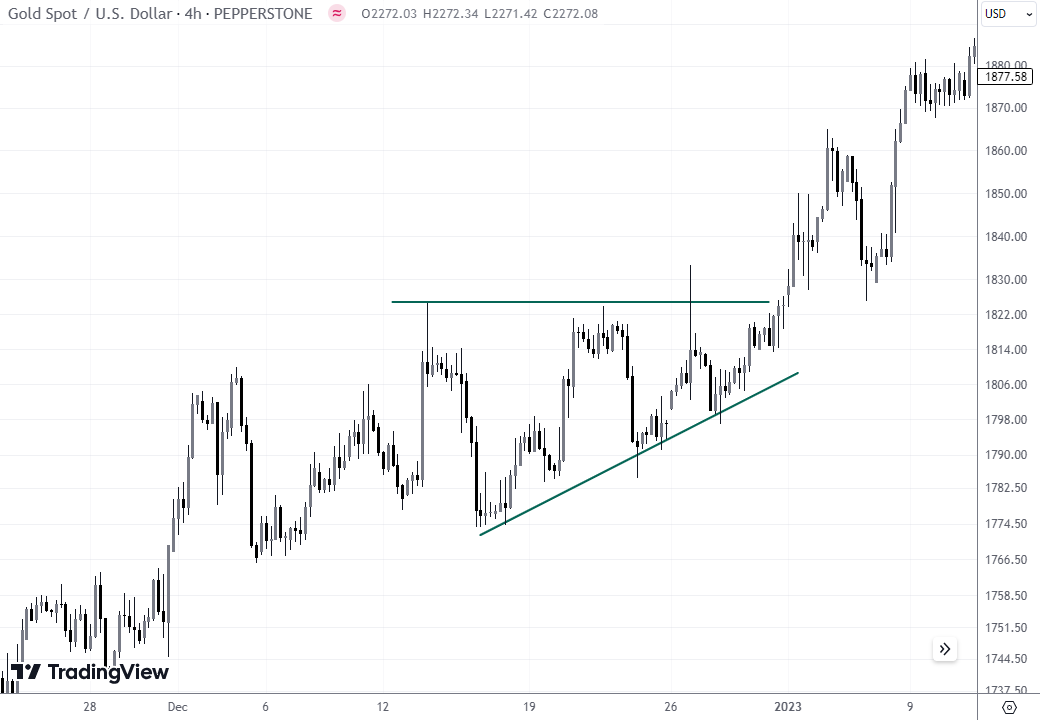
Ascending triangle pattern. Example from XAU/USD chart
In this case, the gold market experienced a false pattern breakout before a true breakout followed.
Practical Example #3. NASDAQ
The chart below shows one-way traders can utilize the ascending triangle pattern:
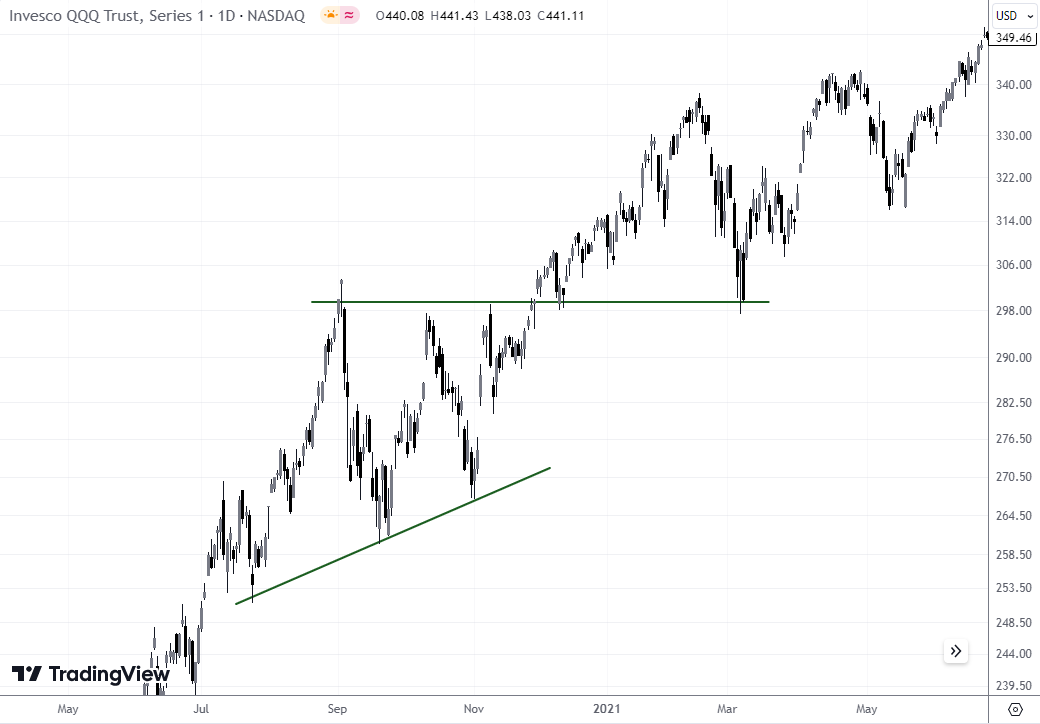
Ascending triangle pattern. Example from QQQ (Nasdaq) chart
The point is that after a breakdown, the upper line of the pattern can change its role from resistance to support, as it happened with the psychological level of $300.
Concluding the review of examples, it should be noted that:
-
pattern construction is always connected with a subjective point of view on price dynamics
-
when breaking a pattern, the price does not always enter a strong uptrend, sometimes it can be a false breakdown
-
it is not uncommon for an ascending triangle to become a bearish pattern. A failed bullish breakout of the pattern should alert the trader - is the pattern an indication that the bullish forces are exhausted under important resistance?
Are ascending triangle patterns reliable?
Here are some interesting statistics regarding the reliability and relevance of the ascending triangle pattern and how it pertains to trading:
-
According to Tom Bulkowski's research, the success rate of an ascending triangle is an 83% chance of an average of 43 percent price increase in a bull market on an upward breakout
-
The more touches on the resistance line and the more horizontal it is, the more reliable the pattern is considered
-
Ascending triangles are most reliable when found in an uptrend, with the horizontal line becoming more distinct as the pattern progresses
What is the difference between Ascending Triangle and other patterns?
| Pattern | Bullish or bearish | Difference |
|---|---|---|
|
Ascending Triangle |
Bullish |
Formed by a horizontal resistance and rising support line, suggests accumulation of buyers and a likely breakout upwards |
|
Bearish |
Features a downward trend followed by a consolidating rectangular pattern that slopes up slightly, implying continuation of the bearish trend |
|
|
Bearish |
Consists of two upward-sloping lines converging, indicating a potential reversal from bullish to bearish momentum |
|
|
Bearish |
Created by a horizontal support and descending resistance line, signaling sellers are pushing the price down, often leads to a downward breakout |
Expert Opinion:
The ascending triangle pattern often serves as a harbinger of bullish momentum, acting as a pivotal gauge for trader sentiment. Its horizontal resistance and ascending support tell a narrative of persistent buyers outpacing sellers at every turn, culminating in a pressure cooker of demand. When it breaks, it's not just a pattern completion, it's the market shouting 'buyers have won', a signal savvy traders heed to capitalize on the ensuing climb.

Summary
The ascending triangle pattern stands as a powerful tool in a trader's arsenal, offering clear signals for potential bullish breakouts. Its distinct characteristics provide strategic entry and exit points, making it invaluable for anticipating market movements. Whether trading Forex or cryptocurrencies, recognizing and responding to this pattern can significantly enhance the effectiveness of one’s trading strategy.
As with any technical analysis tool, confirmation through volume and subsequent price action is key to capitalizing on the ascending triangle's predictive strength.
Glossary for novice traders
-
1
Price action trading
Price action trading is a trading strategy that relies primarily on the analysis of historical price movements and patterns in financial markets, such as stocks, currencies, or commodities. Traders who use this approach focus on studying price charts, candlestick patterns, support and resistance levels, and other price-related data to make trading decisions.
-
2
Forex Trading
Forex trading, short for foreign exchange trading, is the practice of buying and selling currencies in the global foreign exchange market with the aim of profiting from fluctuations in exchange rates. Traders speculate on whether one currency will rise or fall in value relative to another currency and make trading decisions accordingly. However, beware that trading carries risks, and you can lose your whole capital.
-
3
Crypto trading
Crypto trading involves the buying and selling of cryptocurrencies, such as Bitcoin, Ethereum, or other digital assets, with the aim of making a profit from price fluctuations.
-
4
Options trading
Options trading is a financial derivative strategy that involves the buying and selling of options contracts, which give traders the right (but not the obligation) to buy or sell an underlying asset at a specified price, known as the strike price, before or on a predetermined expiration date. There are two main types of options: call options, which allow the holder to buy the underlying asset, and put options, which allow the holder to sell the underlying asset.
-
5
Long position
A long position in Forex, represents a positive outlook on the future value of a currency pair. When a trader assumes a long position, they are essentially placing a bet that the base currency in the pair will appreciate in value compared to the quote currency.
Related Articles


Team that worked on the article

Vuk stands at the forefront of financial journalism, blending over six years of crypto investing experience with profound insights gained from navigating two bull/bear cycles. A dedicated content writer, Vuk has contributed to a myriad of publications and projects. His journey from an English language graduate to a sought-after voice in finance reflects his passion for demystifying complex financial concepts, making him a helpful guide for both newcomers and seasoned investors.

Dr. BJ Johnson is a PhD in English Language and an editor with over 15 years of experience. He earned his degree in English Language in the U.S and the UK. In 2020, Dr. Johnson joined the Traders Union team. Since then, he has created over 100 exclusive articles and edited over 300 articles of other authors.

Mirjan Hipolito is a journalist and news editor at Traders Union. She is an expert crypto writer with five years of experience in the financial markets. Her specialties are daily market news, price predictions, and Initial Coin Offerings (ICO).
