Single Candlestick Patterns: Definition, Guide

The best single candlestick patterns are:
-
Hammer - indicates potential bullish reversals after a downtrend
-
Hanging Man - indicates potential bearish reversals after an uptrend
-
Inverted Hammer - indicates a potential trend shift when observed following a downtrend
-
Shooting Star - indicates potential reversals after an uptrend
-
Marubozu - can occur as either bullish or bearish
-
Spinning Top - often signifies indecision in the market
-
Doji - indicating that neither buyers nor sellers have been able to gain control during the trading period
Ever wondered what those little candles on stock charts represent? Those aren't just price movements; they're a visual language called candlestick patterns.
-
What is the most successful candlestick pattern?
The most successful candlestick pattern is subjective and varies based on market conditions and individual trading strategies.
-
How do you read a single candlestick?
To read a single candlestick, analyze its open, high, low, and close prices to understand market sentiment and potential price movements.
-
What is the single candlestick pattern reversal?
A single candlestick pattern reversal indicates a potential change in the direction of the prevailing trend based on the characteristics of a single candlestick.
-
Is a hammer a single candlestick pattern?
Yes, a hammer is a single candlestick pattern characterized by a small body near the top of the price range and a long lower shadow, signaling potential bullish reversal.
Understanding a single candlestick patterns
Single candlestick patterns represent unique candle formations that offer trading insights within a single candle. These patterns play a vital role in technical analysis by revealing market psychology during a specific timeframe. Unlike multi-candlestick patterns, which necessitate the presence of two or more candles, single candlestick patterns can detect potential reversals or continuations of the prevailing trend based solely on the characteristics of one candle.
These patterns depict the ongoing battle between buyers and sellers within the candle's duration, indicating shifts in market sentiment. Notable single candlestick patterns such as the hammer, inverted hammer, shooting star, and hanging man exhibit distinct shapes that signify potential bullish or bearish reversals when observed at market bottoms or tops, respectively. For instance, a hammer featuring a small body and a lengthy lower wick reflects robust buying pressure and may indicate a potential upward reversal if spotted at the conclusion of a downtrend.
Best Forex Brokers


Single candlestick patterns explained with examples
Hammer
The hammer candlestick pattern
The hammer candlestick pattern indicates potential bullish reversals after a downtrend. Its structure comprises a small real body positioned near the top of the trading range, with minimal to no upper shadow and a long lower shadow. Visually, it resembles a hammer, featuring a short body atop a long lower wick, suggesting buying pressure that propelled the price back up from an intraday low.
Recognition criteria for a hammer:
-
Small real body: Look for a small body situated near the top of the price range.
-
Long lower shadow: Ensure the lower shadow is at least twice the height of the real body.
-
Minimal or no upper shadow: Ideally, there should be little to no upper shadow extending from the real body.
-
Price rejection evidence: Seek evidence of price rejection, such as a long tail or gap down.
-
Volume Increase: Prioritize hammers accompanied by increased volume, indicating heightened participation during low tests.
The appearance of Hammer on the downtrend is a confirmation of oversold conditions and the formation of a strong support zone. But this does not mean that the reversal will happen on the next candle - a small 2-3 bar flat is possible beforehand.
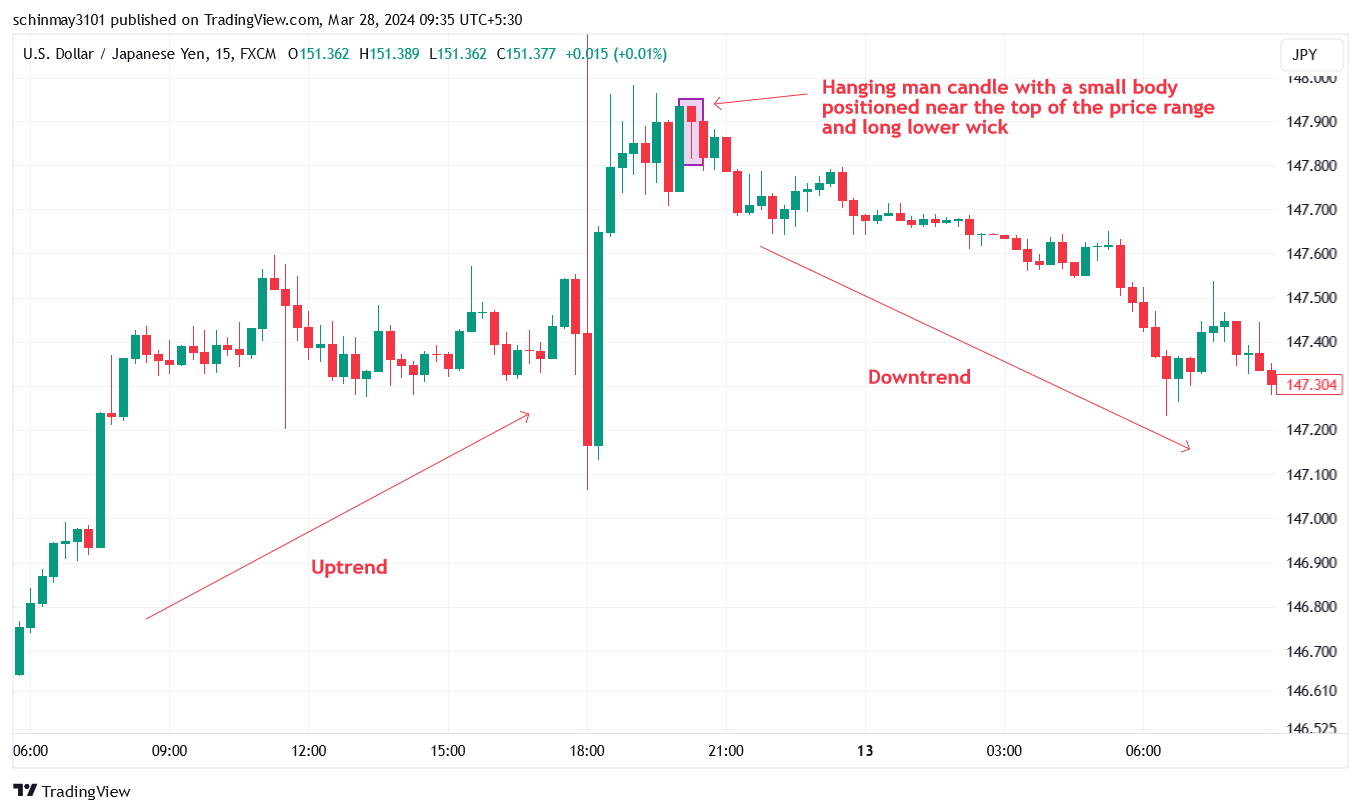
Hanging man
The hanging man candlestick pattern
The hanging man candlestick pattern indicates potential bearish reversals after an uptrend and is quite similar to the hammer pattern. It comprises of a small body positioned near the top of the price range, either lacking an upper shadow or featuring a very short one, and a long lower shadow that is at least twice the length of the body. Resembling a hanging man with dangling legs, this pattern typically emerges at the peak of an uptrend, suggesting a potential shift towards a downward trend.
Recognition criteria for a Hanging man:
-
Small real body: The real body should be relatively small, not exceeding half the length of the entire candlestick.
-
Long lower wick: Ensure the lower wick is at least twice the length of the real body.
-
Minimal upper wick: Ideally, there should be no upper wick, or if present, it should be substantially shorter than the lower wick.
-
Uptrend context: The hanging man should be observed at the end of an uptrend, signaling a potential bearish reversal.
-
Confirmation: Seek a subsequent bearish candlestick following the hanging man to strengthen confidence in the reversal signal.
Inverted Hammer
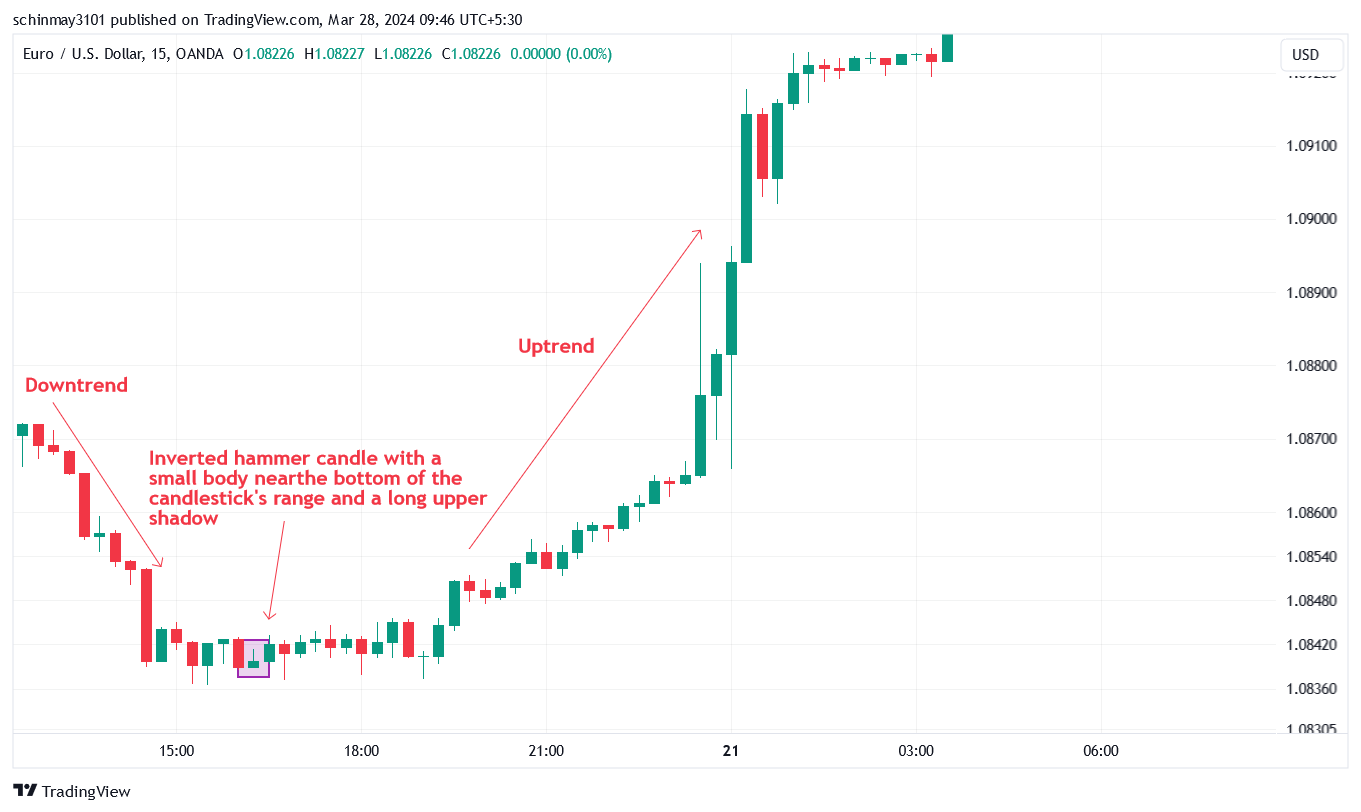
The inverted hammer candlestick pattern
The inverted hammer is a bullish reversal candlestick pattern that indicates a potential trend shift when observed following a downtrend. This pattern is characterized by a small body near the bottom of the candlestick's range, accompanied by a long upper shadow and minimal to no lower shadow. The longer upper shadow signifies buyers' attempts to drive the price higher after an initial decline, countered by selling pressure. Nonetheless, buyers manage to push the price back up, closing above the opening level.
Recognition criteria for an Inverted Hammer:
-
Small real body: Ensure the real body is not more than half the length of the entire candlestick.
-
Long upper wick: The upper wick should be at least twice the length of the real body.
-
Minimal lower wick: Ideally, there should be no lower wick or a significantly shorter one compared to the upper wick.
-
Downtrend context: Look for the inverted hammer at the conclusion of a downtrend, indicating a potential bullish reversal.
-
Confirmation: Seek a subsequent bullish candlestick following the inverted hammer to enhance confidence in the reversal signal.
This pattern is most important when it occurs near a strong price level. If the Inverted Hammer candlestick appears randomly, in the middle of a strong trend and without additional confirmation, its signal is canceled.
Shooting Star
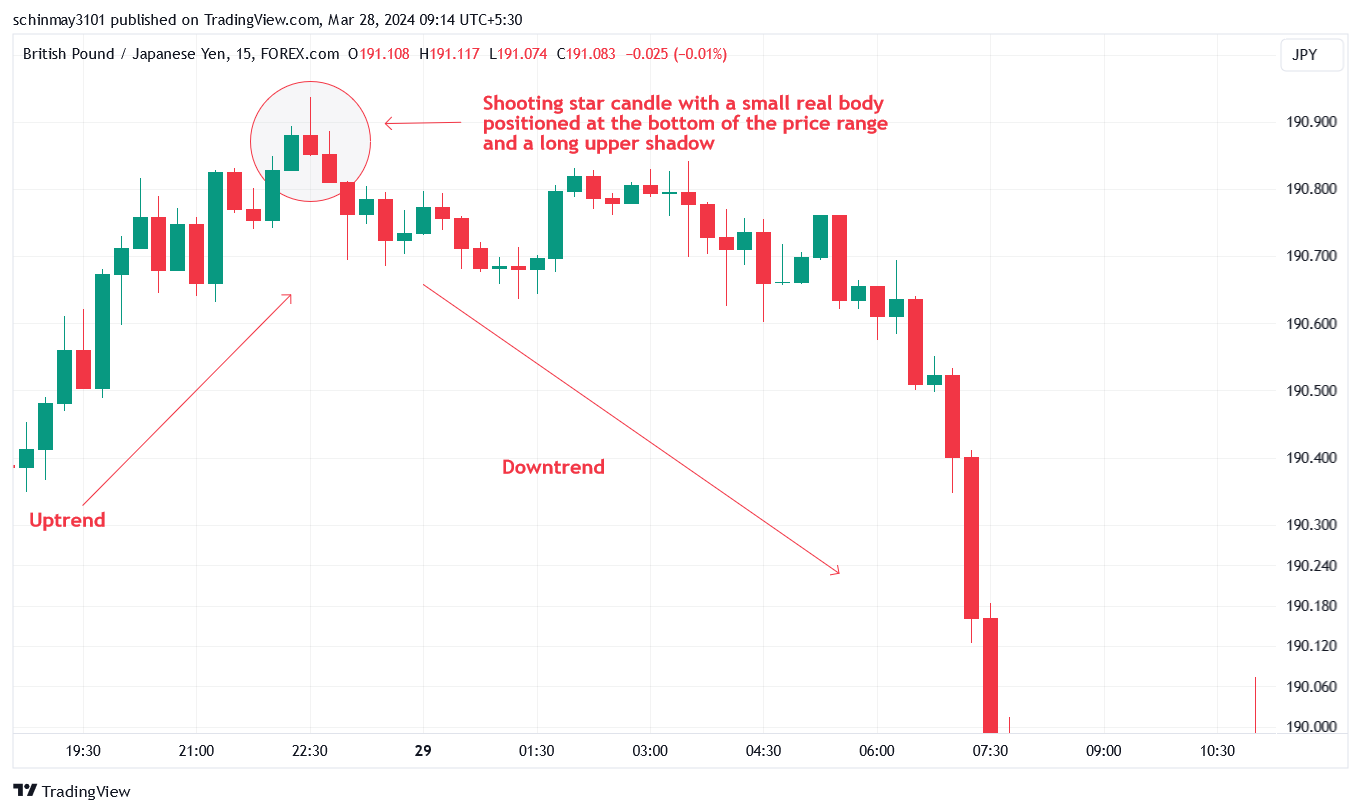
The shooting star candlestick pattern
The shooting star candlestick pattern indicates potential reversals after an uptrend. This pattern is characterized by a small real body positioned at the bottom of the price range and a long upper shadow, resembling a candlestick with a small body and an elongated wick pointing upwards.
Recognition criteria for a Shooting Star:
-
Small real body: Ensure the candlestick's body is small and situated at the bottom of the price range.
-
Long upper shadow: The upper shadow should be at least twice the length of the real body.
-
Minimal or no Lower shadow: Ideally, there should be no lower shadow or a very brief one.
-
Resistance zone: The pattern's significance increases when it appears in a notable resistance zone.
-
Confirmation: Some traders await confirmation through subsequent candles closing lower than the shooting star pattern, while others may act promptly upon identifying the pattern.
Marubozu
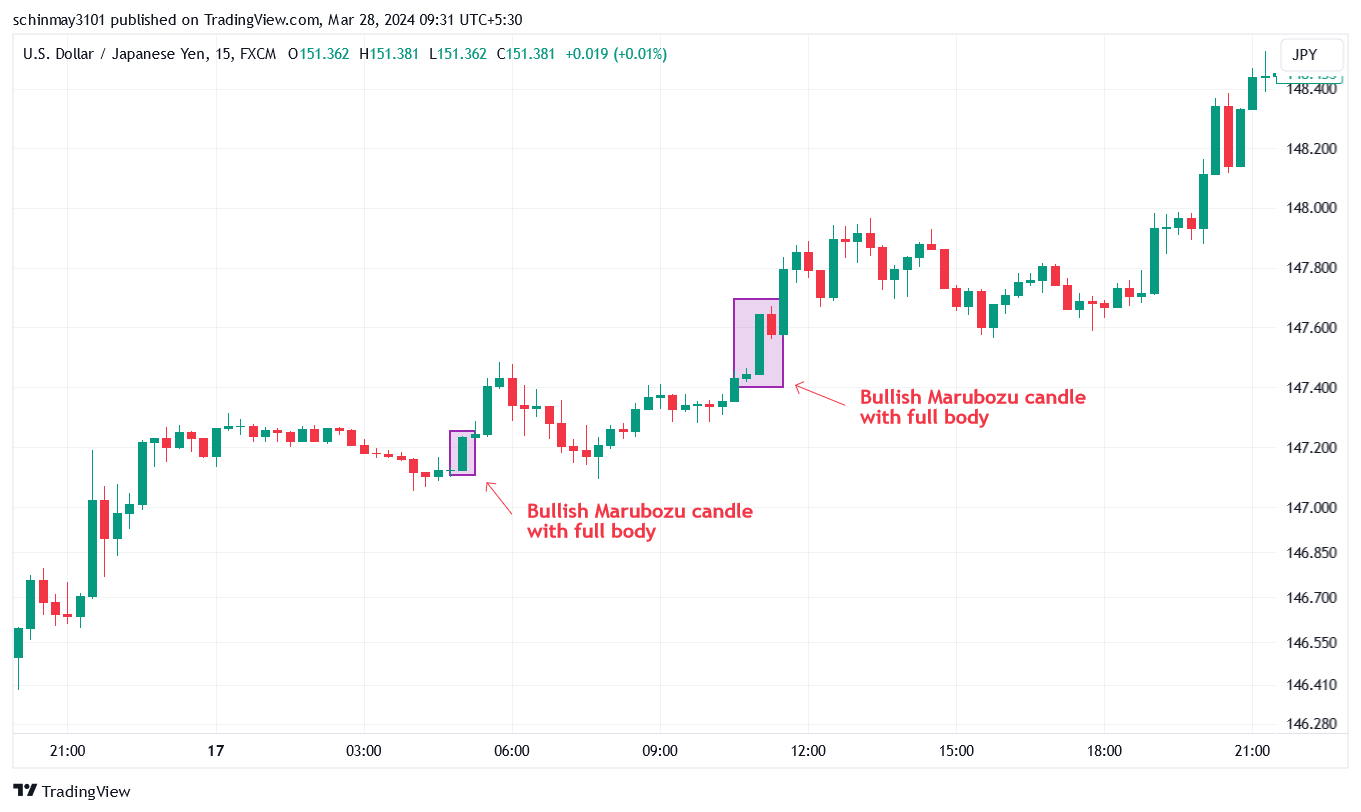
Marubozu candlestick pattern
A Marubozu candlestick can occur as either bullish or bearish. A bullish Marubozu occurs when the candle opens at its low and closes at its high without any lower or upper wicks, signifying dominance in buying activity. The formation of this pattern on the price chart means that the market is under full control of buyers and the price is more likely to continue the uptrend.
Conversely, a bearish Marubozu occurs when the candle opens at its high and closes at its low with no wicks, indicating dominance in selling activity and continuation of the downtrend.
Recognition criteria for a Marubozu:
-
Absence of wicks: The candlestick should exhibit no wicks or extremely small ones.
-
Strong buying/selling pressure: It indicates significant buying or selling pressure prevailing in the market.
-
Opening and closing prices: The opening and closing prices should mark the highest and lowest points for the given period, respectively.
Spinning Top
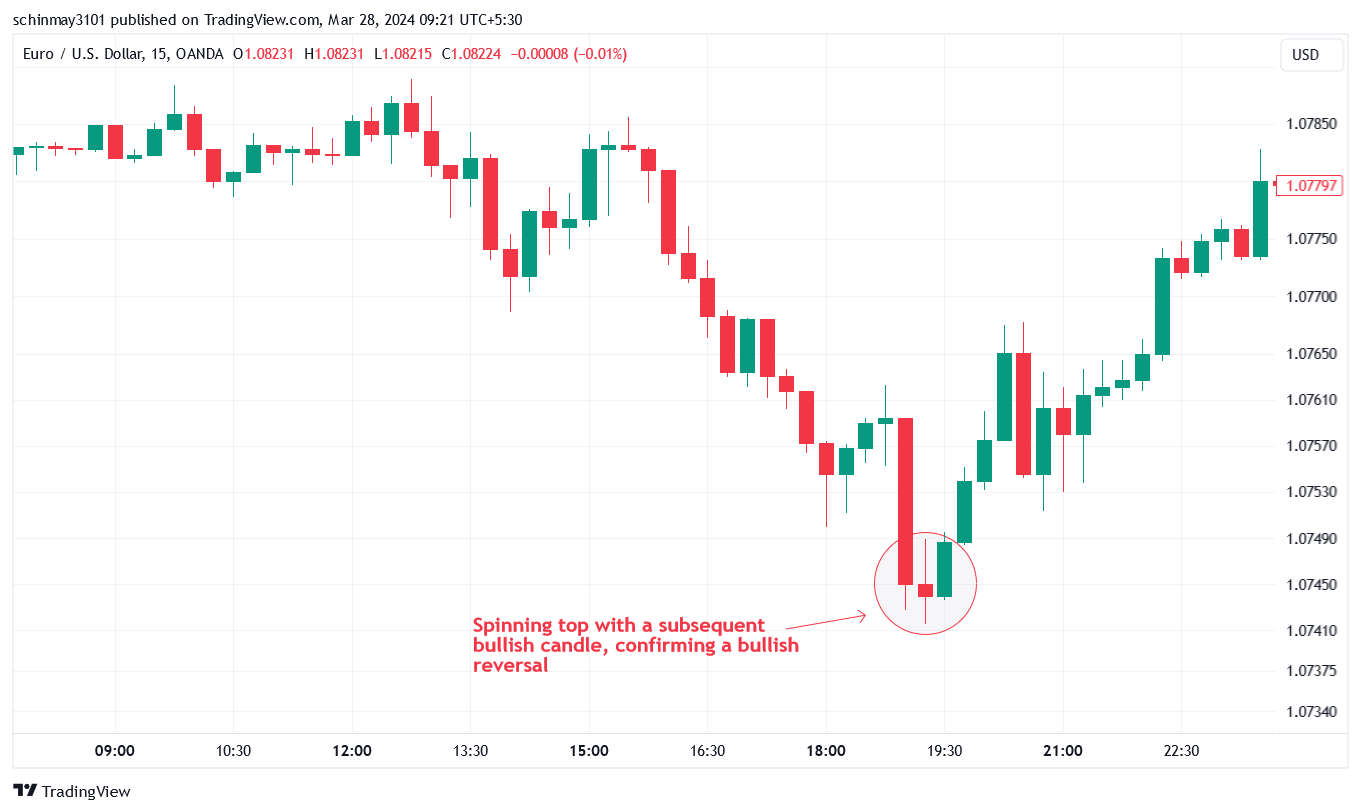
The spinning top candlestick pattern
The spinning top candlestick pattern often signifies indecision in the market. This formation typically occurs when there is uncertainty or a balance between buyers and sellers in the market. Traders interpret the spinning top as a signal of potential trend reversal or continuation, depending on its placement within the price chart and the preceding market conditions.
Recognition criteria for a Spinning Top:
-
Small real body: The candlestick should feature a small real body.
-
Long upper and lower wicks: There should be long upper and lower wicks.
-
Indecision: The spinning top suggests uncertainty or indecision in the market.
-
Potential reversal or continuation: Traders analyze the spinning top's position within the price chart and preceding market conditions to determine whether it signals a potential trend reversal or continuation.
-
Confirmation: Some traders may wait for confirmation from subsequent candles to validate the spinning top signal before making trading decisions.
Doji
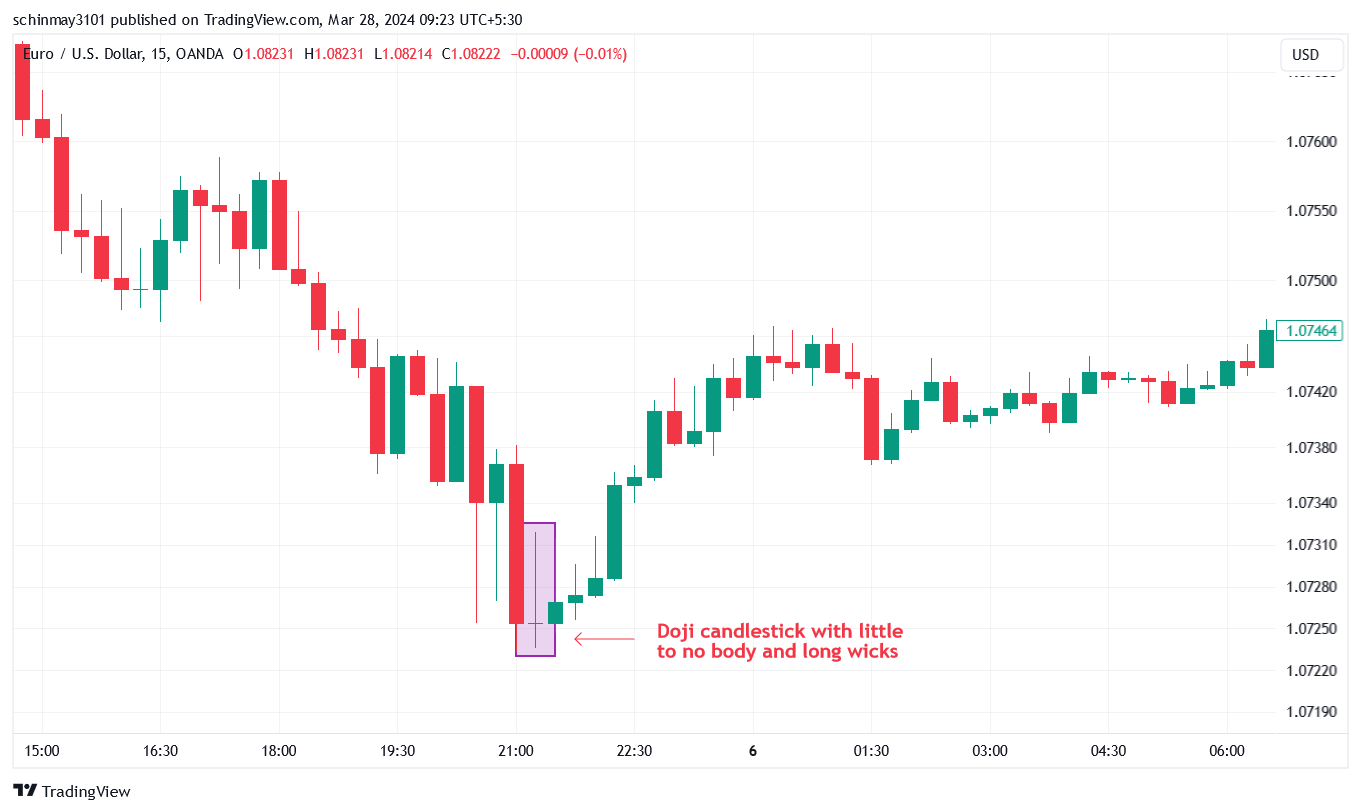
Doji candlestick pattern
A doji appears as a candlestick with a very small or nonexistent body, and long upper and lower wicks, indicating that neither buyers or sellers have been able to gain control during the trading period. Traders interpret the appearance of a doji as a potential reversal or continuation signal, depending on its placement within the price chart and the prevailing market conditions.
Recognition criteria for a Doji:
-
Small or no real body: The candlestick should have a small or non-existent body.
-
Equal or nearly equal opening and closing prices: The opening and closing prices should be nearly identical or exactly the same.
-
Indecision: The presence of a doji suggests indecision in the market.
-
Potential reversal or continuation: Traders analyze the doji's position within the price chart and the preceding market conditions to determine whether it signals a potential trend reversal or continuation.
-
Confirmation: Some traders may wait for confirmation from subsequent candles to validate the doji signal before making trading decisions.
This pattern is recommended for trading on timeframes of at least H1. On the lower timeframes it appears too often to be taken as a serious signal for a particular movement. In addition, there is market noise on these timeframes, which misleads the trader.
Are candlestick patterns reliable?
Candlestick patterns serve as a widely used tool in technical analysis, offering both strengths and weaknesses. On one hand, they help identify potential turning points in price action, providing traders with valuable entry and exit points. Moreover, candlestick patterns are visually simple and widely adopted by traders, contributing to market confirmation when recognized by many.
However, TU expert Oleg Pylypenko suggests that candlestick patterns are not flawless predictors, merely suggesting possibilities of trend reversals or continuations based on historical data. Their interpretation can be subjective, and they often generate false signals, leading to misguided trade decisions. Additionally, their reliability hinges significantly on the surrounding market context, such as prevailing trends and support/resistance levels.
Best ways to use single candlestick patterns
Utilizing single candlestick patterns effectively involves combining them with other technical tools and understanding their context. Avoid relying solely on single patterns; instead, combine them with indicators like moving averages, volume analysis, support/resistance levels, and trendlines. Consider chart patterns alongside candlestick patterns for a stronger trading signal. Additionally, understanding the context is crucial; assess the trend context and consider external factors such as news and events that may impact price movements. Wait for confirmation before making a trade decision, ensuring a follow-through candlestick validates the intended direction. Refine your strategy by identifying patterns that perform better under specific market conditions through backtesting on historical data.
Expert Opinion
As a seasoned trader and technical analysis expert, I advise incorporating single candlestick patterns into your trading strategy with caution and discernment. While these patterns can offer valuable insights into market sentiment and potential price movements, it's essential to avoid relying solely on them for making trading decisions. Instead, consider using them as one component of a comprehensive analysis approach.
My tip is to prioritize the quality of the candlestick patterns over quantity. Rather than chasing after every single pattern that appears on the chart, focus on identifying high-quality setups that align with other technical indicators and the overall market context. Additionally, always wait for confirmation from subsequent price action before entering a trade based solely on a single candlestick pattern.

Summary
In this article, the experts at TU explored the world of single candlestick patterns in technical analysis, emphasizing their significance, recognition, and effective utilization. While these patterns offer valuable insights into market sentiment and potential price movements, it's crucial to understand their strengths and weaknesses. By combining single candlestick patterns with other technical tools like moving averages, volume analysis, and chart patterns, traders can enhance the reliability of their trading signals.
Glossary for novice traders
-
1
Forex Trading
Forex trading, short for foreign exchange trading, is the practice of buying and selling currencies in the global foreign exchange market with the aim of profiting from fluctuations in exchange rates. Traders speculate on whether one currency will rise or fall in value relative to another currency and make trading decisions accordingly. However, beware that trading carries risks, and you can lose your whole capital.
-
2
Options trading
Options trading is a financial derivative strategy that involves the buying and selling of options contracts, which give traders the right (but not the obligation) to buy or sell an underlying asset at a specified price, known as the strike price, before or on a predetermined expiration date. There are two main types of options: call options, which allow the holder to buy the underlying asset, and put options, which allow the holder to sell the underlying asset.
-
3
Upward Trend
Uptrend is a market condition in which prices are generally rising. Uptrends can be identified by using moving averages, trendlines, and support and resistance levels.
-
4
Forex indicators
Forex indicators are tools used by traders to analyze market data, often based on technical and/or fundamental factors, to make informed trading decisions.
-
5
Index
Index in trading is the measure of the performance of a group of stocks, which can include the assets and securities in it.
Related Articles


Team that worked on the article

Chinmay Soni is a financial analyst with more than 5 years of experience in working with stocks, Forex, derivatives, and other assets. As a founder of a boutique research firm and an active researcher, he covers various industries and fields, providing insights backed by statistical data. He is also an educator in the field of finance and technology.
As an author for Traders Union, he contributes his deep analytical insights on various topics, taking into account various aspects.

Dr. BJ Johnson is a PhD in English Language and an editor with over 15 years of experience. He earned his degree in English Language in the U.S and the UK. In 2020, Dr. Johnson joined the Traders Union team. Since then, he has created over 100 exclusive articles and edited over 300 articles of other authors.

Mirjan Hipolito is a journalist and news editor at Traders Union. She is an expert crypto writer with five years of experience in the financial markets. Her specialties are daily market news, price predictions, and Initial Coin Offerings (ICO).
