How to trade Bearish Hammer Candlestick Pattern


Editorial Note: While we adhere to strict Editorial Integrity, this post may contain references to products from our partners. Here's an explanation for How We Make Money. None of the data and information on this webpage constitutes investment advice according to our Disclaimer.
The bearish hammer trading strategy is a candlestick pattern utilized in technical analysis. It is characterized by a small body and a long lower shadow, indicating selling pressure in the market. Traders interpret the bearish hammer as a potential signal for a reversal from an upward trend to a downward trend.
Every successful trade begins with recognizing the right market signals. The bearish hammer pattern is one of technical analysis's most telling indicators of potential market reversals. This distinct candlestick formation, marked by a small body and long lower shadow, serves as a warning sign that an upward trend may be losing steam.
While the pattern itself is straightforward, its proper interpretation can mean the difference between profitable trades and missed opportunities. This guide breaks down everything you need to know about trading the bearish hammer - from spotting the pattern to executing trades with confidence.
What is a hammer candlestick?
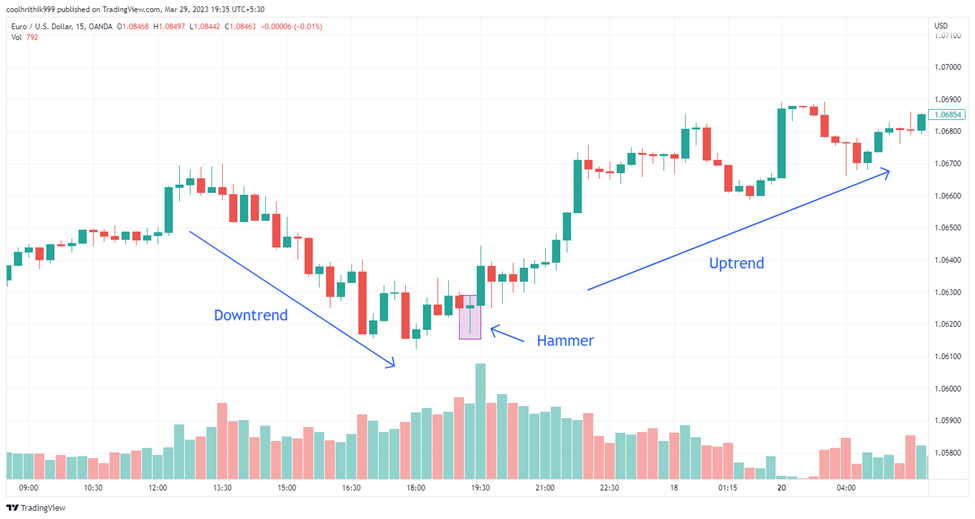
The hammer candlestick pattern is highly decorated in the realm of technical analysis, favored by many traders seeking to predict potential reversals in price trends. These candlestick patterns, known as hammers, offer valuable insights for price action traders. Depending on the context and timing, they can indicate a bullish reversal following a downtrend or a bearish reversal after an upswing. By combining the observation of hammer candles with other technical indicators, traders gain the advantage of identifying favorable entry points for both long and short positions.
What is a bearish hammer candlestick pattern?
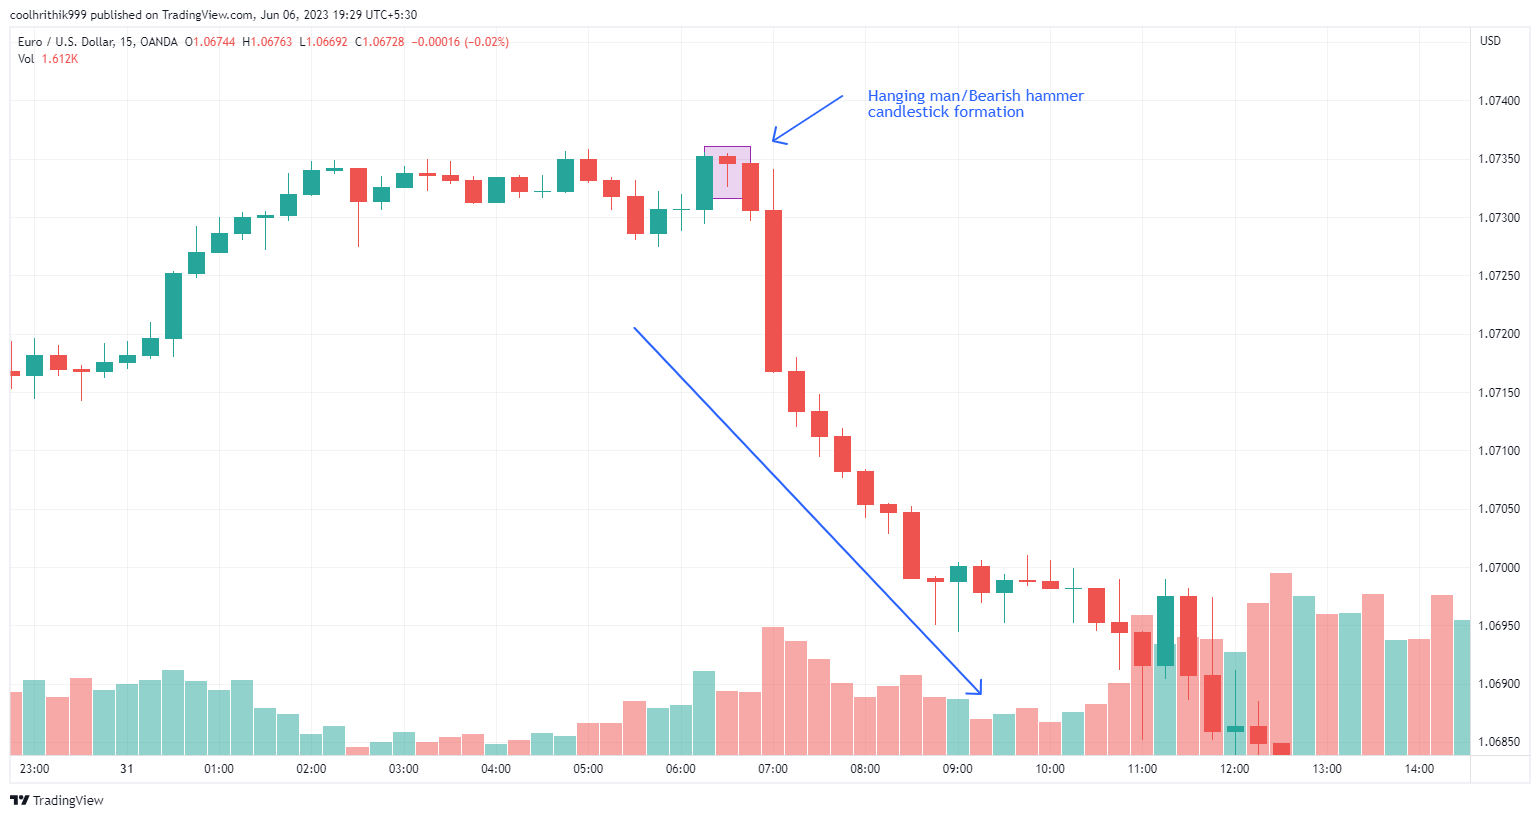
The bearish hammer candlestick pattern, also referred to as a hanging man, is a distinctive formation that traders closely observe in financial markets. This pattern occurs when the opening price exceeds the closing price, causing the candle to appear red. The crucial characteristic of a bearish hammer is the presence of a wick, which indicates a significant level of selling pressure within the market. This selling pressure serves as a warning sign to traders, suggesting the possibility of an impending reversal towards a downward trend.
What does the bearish hammer pattern consist of?
The bearish hammer candlestick pattern, commonly known as a hanging man, exhibits specific characteristics that traders pay close attention to. Typically appearing in a dark or red color, the hanging man candlestick indicates a bearish sentiment in the market. Crucially, the lower wick of the hanging man should be equal to or more than double the length of the body. This significant difference provides evidence of strong selling pressure from investors with a bearish intent.
Moreover, experts suggest that the strength of the hanging man pattern is bolstered by observing the volume of trading, as indicated by the girth of the candlestick. A substantial volume can further reinforce the likelihood of a trend reversal. Additionally, the upper wick of the hanging man should be relatively small, ideally close to the length of the lower wick. This characteristic complements a small body, emphasizing the significance of these features in identifying a bearish hammer pattern.
Which brokers offer the lowest costs for active trading?
We analyzed three brokers that provide ECN or Raw spread accounts. Typically, these accounts are the most affordable choices for active traders who rely on technical analysis.
| Min. deposit, $ | ECN Commission | ECN Spread EUR/USD | ECN Spread GBP/USD | Regulation | Open account | |
|---|---|---|---|---|---|---|
| 10 | 7 | 0.1 | 0.15 | No | Go to broker Your capital is at risk.
|
|
| No | 3.5 | 0.15 | 0.2 | FSC (BVI), ASIC, IIROC, FCA, CFTC, NFA | Go to broker Your capital is at risk. |
|
| 100 | 5 | 0.2 | 0.4 | CIMA, FCA, FSA (Japan), NFA, IIROC, ASIC, CFTC | Study review |
Pros and cons of bearish hammer trading strategy
The bearish hammer trading strategy, centered around the recognition and utilization of the bearish hammer candlestick pattern, offers traders potential advantages as well as some limitations. Understanding the pros and cons of this strategy is crucial for traders seeking to make informed decisions and manage their risk effectively.
- Pros
- Cons
- Reversal signals: The bearish hammer pattern serves as a powerful indicator of potential market reversals. When properly identified, it can signal a shift from an upward trend to a downward trend. Traders who successfully recognize and act upon these signals can potentially enter trades at opportune moments, capturing profits as prices decline
- Entry and exit points: The bearish hammer trading strategy provides clear entry and exit points for trades. The pattern's formation and characteristics help traders determine optimal points to enter short positions or close long positions. This assists in establishing a well-defined trading plan and managing risk more effectively
- Risk-to-reward ratio: By capitalizing on bearish hammer patterns, traders can aim for attractive risk-to-reward ratios. The pattern's distinctive structure, with a relatively small body and significant wick, allows for the placement of tight stop-loss orders and the potential for larger profit targets. This favorable risk-to-reward ratio can enhance profitability in trading
- Compatibility with technical analysis: The bearish hammer strategy can be easily integrated into broader technical analysis approaches. Traders often combine the identification of bearish hammers with other indicators, such as trendlines, moving averages, or oscillators, to reinforce their trading decisions. This compatibility allows for a more comprehensive analysis and increased confidence in trade execution
- False signals: Like any trading strategy, the bearish hammer strategy is not fool-proof and can produce false signals. In some cases, the pattern may not lead to a substantial market reversal, causing trades based on it to result in losses. Traders must exercise caution and utilize additional confirmatory signals or filters to validate the reliability of the bearish hammer pattern
- Subjectivity in identification: The identification of bearish hammer patterns can be subjective, leading to potential discrepancies among traders. Different interpretations of the pattern's characteristics, such as the length of the wicks or the size of the body, may result in varied conclusions regarding its significance. This subjectivity introduces an element of uncertainty and requires traders to develop a robust understanding of the pattern to minimize error
- Market conditions: The effectiveness of the bearish hammer strategy can vary depending on market conditions. In strongly trending markets or during periods of high volatility, the significance of individual candlestick patterns may diminish. Traders must consider the broader market context and incorporate additional technical and fundamental analysis to improve decision-making
How to trade the bearish hammer pattern successfully
To trade the bearish hammer pattern effectively, experts suggest following these key points:
Identify the pattern: Begin by recognizing the bearish hammer pattern on the price chart. Look for a candlestick with a long lower shadow, indicating the entry of sellers into the market. Remember, longer lower shadows tend to be more reliable signals than those with shorter shadows. The color of the bearish hammer candlestick can be either red or green
Understand candlestick colors: A red bearish hammer forms when the high and opening prices are the same, while a green bearish hammer occurs when the high and closing prices match. The red bearish hammer is generally considered a stronger bearish signal. Keep in mind the "rule of two," where the signal from one bearish hammer is confirmed when another bearish candlestick forms either on the previous or next candlestick
Confirm with additional signals: For a more reliable trade setup, look for the presence of the next bearish candlestick and a broken support trendline. The combination of these signals strengthens the bearish sentiment and provides a more positive indication to enter short positions
Volume confirmation: Pay attention to the trading volume as the bearish hammer pattern forms. An increase in volume during the pattern formation adds further credibility to the potential reversal. Higher trading volume indicates increased market participation and reinforces the validity of the bearish signal
Entry points: Traders have two options for entering short positions based on the bearish hammer pattern. They can either enter at the closing price of the hanging candlestick or at the opening price of the subsequent candlestick, depending on their trading strategy and risk tolerance
Setting stop-loss: The highest point of the bearish hammer candlestick serves as an optimal level to place a stop-loss order. Placing the stop-loss above this point helps protect against potential losses in case the market exhibits unexpected bullish behavior
Is the bearish hammer reliable?
The reliability of the bearish hammer pattern, like any technical analysis tool, is a subject of discussion among traders and analysts. While the bearish hammer can provide valuable insights into potential market reversals, it is important to consider its reliability within the broader context of trading strategies. Here are factors to consider when evaluating the reliability of the bearish hammer pattern:
Confirmation: Relying solely on the bearish hammer may result in false signals, as individual candlestick patterns can occasionally lead to misleading conclusions. To enhance reliability, it is often recommended to seek confirmation from other technical indicators or patterns. Traders often incorporate additional analysis techniques, such as trendlines, support and resistance levels, or volume indicators, to validate the bearish hammer signal
Market conditions: The reliability of the bearish hammer pattern can vary depending on market conditions. It may perform better in certain market environments, such as trending markets or periods of high volatility, where the bearish signal has a higher probability of manifesting as a significant price reversal. Conversely, in range-bound or consolidating markets, the bearish hammer signal may be less reliable and produce less consistent results
Timeframe considerations: The reliability of the bearish hammer pattern can also depend on the timeframe being analyzed. Patterns that appear on longer timeframes, such as daily or weekly charts, tend to carry more weight and have greater reliability compared to those observed on shorter intraday time frames. Traders should consider the timeframe they are trading on and evaluate the reliability of the bearish hammer pattern accordingly
Risk management: In addition to the reliability of the bearish hammer pattern, proper risk management is crucial for success. Traders should always incorporate appropriate risk management techniques, such as setting stop-loss orders, managing position sizes, and diversifying their portfolios. This helps mitigate potential losses if the bearish hammer pattern fails to yield the expected results
Backtesting and analysis: Traders can enhance their understanding of the bearish hammer pattern's reliability by conducting thorough backtesting and analysis. By reviewing historical price data and comparing the occurrence of bearish hammer patterns with subsequent price movements, traders can gain insights into the pattern's effectiveness in different market conditions. This analysis helps identify patterns and trends that can inform trading decisions
Expert Opinion

Traders should take into consideration that the pattern works across all timeframes, but its reliability increases significantly with higher timeframes - daily charts show success rates above 65%, while 4-hour timeframes average 45-55%, and lower timeframes require strong additional confirmation.
The most profitable bearish hammer setups I've observed share these characteristics:
Appear after a price rally of at least 8-10 candlesticks
Form near key resistance levels or round numbers
Show declining volume during the preceding uptrend
Coincide with overbought readings on the RSI (above 70)
Also, I’d like to suggest some risk management tips. Rather than using a generic stop-loss above the hammer's high, consider these more refined approaches:
For aggressive trades: Place stops at 1.1x the hammer's high
For conservative trades: Wait for the next day's opening and place stops at 1.5x the hammer's body length
Target profit at 2-3x your risk for an optimal risk-reward ratio
FAQs
What is a bearish hammer pattern?
The bearish hammer pattern, also known as a hanging man, is a candlestick pattern in technical analysis. It appears as a single candlestick with a small body and a long lower shadow or wick. The opening price is typically higher than the closing price, resulting in a red or dark-colored candle. The presence of the long lower shadow indicates that sellers have entered the market, potentially signaling a reversal from an upward trend to a downward trend.
Can a hammer be bearish?
Yes, a hammer candlestick can be bearish. While a traditional hammer pattern is considered a bullish reversal signal, a bearish hammer pattern refers to a variation where the opening price is above the closing price, resulting in a red or dark-colored candle. The long lower shadow in a bearish hammer indicates selling pressure and the potential for a reversal to the downside. It suggests that the bears have gained strength and may push the price lower.
What happens after a bearish hammer?
After a bearish hammer pattern, the subsequent price action becomes crucial to determine the confirmation of the bearish signal. Traders typically look for additional bearish follow-through in the form of further downward price movement. This confirmation may come in the form of subsequent bearish candlestick patterns, a break of support levels, or a continuation of selling pressure. It is important to note that not all bearish hammer patterns lead to a significant price reversal, so it is necessary to monitor the price action and consider other technical indicators for confirmation.
How do you trade with a hammer?
Trading with a hammer involves a combination of recognizing the pattern and employing appropriate trading strategies. Here are general steps to consider:
Identify the Hammer: Look for a candlestick with a small body and a long lower shadow, where the opening price is higher than the closing price, resulting in a red or dark-colored candle
Confirm the Pattern: Seek additional confirmation signals to increase the reliability of the hammer pattern. This can include analyzing volume, trendlines, support and resistance levels, or other technical indicators
Determine Entry and Exit Points: Establish entry points based on your trading strategy, such as entering a short position at the opening of the next candlestick following the bearish hammer pattern. Set stop-loss orders above the high of the hammer to manage risk. Determine profit targets based on your trading plan and technical analysis
Monitor Price Action: Continuously monitor the price action following the bearish hammer pattern. Look for further bearish signals, breakouts, or changes in market conditions that support your trade. Adjust your trading strategy accordingly if the market conditions change
Editors' Top Picks and Insights

Hunting crypto owners: Why criminals have gone offline

BitMEX is shutting down: Why Trump could not save the exchange

Do governments need crypto workers?

Brent nears $100: Why oil prices are rising

Gram Wallet launch: Can Telegram bring crypto to the masses?

AI without limits: How dangerous are neural networks?
Related Articles
Team that worked on the article
Parshwa is a content expert and finance professional possessing deep knowledge of stock and options trading, technical and fundamental analysis, and equity research. As a Chartered Accountant Finalist, Parshwa also has expertise in Forex, crypto trading, and personal taxation.
Chinmay Soni is a financial analyst with more than 5 years of experience in working with stocks, Forex, derivatives, and other assets. As a founder of a boutique research firm and an active researcher, he covers various industries and fields, providing insights backed by statistical data.
Mirjan Hipolito is a journalist and news editor at Traders Union. She is an expert crypto writer with five years of experience in the financial markets.
An ECN, or Electronic Communication Network, is a technology that connects traders directly to market participants, facilitating transparent and direct access to financial markets.
A long position in Forex, represents a positive outlook on the future value of a currency pair. When a trader assumes a long position, they are essentially placing a bet that the base currency in the pair will appreciate in value compared to the quote currency.
An investor is an individual, who invests money in an asset with the expectation that its value would appreciate in the future. The asset can be anything, including a bond, debenture, mutual fund, equity, gold, silver, exchange-traded funds (ETFs), and real-estate property.
Risk management in Forex involves strategies and techniques used by traders to minimize potential losses while trading currencies, such as setting stop-loss orders and position sizing, to protect their capital from adverse market movements.
CFD is a contract between an investor/trader and seller that demonstrates that the trader will need to pay the price difference between the current value of the asset and its value at the time of contract to the seller.

-
 Afghanistan
-
 Albania
-
 Algeria
-
 Angola
-
 Argentina
-
 Armenia
-
 Australia
-
 Austria
-
 Azerbaijan
-
 Bahamas
-
 Bahrain
-
 Bangladesh
-
 Belarus
-
 Belgium
-
 Bolivia
-
 Botswana
-
 Brazil
-
 Brunei
-
 Bulgaria
-
 Cambodia
-
 Cameroon
-
 Canada
-
 Chile
Chile
-
 China
China
-
 Colombia
-
 Congo
Congo
-
 Costa Rica
-
 Cote d'Ivoire
-
 Croatia
-
 Cuba
Cuba
-
 Cyprus
-
 Czechia
-
 DR Congo
-
 Denmark
-
 Dominican Republic
-
 Ecuador
-
 Egypt
Egypt
-
 El Salvador
-
 Estonia
-
 Eswatini
-
 Ethiopia
-
 Finland
-
 France
-
 Georgia
-
 Germany
-
 Ghana
Ghana
-
 Greece
-
 Haiti
Haiti
-
 Hong Kong
-
 Hungary
-
 India
India
-
 Indonesia
-
 Iran, Islamic republic
-
 Iraq
Iraq
-
 Ireland
-
 Israel
-
 Italy
Italy
-
 Jamaica
-
 Japan
Japan
-
 Jordan
-
 Kazakhstan
-
 Kenya
Kenya
-
 Korea
Korea
-
 Kuwait
-
 Kyrgyzstan
-
 Laos
Laos
-
 Latvia
-
 Lebanon
-
 Lesotho
-
 Libya
Libya
-
 Lithuania
-
 Luxembourg
-
 Madagascar
-
 Malaysia
-
 Malta
Malta
-
 Mauritius
-
 Mexico
-
 Moldova
-
 Mongolia
-
 Montenegro
-
 Morocco
-
 Mozambique
-
 Myanmar
-
 Namibia
-
 Nepal
Nepal
-
 Netherlands
-
 New Zealand
-
 Nigeria
-
 North Macedonia
-
 Norway
-
 Oman
Oman
-
 Pakistan
-
 Palestine
-
 Panama
-
 Papua New Guinea
-
 Paraguay
-
 Peru
Peru
-
 Philippines
-
 Poland
-
 Portugal
-
 Puerto Rico
-
 Qatar
Qatar
-
 Reunion
-
 Romania
-
 Rwanda
-
 Saudi Arabia
-
 Serbia
-
 Singapore
-
 Slovakia
-
 Slovenia
-
 Somalia
-
 South Africa
-
 Spain
Spain
-
 Sri Lanka
-
 Sweden
-
 Switzerland
-
 Syria
Syria
-
 Taiwan
-
 Tajikistan
-
 Tanzania
-
 Thailand
-
 Trinidad and Tobago
-
 Tunisia
-
 Turkey
-
 UAE
UAE
-
 Uganda
-
 Ukraine
-
 United Kingdom
-
United States
-
 Uruguay
-
 Uzbekistan
-
 Venezuela
-
 Vietnam
-
 Yemen
Yemen
-
 Zambia
-
 Zimbabwe
- Forex
- Crypto
